Abstract
Study Objectives:
To determine the effects of mild airflow limitation on K-complex frequency and morphology and electroencephalogram (EEG) spectral power.
Methods:
Transient reductions in continuous positive airway pressure (CPAP) during stable N2 sleep were performed to induce mild airflow limitation in 20 patients with obstructive sleep apnea (OSA) and 10 healthy controls aged 44 ± 13 y. EEG at C3 and airflow were measured in 1-min windows to quantify K-complex properties and EEG spectral power immediately before and during transient reductions in CPAP. The frequency and morphology (amplitude and latency of P200, N550 and N900 components) of K-complexes and EEG spectral power were compared between conditions.
Results:
During mild airflow limitation (18% reduction in peak inspiratory airflow from baseline, 0.38 ± 0.11 versus 0.31 ± 0.1 L/sec) insufficient to cause American Academy of Sleep Medicine-defined cortical arousal, K-complex frequency (9.5 ± 4.5 versus 13.7 ± 6.4 per min, P < 0.01), N550 amplitude (25 ± 3 versus 27 ± 3 μV, P < 0.01) and EEG spectral power (delta: 147 ± 48 versus 230 ± 99 μV2, P < 0.01 and theta bands: 31 ± 14 versus 34 ± 13 μV2, P < 0.01) significantly increased whereas beta band power decreased (14 ± 5 versus 11 ± 4 μV2, P < 0.01) compared to the preceding non flow-limited period on CPAP. K-complex frequency, morphology, and timing did not differ between patients and controls.
Conclusion:
Mild airflow limitation increases K-complex frequency, N550 amplitude, and spectral power of delta and theta bands. In addition to providing mechanistic insight into the role of mild airflow limitation on K-complex characteristics and EEG activity, these findings may have important implications for respiratory conditions in which airflow limitation during sleep is common (e.g., snoring and OSA).
Citation:
Nguyen CD, Wellman A, Jordan AS, Eckert DJ. Mild airflow limitation during N2 sleep increases k-complex frequency and slows electroencephalographic activity. SLEEP 2016;39(3):541–550.
Keywords: arousal, obstructive sleep apnea, sleep disordered breathing, snoring
Significance.
K-complexes are ubiquitous features of non-REM sleep and may serve seemingly disparate roles (arousal phenomenon vs. sleep promotion) depending on the prevailing conditions. The findings of the current study in which we developed an automated signal-processing tool to detect K-complexes, show that modest reductions in airflow as occur during flow limitation in snoring and mild sleep apnea increase the presence of K-complexes by ∼40%, the amplitude of the largest negative deflection component (N550) and slow EEG activity in people with and without sleep apnea to a similar extent. Whether these changes contribute to next day consequences or are protective requires further investigation.
INTRODUCTION
Restrictions to airflow through the upper airway despite ongoing respiratory effort (airflow limitation) are common components of snoring1,2 and sleep disordered breathing.3 Airflow limitation is also associated with adverse health consequences including impaired left ventricular filling, stroke volume, and cardiac output.4,5 Increased effort to breathe against an obstructed or flow-limited upper airway can trigger cortical electroencephalogram (EEG) arousals, disrupt sleep, and cause daytime sleepiness.2,6–9 Moreover, airflow limitation can reduce deep sleep, even at mild levels insufficient to cause American Academy of Sleep Medicine (AASM)-defined cortical arousals.10
Varying degrees of airflow limitation are also hallmark features of the most common sleep related breathing disorder, obstructive sleep apnea (OSA). OSA is characterized by repetitive narrowing and closure of the upper airway during sleep, resulting in sleep fragmentation and intermittent hypoxemia.11 Untreated OSA is associated with major health consequences including increased risk of cardiovascular mortality, stroke, and heart attack.12–14 However, the precise cause/s of sleepiness due to OSA are incompletely understood and are likely to be multifactorial.
Cortical arousals are often preceded by K-complexes, which are definitive markers of N2 sleep, characterized by an initial brief positive deflection in the EEG signal followed by a slower, larger negative deflection and a final positive peak.15–18 K-complexes are also associated with changes in EEG spectral power of the delta band.15,16,19 Thus, K-complexes may have seemingly paradoxical functional roles. Specifically, a K-complex can reflect an arousal phenomenon,20 a sleep-protective effect,19,21 or a sleep-promoting response to sensory stimuli.22 Whether K-complexes in the absence of AASM-defined cortical arousals are associated with next-day consequences remains unknown. However, although K-complexes were not specifically quantified, an earlier study in which auditory stimuli were delivered during sleep without causing visible cortical arousal (K-complexes elicited in raw examples) did produce daytime sleepiness and impaired mood upon awakening.23
Indeed, ensemble-averaging EEG signals to multiple time-locked stimuli (e.g., auditory tone or respiratory occlusion) during nonrapid eye movement (NREM) sleep produces a characteristic K-complex waveform comprising P200, N350, N550, and P900 components.15,16,24–33 These characteristic components reflect the arrival of the sensory information at the cortex and subsequent sensory processing. The large negative deflection occurring at approximately 550 msec after stimulus onset (N550) is considered to be a key component of the K-complex. N550 is absent or significantly reduced in response to sensory stimuli in which K-complexes cannot be elicited.25,27,30,34,35 The amplitude of the N550 component and elicitation rate of K-complexes are increased after sleep deprivation and in recovering alcoholics to auditory stimuli.36,37 Conversely, N550 amplitude and the frequency of K-complexes in response to brief occlusions to breathing are reduced in adults with mild-moderate OSA patients compared to healthy controls.38,39 Similarly, K-complex elicitation rates and the N350 component to respiratory stimuli is reduced in children with OSA.32,33 These findings are consistent with blunted respiratory sensation and/ or an increased respiratory threshold for arousal in OSA.40
However, it remains unclear whether mild airflow limitation in the absence of AASM-defined cortical arousal affects the elicitation rate of K-complexes, K-complex morphology and timing, and EEG spectral power. Accordingly, the current study aimed to determine the effects of mild airflow limitation on K-complex frequency, K-complex morphology and timing, and EEG spectral power. Secondary aims were to compare K-complex characteristics between patients with OSA versus non-OSA controls and to investigate potential temporal changes in K-complex frequency during a 1-min period of mild flow limitation. Finally, given that airflow limitation from upper airway narrowing is greater during inspiration, we also aimed to determine if the elicitation rate of K-complexes differs between inspiration compared to expiration. We hypothesized that mild airflow limitation would increase K-complex frequency and EEG spectral power of the delta band, and alter K-complex morphology (N550). We also hypothesized that K-complex frequency would be less in patients with OSA versus controls, during expiration versus inspiration, and that potential temporal changes in K-complex frequency during a 1-min period of mild flow limitation would occur with changes in the degree of airflow limitation.
METHODS
Subjects
Data were acquired from a subsample of participants who participated in a larger study investigating the causes of OSA.40 In the current investigation, none of the findings of which have been published previously, data were obtained from 20 patients with OSA patients who had been compliant with continuous positive airway pressure (CPAP) therapy for at least 3 mo and 10 healthy controls matched for age and sex. Half of the patients had OSA of moderate severity with an apnea-hypopnea index (AHI) greater than 15 but less than 30 events per hour of sleep. The remainder had severe OSA (AHI > 30 events per hour of sleep). Other than having OSA, all participants were healthy and were not taking any medications known to affect sleep. The study was approved by the Partners Healthcare Institutional Review Board and participants provided informed written consent to participate.
Measurements and Equipment
Electroencephalograms (EEG), electrooculograms, and surface submentalis electromyograms were used for sleep staging and scoring arousals according to standard criteria.17,41 EEG signals were recorded at C3/A2 and O2/A1 and were sampled at 250 Hz. The C3/A2 channel was used for further processing of the EEG signal.17
A CPAP mask (Gel Mask; Philips Respironics, Murrysville, PA) was attached to a pneumotachograph (model 3700A; Hans Rudolf Inc., Kansas City, MO) and differential pressure transducers (Validyne Corporation, Northbridge, CA) to measure airflow and mask pressure (Pmask). An epiglottic pressure (Pepi) catheter (model MCP-500; Millar, Houston, TX) was placed 1 to 2 cm below the base of tongue. The catheter was taped to the nostril and passed through a port in the CPAP mask.
Protocol
The protocol for this study has been previously reported.40 Briefly, following a standard full night in-laboratory polysomnography (PSG) to quantify the AHI, participants were studied on a separate night in the sleep physiology laboratory in the supine position. Patients with OSA were studied on their prescribed therapeutic CPAP and the control subjects received at least 4 cmH2O. If required, these pressures were increased during sleep to eliminate any sign of inspiratory airflow limitation (defined as a ≥ 1 cmH2O increase in Pepi without any increase in airflow). During stable NREM sleep, transient reductions in CPAP for up to 3 min were applied to induce upper airway collapse and varying degrees of airflow limitation using a modified CPAP device (Philips Respironics).
Data Analysis
Event Selection
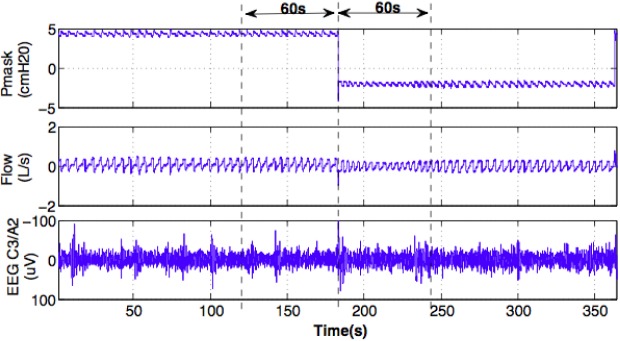
During stable N2 sleep, 1-min windows of EEG (C3/A2), airflow, mask, and epiglottic pressure data before and during the first 1 min of each transient reduction in CPAP were extracted. Only data in these windows that were free of arousals, apneas, and movement artifacts were selected for further processing. Figure 1 shows an example of the segments of data analyzed before and during a CPAP reduction in one individual.
Figure 1.
An example of a reduction in continuous positive airway pressure (CPAP) during N2 sleep. Mask pressure (Pmask), airflow (flow) and electroencephalographic (EEG) signals at C3/A2 channel in 1-min windows (dashed vertical lines) before and during the CPAP reduction were extracted for further processing.
K-complex Detection and Component Definitions
K-complexes are typically visually identified as a large amplitude waveform with a negative deflection immediately followed by a positive component lasting > 0.5 sec.17 In this study, K-complexes were automatically detected using a custom-designed signal-processing module (see Figure 2 and Table 1) that we developed in MATLAB (version 8, The MathWorks, Natick, MA, USA). The K-complex detection involved:
Identification of a large negative amplitude deflection followed by a positive component on the EEG. Peak-to-peak voltage criteria for K-complexes vary between studies.15,16 Thus, in this study we examined three peak-to-peak amplitude thresholds (ε) of 50, 75, and 100 (μV). Only K-complexes with peak-to-peak amplitude greater than ε were selected.
The mean EEG amplitude in each 1-min segment used for analysis was calculated to establish the baseline EEG. This was used to calculate the timing and various components of each K-complex. Specific timing and baseline crossing criteria are defined in Table 1. Only K-complexes lasting greater than 0.5 sec were extracted for analysis.17
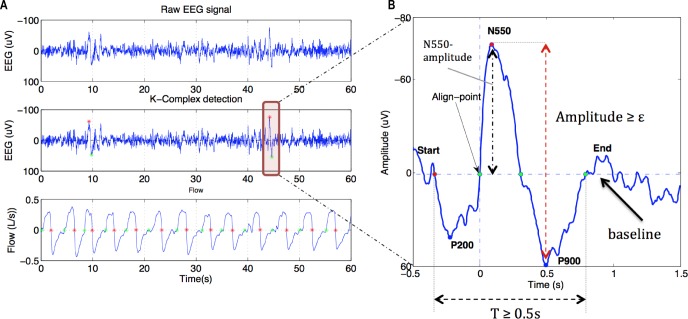
Figure 2 shows an example of a detected K-complex and the key components used in its detection. The detected K-complexes were then visually verified for quality control. The number of K-complexes during the 60 sec on therapeutic CPAP was compared to the adjacent flow-limited 60-sec periods using these tools. Each 60-sec period was also divided into three nonoverlapping 20-sec segments to assess the distribution of K-complexes throughout each 60-sec period and compared between conditions.
Figure 2.
Detection of K-complexes and their properties. (A) K-complexes were detected according to a peak-to-peak amplitude threshold (ε) as shown by the red and green stars on the electroencephalography (EEG) channel. Green stars on the flow signal reflect the automatic detection of the onset of inspiration and red stars reflect the start of expiration. (B) K-complex component detection. Baseline was calculated as the mean of EEG amplitude during the 1-min window on continuous positive airway pressure (horizontal dashed line). The point at which K-complexes were aligned for ensemble averaging is highlighted (align point) as are the start (red dot) and end points (last green dot). P200 is the minima of the EEG waveform between the start point and the align point. N550 and P900 are maxima (black vertical dashed arrow) and minima of the detected K-complex. Only K-complexes that lasted ≥ 0.5 s *(T) and where the peak-to-peak amplitude was ≥ ε (red vertical dashed arrow) were selected for analysis. ε was set to 50, 75, and 100 μV, respectively.
Table 1.
Definition of K-complex components.

Ensemble-Averaged K-complex Waveforms
To characterize K-complex morphology, each individual K-complex was aligned (time zero, Figure 2) and averaged to generate a grand mean K-complex waveform for each participant during each condition (nonflow-limited and flow-limited breathing). Amplitude and latency of each K-complex component (P200, N550, and P900) were then defined (Figure 2). The amplitude of each K-complex component was calculated with respect to the preceding baseline period (Figure 2). Data for ε = 50 μV are reported throughout the manuscript unless stated otherwise.
Respiratory Parameters and Distribution of K-complexes
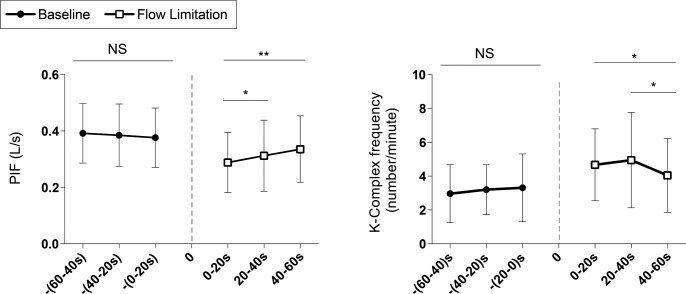
Breath timing (inspiration and expiration), peak inspiratory flow (PIF), minute ventilation (V̇E), Pmask, and Pepi were calculated using custom-designed automated tools (see supplemental material for details). The distribution of K-complexes commencing during inspiration versus those occurring during expiration and respiratory parameters were then compared between conditions. Each 60-sec period on CPAP and during airflow limitation was also separated into three 20-sec bins to investigate potential changes in K-complex frequency and PIF over time.
EEG Power Spectral Analysis
Spectral analysis was performed on the EEG signal at C3/A2 in 1-min windows before and during each 1 min CPAP reduction. Fast Fourier transform (FFT) of nonoverlapping 5-sec segments with a Hamming weighting window was used to calculate the power spectra of the EEG. Frequency bands were defined as delta (0.5–4 Hz), theta (4–8 Hz), alpha (8–12 Hz), beta (12–32 Hz), and gamma (32–60 Hz). Spectral power was expressed as absolute power (μV2). Spectral analysis was performed using standard subroutines of MATLAB (version 8, MathWorks).
Statistical Analysis
Statistical analyses were performed using GraphPad Prism (version 6.0f for Mac OSX, GraphPad Software, La Jolla, CA, USA). The number of K-complexes in each condition (nonflow-limited versus flow-limited breathing) and respiratory parameters were compared using paired Student t-tests. Paired Student t-tests were also used to compare power spectral density in different frequency bands of the EEG signal during baseline versus the flow-limited condition.
One-way analysis of variance (ANOVA) was applied to assess potential differences in participant characteristics (age, body mass index, AHI, number of selected CPAP drops) between healthy controls and groups with moderate and severe OSA and to compare the number of K-complexes and PIF in the three nonoverlapping 20-sec segments during the baseline and CPAP reduction conditions. Two-way ANOVA was applied to examine potential differences in K-complex frequency and EEG spectral power between groups (controls, patients with moderate and severe OSA) and conditions (before and during CPAP reductions). Results are presented as mean ± standard deviation. A value of P < 0.05 was considered statistically significant.
RESULTS
Artifact-free data were analyzed from a total of 171 CPAP drops in the 30 participants studied. Patients and controls were well-matched for age and sex. There were no significant differences in the number of CPAP reductions analyzed between groups. Body mass index and AHI were higher in the OSA patients compared to the healthy controls. Objective CPAP compliance was high in the OSA patients (Table 2).
Table 2.
Participant characteristics.

Stimulus Characteristics
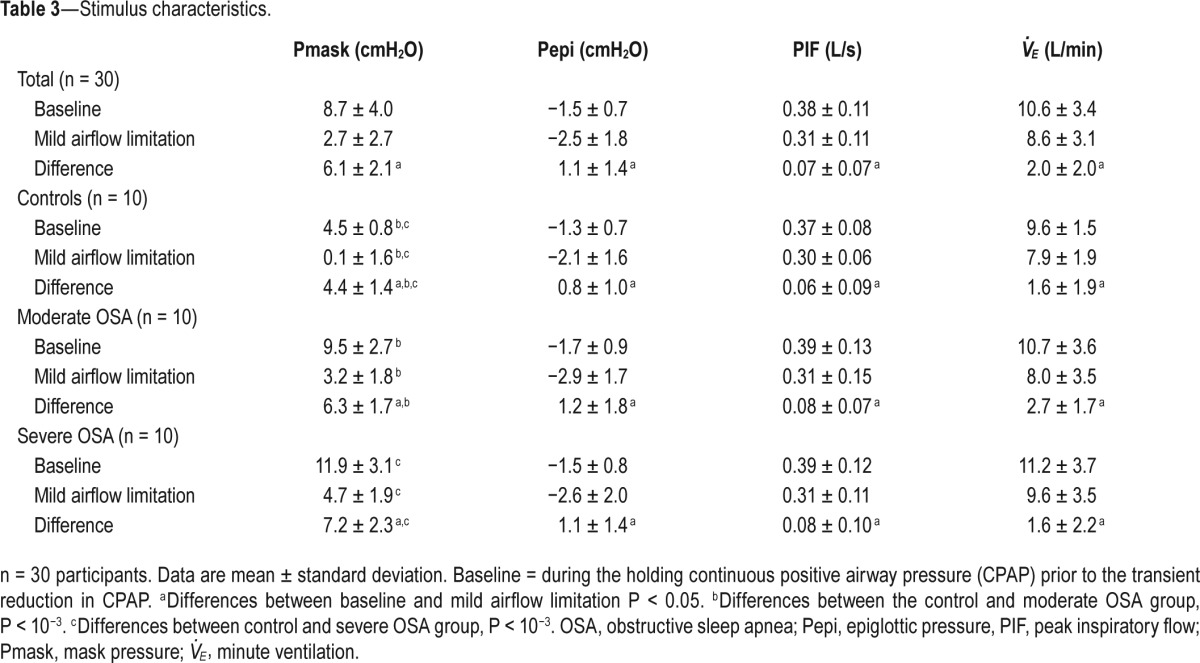
By design, there was a significant reduction in Pmask during CPAP reductions, resulting in a modest 18% reduction in PIF from the therapeutic CPAP level. Pepi and V̇E in the 1-min windows during CPAP reductions were also modestly reduced compared to baseline period immediately preceding each drop (Table 3). Reductions in PIF between healthy controls and the groups with moderate and severe OSA were not different (P > 0.8). CPAP holding pressures and the change in CPAP required to produce mild airflow limitation were higher in the OSA patients compared to controls (Table 3).
Table 3.
Stimulus characteristics.
K-complex Frequency and EEG Power during Mild Airflow Limitation
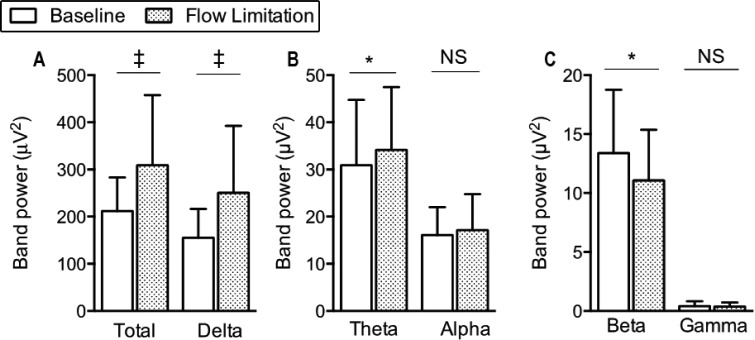
K-complex elicitation rates during CPAP reductions increased by more than 40% compared to the preceding period, regardless of the threshold (ε) used for K-complex detection (Figure 3). The total power of the EEG signal significantly increased during the CPAP reductions compared to the nonflow-limited period on CPAP (Figure 4A). The power of delta and theta bands significantly increased (Figures 4A and 4B) whereas the power of beta bands significantly decreased (Figure 4C) during the flow-limited periods compared to baseline. There were no significant differences in the power of the alpha or gamma bands between conditions.
Figure 3.
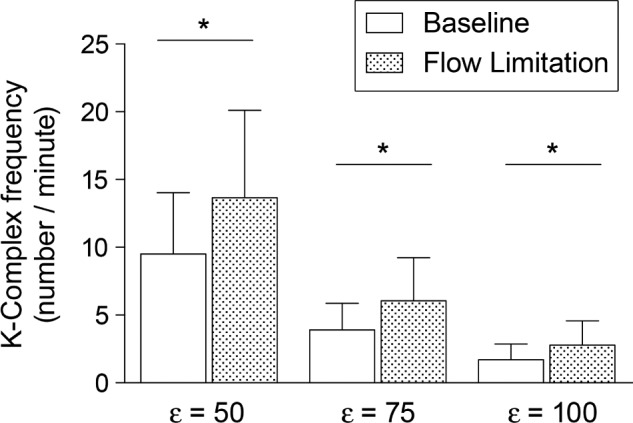
K-complex frequency (number/minute) at baseline and during mild airflow limitation, with different detection thresholds ε = 50, 75, and 100 μV. Data are mean and standard deviation. *P < 10−3.
Figure 4.
Power spectral density of the electroencephalography signal at C3/A2 at baseline and during flow-limitation. *P < 0.01 and ‡P < 10−4. NS, not significant.
K-complex Components during Mild Airflow Limitation
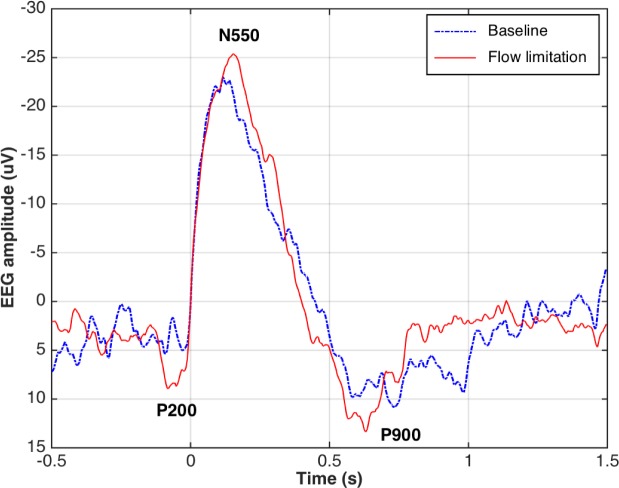
N550 amplitude increased during the flow-limited condition versus baseline (Table 4). There were no other differences K-complex morphology or timing for the other waveform components before versus during CPAP reductions (Table 4). Figure 5 shows an example of changes in grand mean K-complex waveforms from a representative participant during the flow-limited periods compared to baseline.
Table 4.
Amplitude and latency of K-complex components.
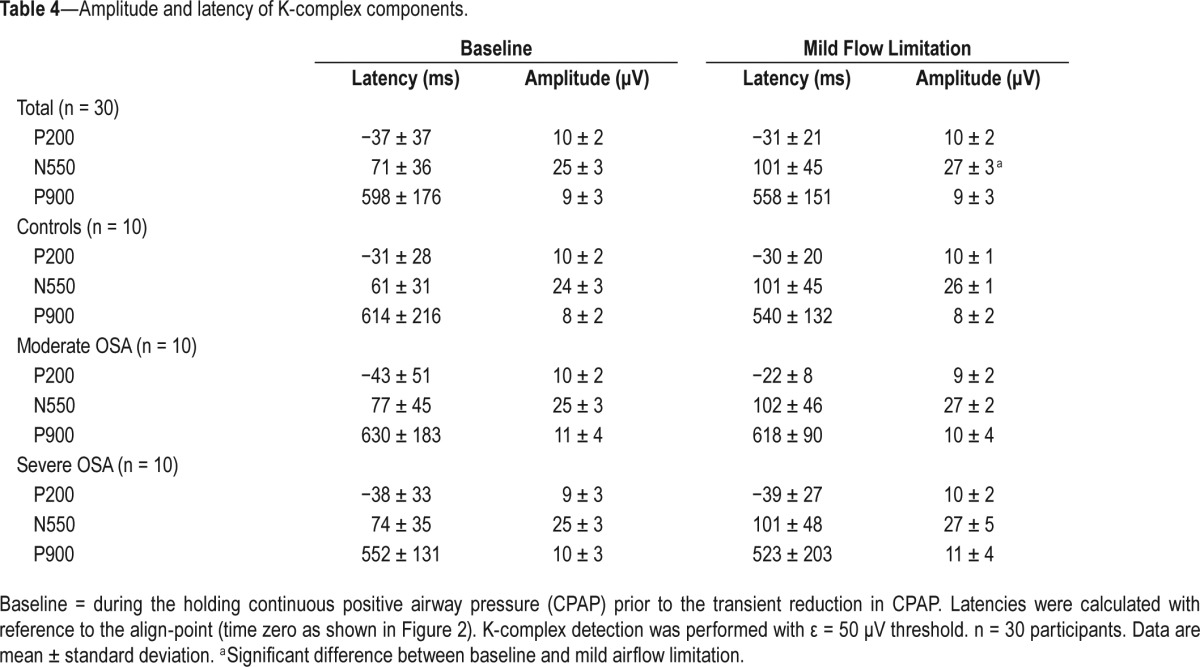
Figure 5.
Grand mean K-complex waveforms (threshold ε = 50 μV) from a representative participant during the baseline period on continuous positive airway pressure (CPAP, blue line) and during the mild airflow limitation period (red line). EEG, electroencephalography.
The Effect of Respiratory Phase on K-complex Elicitation
K-complexes were randomly distributed throughout the respiratory cycle. The number of K-complexes during inspiration and expiration were similar (∼50% ± 10%), regardless of the threshold (ε) for K-complex detection used (P > 0.1). Indeed, there was no significant difference in the number of K-complexes during inspiration (%) between 1-min windows before verses during the CPAP reductions (53 ± 8 versus 51 ± 13, P = 0.48; 52 ± 16 versus 46 ± 15, P = 0.11; and 54 ± 18 versus 42 ± 20, P = 0.06 for ε = 50, 75, and 100 μV, respectively).
Distribution of K-complexes during Mild Airflow Limitation
PIF and K-complex frequency were stable during the 1-min period on CPAP when separated into three 20-sec segments, P > 0.8 (Figure 6). Conversely, PIF significantly increased over time during the 1-min windows of mild airflow limitation (Figure 6A) and K-complex frequency decreased during the last 20 sec following the reduction in CPAP in conjunction with the increase in PIF (Figure 6B).
Figure 6.
(A) Changes in peak inspiratory flow (PIF) and (B) the distribution of K-complexes (threshold ε = 50 μV) during baseline and mild airflow limitation. *P < 0.05 and **P < 0.01. Dashed line represents the onset of airflow limitation. NS, not significant.
OSA Versus Controls
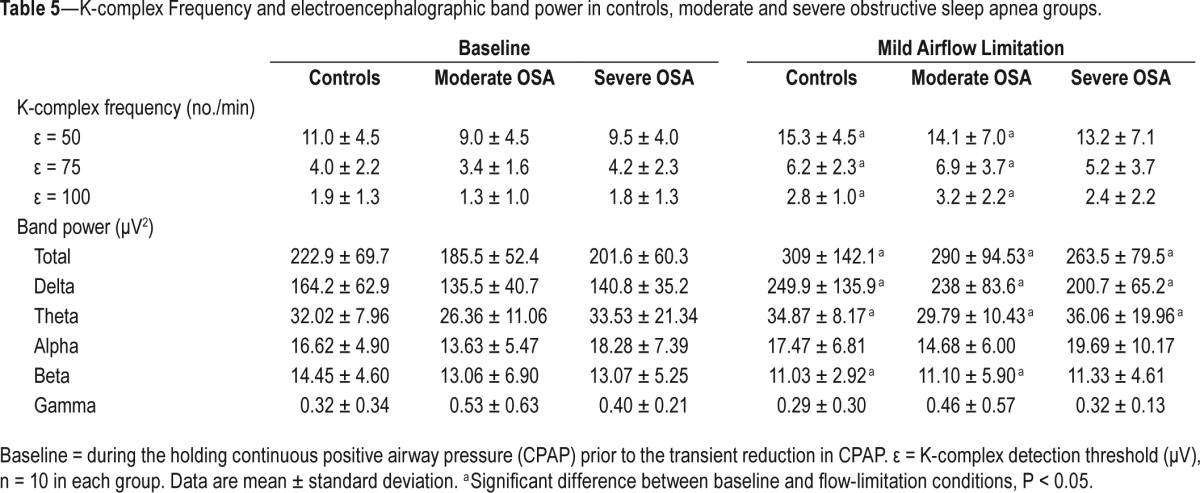
Table 5 shows that K-complex frequency (regardless of the threshold (ε) for K-complex detection used) and spectral power (total, delta, and theta bands) significantly increased in the healthy controls and patients with moderately severe OSA during airflow limitation compared to baseline, P < 0.05. A similar pattern was observed in the patients with severe OSA. Conversely, the spectral power of beta band was significantly reduced in the healthy controls and patients with moderately severe OSA. Spectral power of alpha and gamma bands did not change between conditions in controls or patient groups. There were no significant differences in K-complex morphology or timing and EEG power of all bands between healthy controls and patient groups with moderate and severe OSA, during baseline or airflow limitation conditions (Tables 4 and 5), P > 0.5.
Table 5.
K-complex Frequency and electroencephalographic band power in controls, moderate and severe obstructive sleep apnea groups.
DISCUSSION
The main finding of this study is that mild airflow limitation (insufficient to cause AASM-defined cortical arousal) is associated with an approximately 40% increase in K-complex frequency, suggesting that it may affect sleep quality, as described in the following paragraphs. In addition, we also found that: (1) EEG spectral power (total, delta, and theta bands) increase while power of the beta band decreases, (2) the amplitude of averaged K-complex waveform at N550 increases, (3) K-complexes are equally distributed during inspiration and expiration, and (4) these changes occur to a similar extent regardless of the presence or absence of OSA or its severity.
Increased K-complex Frequency and EEG Power during Mild Airflow Limitation and Potential Implications
K-complexes are generated by synchronous cortical activity and can occur spontaneously or in response to sensory stimuli.15,42–44 Increased K-complex frequency occurs in disorders associated with sleep fragmentation and increased arousals, such as insomnia,45 restless legs syndrome,46 and after a night of sleep fragmentation in healthy individuals.47 It remains unclear whether increased K-complex frequency in response to mild airflow limitation leads to daytime consequences. However, Martin and colleagues showed that 1 night of induced sleep fragmentation by auditory stimuli, with non-visible cortical arousals (raw examples show the presence of elicited K-complexes) leads to daytime sleepiness and impaired mood upon awakening.23 Thus, increased K-complex frequency may be a marker of arousal and sleep disruption.21
Alternatively, increased K-complexes may reflect a sleep protective or a sleep promotion response. For example, it has been shown that if sensory stimuli fails to elicit K-complexes, then more pronounced cortical arousals and sleep fragmentation occur,21 leading to increased next-day impairment when compared to the presence of K-complexes alone. This concept is supported by the hierarchical heart rate changes that occur when a K-complex is elicited compared to a larger cortical arousal48 and between cortical arousals of different intensities.49 Consistent with the EEG power spectrum changes observed in the current study, Martin and colleagues also saw an increase in EEG power in response to auditory tones that did not cause visible cortical arousals.23 Indeed, K-complexes are associated with a slowing of cortical activity and increased delta EEG activity during NREM sleep.15,16,19,42,47
Consistent with a sleep promotion role, delta EEG power increases immediately following a K-complex in N2 sleep.45 Black and colleagues characterized EEG spectral power associated with increased breathing effort during abrupt increase in negative esophageal pressure in 15 patients with upper airway resistance syndrome.50 Similar to the EEG changes seen in the current study, increased delta power was observed before and surrounding the periods of upper airway resistance, regardless of the presence or absence of AASM-defined arousals.50 Increased delta and theta power as shown during the flow limitation condition in the current study has also been observed in subjects with severe OSA compared to controls.51 Flow limitation that occurs during sleep disordered breathing causes hypercapnia. Recent studies suggest that hypercapnia may be a cause of EEG slowing.52,53 Furthermore, increased delta activity is associated with daytime sleepiness in patients with sleep disordered breathing, and treating the sleep disorder reduces daytime sleepiness and delta EEG power.52,54 Although slow wave sleep has many restorative properties,55,56 these findings suggest that increased K-complex frequency and increased EEG delta power in the context of sleep disordered breathing, may be associated with increased daytime sleepiness.
K-complex Morphology during Mild Airflow Limitation
Our finding of increased amplitude of the N550 component during airflow limitation compared to baseline is consistent with a prior study in insomnia patients during sleep onset.57 However, it differs from a subsequent study during stable N2 sleep that did not show differences in N550 in either evoked or spontaneous K-complexes between insomnia patients and controls.45 Increased N550 amplitude during flow limitation is consistent with increased sensory input and cortical processing as observed in response to other sensory modulates.30,58
Distribution of K-complexes
Contrary to our hypothesis, we did not find any evidence that K-complexes occur more frequently during inspiration compared to expiration during mild airflow limitation. This finding indicates that flow limitation during airway narrowing increases respiratory sensory activation to a similar extent during both inspiration and expiration. However, consistent with the magnitude of flow limitation being an important meditator rather than the initial transient reduction in CPAP per se, as peak inspiratory flow increased toward the end of the 1-mine reduction in CPAP due to increased upper airway dilator muscle activity,40 the elicitation rate of K-complexes also decreased.
The current study was limited to examination of the effects of mild flow limitation over a 1-min period to avoid potential confounders such as cortical arousals that often occur with severe flow limitation and apnea. Thus, examination of dose-response characteristics of K-complex elicitation rates at varying degrees of flow limitation will be of interest in future carefully designed studies.
Effects of OSA
Our findings of no differences in K-complex frequency, K-complex morphology and timing, or EEG power in patients with OSA are in contrast to prior studies that found a reduction in K-complex frequency38,39,59 and the amplitude of N550 component to respiratory stumuli38,39 in adult patients with mild-moderate OSA compared to healthy controls. Several methodological differences likely explain the apparent discrepancies between the current findings and those of the prior investigations. Importantly, unlike the prior studies, the patients with OSA in the current study had been on CPAP for at least 3 mo and were highly compliant with therapy. Treating OSA can improve respiratory sensory processing45 and reduce delta EEG power.52,54 Thus, it will be important for future studies to investigate the effects of flow limitation on the parameters measured in the current study in OSA patients prior to treatment. Second, two of the prior studies elicited K-complexes using brief inspiratory occlusions rather than prolonged, mild increases in flow limitation via transient reductions in CPAP as used in the current investigation. Accurate time alignment of EEG in relation to respiratory stimuli is a crucial determinate of respiratory-related evoked potentials (RREP) waveform amplitude. Although K-complexes were aligned accurately to one another in the current study, they were not aligned to transient respiratory stimuli per se. The stimulus magnitude was also less than prior RREP studies in OSA. Thus, these factors may have also contributed to the differences in the findings between studies and the lower absolute amplitude of the N550 component in the current study. Nonetheless, the current findings clearly show that mild flow limitation increases K-complex frequency and slows EEG power to a similar extent in healthy individuals and CPAP-treated patients with OSA.
Development of K-complex Detection Tool
Another novel aspect of the current study was the development of a reliable tool to detect K-complexes. Visual detection of K-complexes is very time consuming (typically 1 to 3 K-complexes per minute in N2 sleep)60 with poor interscorer agreement of only approximately 50%.61 Accordingly, several techniques have been proposed to automatically detect K-complexes.61–66 The current tool is simple, semiautomated, and provides an alternative approach to accurately detect K-complexes to facilitate future research investigations into the role of K-complexes in sleep and their consequences.
Summary
Mild airflow limitation increases K-complex frequency by approximately 40%. Consistent with a transient increase in cortical processing of respiratory stimuli, the amplitude of the N550 component of averaged K-complexes increases during mild airflow limitation. Finally, consistent with an overall slowing of EEG activity, EEG spectral power of the delta and theta bands increases during sustained (1 min) airflow limitation. These changes in cortical activity in response to only mild levels of airflow limitation may have important implications for respiratory conditions in which airflow limitation during sleep is common (e.g., snoring and OSA).
DISCLOSURE STATEMENT
This was not an industry supported study. The study was supported by the NIH (5R01HL048531). Dr. Wellman has received research support from Philips Respironics. Dr. Nguyen received support from a National Health and Medical Research Council (NHMRC) of Australia NeuroSleep Centre of Research Excellence Fellowship (1060992). Dr. Eckert has received support from a NHMRC RD Wright Fellowship (1049814). The Harvard Catalyst is funded by UL1 RR 025758-01. Dr. Jordan has indicated no financial conflicts of interest. Data collection for this study was performed at Brigham and Women's Hospital and Harvard Medical School, Boston, MA, USA. Analysis was performed at Neuroscience Research Australia (NeuRA), Randwick, New South Wales, Australia.
ACKNOWLEDGMENTS
The authors are grateful for the technical support provided by the Brigham and Women's Sleep Disorders Research Program staff.
REFERENCES
- 1.Lugaresi E, Mondini S, Zucconi M, Montagna P, Cirignotta F. Staging of heavy snorers' disease. A proposal. Bull Eur Physiopathol Respir. 1983;19:590–4. [PubMed] [Google Scholar]
- 2.Guilleminault C, Stoohs R, Clerk A, Cetel M, Maistros P. A cause of excessive daytime sleepiness. The upper airway resistance syndrome. Chest. 1993;104:781–7. doi: 10.1378/chest.104.3.781. [DOI] [PubMed] [Google Scholar]
- 3.Bourjeily G, Fung JY, Sharkey KM, et al. Airflow limitations in pregnant women suspected of sleep-disordered breathing. Sleep Med. 2014;15:550–5. doi: 10.1016/j.sleep.2014.01.004. [DOI] [PubMed] [Google Scholar]
- 4.Barr RG, Bluemke DA, Ahmed FS, et al. Percent emphysema, airflow obstruction, and impaired left ventricular filling. N Engl J Med. 2010;362:217–27. doi: 10.1056/NEJMoa0808836. [DOI] [PMC free article] [PubMed] [Google Scholar]
- 5.Garpestad E, Parker JA, Katayama H, et al. Decrease in ventricular stroke volume at apnea termination is independent of oxygen desaturation. J Appl Physiol. 1994;77:1602–8. doi: 10.1152/jappl.1994.77.4.1602. [DOI] [PubMed] [Google Scholar]
- 6.Berry RB, Gleeson K. Respiratory arousal from sleep: mechanisms and significance. Sleep. 1997;20:654–75. doi: 10.1093/sleep/20.8.654. [DOI] [PubMed] [Google Scholar]
- 7.Berry RB, Light RW. Effect of hyperoxia on the arousal response to airway occlusion during sleep in normal subjects. Am Rev Respir Dis. 1992;146:330–4. doi: 10.1164/ajrccm/146.2.330. [DOI] [PubMed] [Google Scholar]
- 8.Philip P, Stoohs R, Guilleminault C. Sleep fragmentation in normals: a model for sleepiness associated with upper airway resistance syndrome. Sleep. 1994;17:242–7. [PubMed] [Google Scholar]
- 9.Rees K, Kingshott RN, Wraith PK, Douglas NJ. Frequency and significance of increased upper airway resistance during sleep. Am J Respir Crit Care Med. 2000;162:1210–4. doi: 10.1164/ajrccm.162.4.9908052. [DOI] [PubMed] [Google Scholar]
- 10.Montserrat JM, Ballester E, Olivi H, et al. Time-course of stepwise CPAP titration. Behavior of respiratory and neurological variables. Am J Respir Crit Care Med. 1995;152:1854–9. doi: 10.1164/ajrccm.152.6.8520746. [DOI] [PubMed] [Google Scholar]
- 11.Young T, Palta M, Dempsey J, Skatrud J, Weber S, Badr S. The occurrence of sleep-disordered breathing among middle-aged adults. N Engl J Med. 1993;328:1230–5. doi: 10.1056/NEJM199304293281704. [DOI] [PubMed] [Google Scholar]
- 12.Young T, Finn L, Peppard PE, et al. Sleep disordered breathing and mortality: eighteen-year follow-up of the Wisconsin Sleep Cohort. Sleep. 2008;31:1071–8. [PMC free article] [PubMed] [Google Scholar]
- 13.Yaggi HK, Concato J, Kernan WN, Lichtman JH, Brass LM, Mohsenin V. Obstructive sleep apnea as a risk factor for stroke and death. N Engl J Med. 2005;353:2034–41. doi: 10.1056/NEJMoa043104. [DOI] [PubMed] [Google Scholar]
- 14.Gottlieb DJ, Yenokyan G, Newman AB, et al. Prospective study of obstructive sleep apnea and incident coronary heart disease and heart failure The Sleep Heart Health Study. Circulation. 2010;122:352–60. doi: 10.1161/CIRCULATIONAHA.109.901801. [DOI] [PMC free article] [PubMed] [Google Scholar]
- 15.Colrain IM. The K-complex: a 7-decade history. Sleep. 2005;28:255–73. doi: 10.1093/sleep/28.2.255. [DOI] [PubMed] [Google Scholar]
- 16.Halasz P. K-complex, a reactive EEG graphoelement of NREM sleep: an old chap in a new garment. Sleep Med Rev. 2005;9:391–412. doi: 10.1016/j.smrv.2005.04.003. [DOI] [PubMed] [Google Scholar]
- 17.Rechtschaffen A, Kales A. A manual of standardized terminology, techniques and scoring system for sleep stages of human subjects: US Government Printing Office, US Public Health Service. 1968 [Google Scholar]
- 18.Terzano MG, Parrino L, Rosa A, Palomba V, Smerieri A. CAP and arousals in the structural development of sleep: an integrative perspective. Sleep Med. 2002;3:221–9. doi: 10.1016/s1389-9457(02)00009-6. [DOI] [PubMed] [Google Scholar]
- 19.De Gennaro L, Ferrara M, Bertini M. The spontaneous K-complex during stage 2 sleep: is it the ‘forerunner’ of delta waves? Neurosci Lett. 2000;291:41–3. doi: 10.1016/s0304-3940(00)01366-5. [DOI] [PubMed] [Google Scholar]
- 20.Roth M, Shaw J, Green J. The form voltage distribution and physiological significance of the K-complex. Electroencephalogr Clin Neurophysiol. 1956;8:385–402. doi: 10.1016/0013-4694(56)90004-9. [DOI] [PubMed] [Google Scholar]
- 21.Bastien CH, Ladouceur C, Campbell KB. EEG characteristics prior to and following the evoked K-Complex. Can J Exper Psychol. 2000;54:255–65. doi: 10.1037/h0087345. [DOI] [PubMed] [Google Scholar]
- 22.Halasz P, Pal I, Rajna P. K-complex formation of the EEG in sleep. A survey and new examinations. Acta Physiol Hung. 1985;65:3–35. [PubMed] [Google Scholar]
- 23.Martin SE, Wraith PK, Deary IJ, Douglas NJ. The effect of nonvisible sleep fragmentation on daytime function. Am J Respir Crit Care Med. 1997;155:1596–601. doi: 10.1164/ajrccm.155.5.9154863. [DOI] [PubMed] [Google Scholar]
- 24.Ujszaszi J, Halasz P. Long latency evoked potential components in human slow wave sleep. Electroencephalogr. Clin Neurophysiol. 1988;69:516–22. doi: 10.1016/0013-4694(88)90163-0. [DOI] [PubMed] [Google Scholar]
- 25.Campbell K, Rouillard L, Bastien C. Component structure of the evoked K-complex. In: Horne J, editor. Sleep. Vol. 90. Bochum, Germany: Pontenagel Press; 1990. pp. 17–9. [Google Scholar]
- 26.Gora J, Colrain IM, Trinder J. The investigation of K-complex and vertex sharp wave activity in response to mid-inspiratory occlusions and complete obstructions to breathing during NREM sleep. Sleep. 2001;24:81–9. doi: 10.1093/sleep/24.1.81. [DOI] [PubMed] [Google Scholar]
- 27.Bastien CH, Crowley KE, Colrain IM. Evoked potential components unique to non-REM sleep: relationship to evoked K-complexes and vertex sharp waves. Int J Psychophysiol. 2002;46:257–74. doi: 10.1016/s0167-8760(02)00117-4. [DOI] [PubMed] [Google Scholar]
- 28.Crowley KE, Colrain IM. A review of the evidence for P2 being an independent component process: age, sleep and modality. Clin Neurophysiol. 2004;115:732–44. doi: 10.1016/j.clinph.2003.11.021. [DOI] [PubMed] [Google Scholar]
- 29.Colrain IM, Webster KE, Hirst G, Campbell KB. The roles of vertex sharp waves and K-complexes in the generation of N300 in auditory and respiratory-related evoked potentials during early stage 2 NREM sleep. Sleep. 2000;23:97–106. [PubMed] [Google Scholar]
- 30.Colrain IM, Webster KE, Hirst G. The N550 component of the evoked K-complex: a modality non-specific response? J. Sleep Res. 1999;8:273–80. doi: 10.1046/j.1365-2869.1999.00163.x. [DOI] [PubMed] [Google Scholar]
- 31.Webster KE, Colrain IM. Multichannel EEG analysis of respiratory evoked-potential components during wakefulness and NREM sleep. J Appl Physiol. 1998;85:1727–35. doi: 10.1152/jappl.1998.85.5.1727. [DOI] [PubMed] [Google Scholar]
- 32.Huang J, Colrain IM, Melendres MC, et al. Cortical processing of respiratory afferent stimuli during sleep in children with the obstructive sleep apnea syndrome. Sleep. 2008;31:403–10. doi: 10.1093/sleep/31.3.403. [DOI] [PMC free article] [PubMed] [Google Scholar]
- 33.Huang J, Marcus CL, Davenport PW, Colrain IM, Gallagher PR, Tapia IE. Respiratory and auditory cortical processing in children with obstructive sleep apnea syndrome. Am J Respir Crit Care Med. 2013;188:852–7. doi: 10.1164/rccm.201307-1257OC. [DOI] [PMC free article] [PubMed] [Google Scholar]
- 34.Bastien C, Campbell K. The evoked K-complex: all-or-none phenomenon? Sleep. 1992;15:236–45. doi: 10.1093/sleep/15.3.236. [DOI] [PubMed] [Google Scholar]
- 35.Niiyama Y, Fushimi M, Sekine A, Hishikawa Y. K-complex evoked in NREM sleep is accompanied by a slow negative potential related to cognitive process. Electroencephalogr Clin Neurophysiol. 1995;95:27–33. doi: 10.1016/0013-4694(95)00021-p. [DOI] [PubMed] [Google Scholar]
- 36.Peszka J, Harsh J. Effect of sleep deprivation on NREM sleep ERPs and related activity at sleep onset. Int J Psychophysiol. 2002;46:275–86. doi: 10.1016/s0167-8760(02)00115-0. [DOI] [PubMed] [Google Scholar]
- 37.Colrain IM, Crowley KE, Nicholas CL, Padilla M, Baker FC. The impact of alcoholism on sleep evoked delta frequency responses. Biol Psychiatry. 2009;66:177–84. doi: 10.1016/j.biopsych.2008.10.010. [DOI] [PMC free article] [PubMed] [Google Scholar]
- 38.Gora J, Trinder J, Pierce R, Colrain IM. Evidence of a sleep-specific blunted cortical response to inspiratory occlusions in mild obstructive sleep apnea syndrome. Am J Respir Crit Care Med. 2002;166:1225–34. doi: 10.1164/rccm.2106005. [DOI] [PubMed] [Google Scholar]
- 39.Afifi L, Guilleminault C, Colrain IM. Sleep and respiratory stimulus specific dampening of cortical responsiveness in OSAS. Respir Physiol Neurobiol. 2003;136:221–34. doi: 10.1016/s1569-9048(03)00084-3. [DOI] [PubMed] [Google Scholar]
- 40.Eckert DJ, White DP, Jordan AS, Malhotra A, Wellman A. Defining phenotypic causes of obstructive sleep apnea identification of novel therapeutic targets. Am J Respir Crit Care Med. 2013;188:996–1004. doi: 10.1164/rccm.201303-0448OC. [DOI] [PMC free article] [PubMed] [Google Scholar]
- 41.ASDA. EEG arousals: scoring rules and examples: a preliminary report from the Sleep Disorders Atlas Task Force of the American Sleep Disorders Association. Sleep. 1992;15:173–84. [PubMed] [Google Scholar]
- 42.Amzica F, Steriade M. The K-complex: its slow (< 1-Hz) rhythmicity and relation to delta waves. Neurology. 1997;49:952–9. doi: 10.1212/wnl.49.4.952. [DOI] [PubMed] [Google Scholar]
- 43.Steriade M, Nunez A, Amzica F. A novel slow (< 1 Hz) oscillation of neocortical neurons in vivo: depolarizing and hyperpolarizing components. J Neurosci. 1993;13:3252–65. doi: 10.1523/JNEUROSCI.13-08-03252.1993. [DOI] [PMC free article] [PubMed] [Google Scholar]
- 44.Wennberg R. Intracranial cortical localization of the human K-complex. Clin Neurophysiol. 2010;121:1176–86. doi: 10.1016/j.clinph.2009.12.039. [DOI] [PubMed] [Google Scholar]
- 45.Tapia IE, McDonough JM, Huang J, et al. Respiratory cortical processing to inspiratory resistances during wakefulness in children with the obstructive sleep apnea syndrome. J Appl Physiol. 2015;118:400–7. doi: 10.1152/japplphysiol.00582.2014. [DOI] [PMC free article] [PubMed] [Google Scholar]
- 46.Montplaisir J, Boucher S, Gosselin A, Poirier G, Lavigne G. Persistence of repetitive EEG arousals (K-alpha complexes) in RLS patients treated with L-DOPA. Sleep. 1996;19:196–9. doi: 10.1093/sleep/19.3.196. [DOI] [PubMed] [Google Scholar]
- 47.Nicholas CL, Trinder J, Colrain IM. Increased production of evoked and spontaneous K-complexes following a night of fragmented sleep. Sleep. 2002;25:882–7. [PubMed] [Google Scholar]
- 48.Sforza E, Jouny C, Ibanez V. Cardiac activation during arousal in humans: further evidence for hierarchy in the arousal response. Clin Neurophysiol. 2000;111:1611–9. doi: 10.1016/s1388-2457(00)00363-1. [DOI] [PubMed] [Google Scholar]
- 49.Azarbarzin A, Ostrowski M, Hanly P, Younes M. Relationship between arousal intensity and heart rate response to arousal. Sleep. 2014;37:645–53. doi: 10.5665/sleep.3560. [DOI] [PMC free article] [PubMed] [Google Scholar]
- 50.Black JE, Guilleminault C, Colrain IM, Carrillo O. Upper airway resistance syndrome. Central electroencephalographic power and changes in breathing effort. Am J Respir Crit Care Med. 2000;162:406–11. doi: 10.1164/ajrccm.162.2.9901026. [DOI] [PubMed] [Google Scholar]
- 51.Xiromeritis AG, Hatziefthimiou AA, Hadjigeorgiou GM, Gourgoulianis KI, Anagnostopoulou DN, Angelopoulos NV. Quantitative spectral analysis of vigilance EEG in patients with obstructive sleep apnoea syndrome. Sleep Breath. 2011;15:121–8. doi: 10.1007/s11325-010-0335-6. [DOI] [PubMed] [Google Scholar]
- 52.Wang D, Piper AJ, Yee BJ, et al. Hypercapnia is a key correlate of EEG activation and daytime sleepiness in hypercapnic sleep disordered breathing patients. J Clin Sleep Med. 2014;10:517–22. doi: 10.5664/jcsm.3700. [DOI] [PMC free article] [PubMed] [Google Scholar]
- 53.Wang D, Yee BJ, Wong KK, et al. Comparing the effect of hypercapnia and hypoxia on the electroencephalogram during wakefulness. Clin Neurophysiol. 2015;126:103–9. doi: 10.1016/j.clinph.2014.04.012. [DOI] [PubMed] [Google Scholar]
- 54.Lee SD, Ju G, Kim JW, Yoon IY. Improvement of EEG slowing in OSAS after CPAP treatment. J Psychosom Res. 2012;73:126–31. doi: 10.1016/j.jpsychores.2012.04.007. [DOI] [PubMed] [Google Scholar]
- 55.Walsh JK. Enhancement of slow wave sleep: implications for insomnia. J Clin Sleep Med. 2009;5:S27–32. [PMC free article] [PubMed] [Google Scholar]
- 56.Walsh JK, Snyder E, Hall J, et al. Slow wave sleep enhancement with gaboxadol reduces daytime sleepiness during sleep restriction. Sleep. 2008;31:659–72. doi: 10.1093/sleep/31.5.659. [DOI] [PMC free article] [PubMed] [Google Scholar]
- 57.Loewy DH, Burdick RS, Al-Shajlawi A, Franzen P, R, B Enhanced information processing at the peri-sleep onset period in insomniacs as measured by event-related potentials. Sleep. 1999;22:S152–3. [Google Scholar]
- 58.Atienza M, Cantero JL, Escera C. Auditory information processing during human sleep as revealed by event-related brain potentials. Clin Neurophysiol. 2001;112:2031–45. doi: 10.1016/s1388-2457(01)00650-2. [DOI] [PubMed] [Google Scholar]
- 59.Wauquier A, Aloe L, Declerck A. K-complexes: are they signs of arousal or sleep protective? J Sleep Res. 1995;4:138–43. doi: 10.1111/j.1365-2869.1995.tb00162.x. [DOI] [PubMed] [Google Scholar]
- 60.Kryger MH, Roth T, Dement WC, Achermann P. 5th ed. St. Louis, MO: Saunders Elsevier; 2011. Principles and practice of sleep medicine. [Google Scholar]
- 61.Bremer G, Smith JR, Karacan I. Automatic detection of the K-complex in sleep electroencephalograms. IEEE Trans Biomed Eng. 1970;17:314–23. doi: 10.1109/tbme.1970.4502759. [DOI] [PubMed] [Google Scholar]
- 62.Krohne LK, Hansen RB, Christensen JA, Sorensen HB, Jennum P. Detection of K-complexes based on the wavelet transform. Conf Proc IEEE Eng Med Biol Soc. 2014;2014:5450–3. doi: 10.1109/EMBC.2014.6944859. [DOI] [PubMed] [Google Scholar]
- 63.Richard C, Lengelle R. Joint time and time-frequency optimal detection of K-complexes in sleep EEG. Comput Biomed Res. 1998;31:209–29. doi: 10.1006/cbmr.1998.1476. [DOI] [PubMed] [Google Scholar]
- 64.Bankman IN, Sigillito VG, Wise RA, Smith PL. Feature-based detection of the K-complex wave in the human electroencephalogram using neural networks. IEEE Trans Biomed Eng. 1992;39:1305–10. doi: 10.1109/10.184707. [DOI] [PubMed] [Google Scholar]
- 65.Huy Quan V, Gang L, Sukhorukova NS, et al. K-complex detection using a hybrid-synergic machine learning method. Systems, man, and cybernetics, Part C: Applications and reviews. IEEE Trans. 2012;42:1478–90. [Google Scholar]
- 66.Parekh A, Selesnick IW, Rapoport DM, Ayappa I. Detection of K-complexes and Sleep Spindles (DETOKS) using Sparse Optimization. J Neurosci Methods. 2015;251:37–46. doi: 10.1016/j.jneumeth.2015.04.006. [DOI] [PubMed] [Google Scholar]
Associated Data
This section collects any data citations, data availability statements, or supplementary materials included in this article.


