

Abstract
Background:
Intraductal proliferative lesions (IDPLs) of the breast are recognized as a risk factor for subsequent invasive carcinoma development. Although opportunities for IDPL diagnosis have increased, these lesions are difficult to diagnose correctly, especially atypical ductal hyperplasia (ADH) and low-grade ductal carcinoma in situ (LG-DCIS). In order to define the difference between these lesions, many molecular pathological approaches have been performed. However, still we do not have a molecular marker and objective histological index about IDPLs of the breast.
Methods:
We generated full digital pathology archives from 175 female IDPL patients, including usual ductal hyperplasia (UDH), ADH, LG-DCIS, intermediate-grade (IM)-DCIS, and high-grade (HG)-DCIS. After total 2,035,807 nucleic segmentations were extracted, we evaluated nuclear features using step-wise linear discriminant analysis (LDA) and a support vector machine.
Results:
High diagnostic accuracy (81.8–99.3%) was achieved between pathologists’ diagnoses and two-group LDA predictions from nucleic features for IDPL discrimination. Grouping of nuclear features as size and shape-related or intranuclear texture-related revealed that the latter group was more important when distinguishing between normal duct, UDH, ADH, and LG-DCIS. However, these two groups were equally important when discriminating between LG-DCIS and HG-DCIS. The Mahalanobis distances between each group showed that the smallest distance values occurred between LG-DCIS and IM-DCIS and between ADH and Normal. On the other hand, the distance value between ADH and LG-DCIS was larger than this distance.
Conclusions:
In this study, we have presented a practical and useful digital pathological method that incorporates nuclear morphological and textural features for IDPL prediction. We expect that this novel algorithm is used for the automated diagnosis assisting system for breast cancer.
Key words: Intraductal proliferative lesion of breast, nucleic analysis, whole slide imaging
INTRODUCTION
Before the most recent quarter-century, the majority of breast cancer cases were detected at an invasive stage. The dissemination of simple mammography-based screening methods has dramatically increased the opportunity for diagnosing ductal carcinoma in situ (DCIS). The development of mammography has led to improved detection of intraductal proliferative lesions (IDPLs), including usual ductal hyperplasia (UDH), atypical ductal hyperplasia (ADH), and DCIS, which is considered the precursor lesion of invasive cancer.
Furthermore, great progress has been achieved in breast cancer management. Previously, radical mastectomy was the main treatment for breast cancer, but now the use of limited surgery in combination with radiation and chemotherapy has increased. Earlier breast lesion detection has lowered the patient age and accordingly increased expectations for limited surgery from an esthetic viewpoint. Given these parameters, appropriate pathological diagnoses of breast lesions, as well as precursor lesions are now in greater demand than ever before.
Although the definitive diagnosis of a breast lesion depends on a histopathological diagnosis via biopsy, the rate of diagnostic agreement among pathologists is only moderate for IDPLs, especially ADH and low-grade (LG)-DCIS.[1,2,3,4] Therefore, the establishment of objective diagnostic criteria is an urgent requirement because the number of ADH diagnoses in clinical practice increases annually.[5] Initially, ADH was described as ductal hyperplasia with “a loss of shape” and was not thought to be associated with the transition to invasive cancer.[6] ADH was subsequently found to confer a 4–5-fold greater risk of transition to invasive cancer relative to UDH, and it has become necessary to consider ADH and UDH as independent lesions.[7,8] The recent but widely accepted histological definition of ADH is a lesion that has both cytological and architectural features of LG, noncomedo DCIS but involves only a single ductal space or is <2 mm in size.[8,9] The distinction between ADH and LG-DCIS, however, remains difficult and diagnostic dissociation among pathologists is not uncommon.
The pathological concept of “ductal intraepithelial neoplasia (DIN)” was proposed in 1997 as a solution to this problem.[10] DIN explains the progression of IDPLs from UDH to DCIS as a sequential lesion. DIN can be classified into three categories. Grade 1 DIN (DIN1) includes UDH, ADH, and LG-DCIS. Grade 2 (DIN2), and Grade 3 DIN (DIN3) correspond to intermediate-grade (IM)-DCIS and high-grade (HG)-DCIS, respectively. Hence, the most significant characteristic of the DIN classification is the inclusion of ADH and LG-DCIS in the same category, given their low differential diagnostic agreement. The risks of invasive cancer development from ADH and DCIS are relatively low (4–5% and 8–10%, respectively),[11] and the psychological strain upon patients and their families can be reduced by avoiding the use of the word “carcinoma” for cases of DCIS.
On the other hand, a clinical gap remains between ADH and DCIS. The topics of treatment following ADH diagnosis by needle biopsy and the implication of ADH in the resection stump of a breast surgery specimen remain open for discussion; therefore, the need for accurate ADH and DCIS diagnosis is considered significant. With the recent advances in molecular biology, gene expression profiling has been used to explain carcinogenic mechanisms and facilitate diagnoses. For breast cancer, prognosis prediction tools such as OncotypeDX® (Genomic Health, Inc., Redwood City, CA, USA) have been commercialized. However, given their high cost, it is unlikely that such tools will be widely used. In addition, although genetic analysis derives information from a very small number of cells in a cancer tissue, pathologists make diagnoses based on a comprehensive analysis of all tissues in a section. From their perspective, a more comprehensive range of quantitative information should be used to facilitate diagnosis. Hence, according to pathologists’ experiences,[12] whole slide imaging (WSI)-based analysis is the best tool for objectively evaluating the morphology of lesions in pathological tissue specimens. In addition to the molecular pathological approach, this technique considers the integration of a series of information related to molecular expression, nuclear morphology, and the organizational structure of the pathological malignancy. In this study, the usefulness of image analysis is verified using WSI of pathological sections of mammary gland ductal lesions.
METHODS
Samples
We analyzed a total of 175 breast tissue specimens representative of 6 histological types [Table 1]: 4 UDH specimens [Figure 1a], 21 ADH specimens [Figure 1b], 72 LG-DCIS specimens [Figure 1c], 29 IM-DCIS specimens, and 24 HG-DCIS specimens [Figure 1d], as well as 25 normal breast tissue specimens obtained from formalin-fixed, paraffin-embedded (FFPE) blocks in which no diagnostic lesions had been detected. All specimens were diagnosed and surgically obtained at Shinshu University Hospital between 2011 and 2013. None of the specimens included invasive lesions nor those treated with neoadjuvant chemotherapy. This study was performed according to the Helsinki Declaration and was approved by the ethical committee of Shinshu University, Japan.
Table 1.
Number of measured nuclei according to histological diagnosis
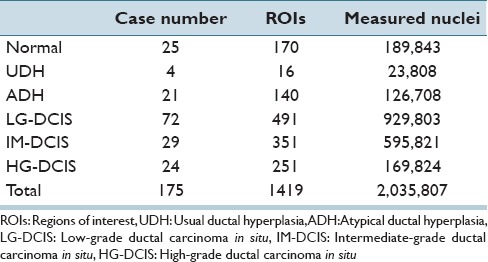
Figure 1.
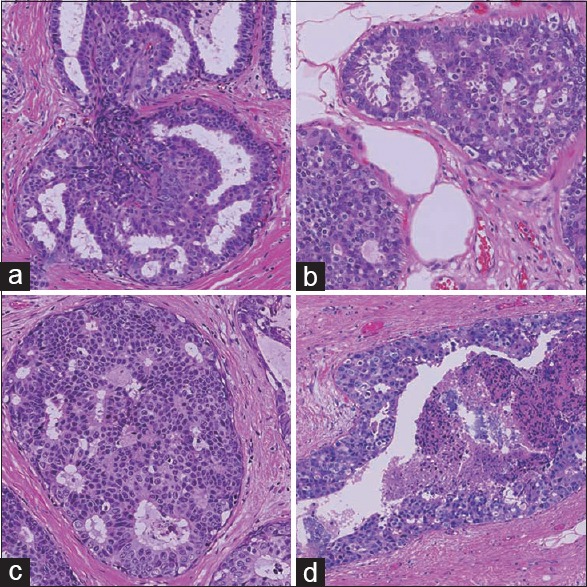
Microscopic morphology of hematoxylin and eosin stained intraductal proliferative lesions (×200). (a) Usual ductal hyperplasia, (b) atypical ductal hyperplasia, (c) low-grade ductal carcinoma in situ, and (d) high-grade ductal carcinoma in situ
Tissue Preparation and Whole Slide Scanning
All FFPE samples were sectioned at a thickness of 3 μm. After hematoxylin and eosin staining according to the standard method, all slides were scanned using a WSI scanner (Nanozoomer 2.0-HT slide scanner; Hamamatsu Corp., Hamamatsu, Shizuoka, Japan) at ×20 magnification and were stored as TIFF files on a computer system.
Analytical Image Selection and Histological Classification
From whole slide images, analysis target areas or regions of interest (ROI) were selected manually. A single ROI image measured 2048 pixels × 2048 pixels, corresponding to 0.942 mm × 0.942 mm on the slide. Whole slide images contained mammary ducts, as well as stromal cells and areas of lymphocyte aggregation, among other features. Manual ROI selection was performed to confirm the positions of mammary glands and avoid areas containing scanning artifacts (e.g., poor focus). A total of 1419 ROIs were selected [Table 1]. For each ROI image, we diagnosed lesions based on the World Health Organization (WHO) classification criteria. At least three well-trained pathologists independently diagnosed and scored each ROI; collective consensus regarding discrepant results was reached through discussion. We initially classified each ROI into 1 of 4 main classes: Normal, UDH, ADH, and DCIS. DCIS ROIs were subsequently classified as LG, IM-grade, and HG.
Quantitative Morphological Image Analysis
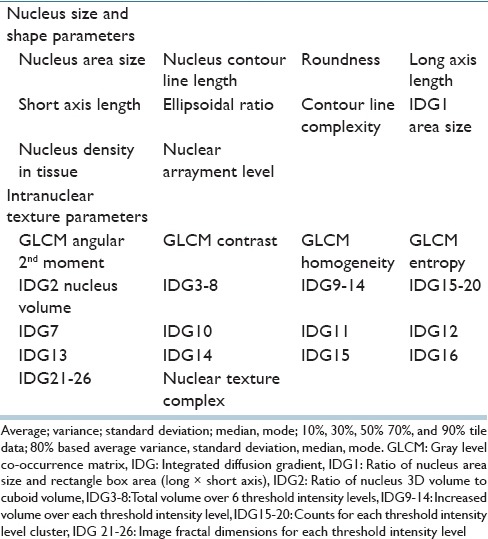
We subjected the ROI images to a quantitative morphological analysis according to a previously described method.[13] The first analytical step was the extraction of the nuclear contours. Three image filters (2 difference-of-Gaussian sizes; 1 Hough) were used to locate the approximate centers of nuclei from hematoxylin signal images. After aggregation and nonmaxima suppression, polar cross-sections were extracted from the candidate centers. From the hematoxylin signal peaks on polar images, an algorithm determined the nuclear contour line using a snake line adaptation method. Figure 2 shows an example of nuclear extraction. Although the ROIs were centered on areas of mammary gland lesions, the images still contained fibroblasts, myoepithelial cells, lymphocytes, and other immunological cells. These cells were excluded using manually created masks. The algorithm then measured textural features using the integrated diffusion gradient method. For each nucleus, the algorithm measured a total of 40 morphological features [Table 2]. These features were separated into two Groups: Size- and shape-related features and intranuclear texture features.
Figure 2.
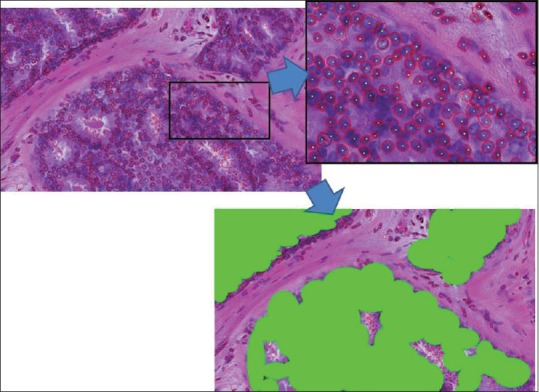
Example of nuclear contour extraction results. The enlarged partial position is on the upper right. Red lines indicate the automatically extracted nuclear contour line. Yellow dots indicate the nuclear center position. The lower image is a manually created masked image. Nuclear features were measured only on selected nuclei indicated in green areas
Table 2.
Nuclear morphological parameters
For each ROI, the analysis could produce 200–5000 nuclei; from all ROIs, a total of 2,035,808 nuclei were measured. The algorithm then summarized these nuclear features by evaluating their statistical distributions over each ROI. The average, variance, standard deviation, median, mode, and percentiles (10, 30, 50, 70, and 90) were measured. To reduce the effects of nuclear contour extraction errors (e.g., ≥2 touching nuclei resulting in a single contour), the algorithm also measured these statistical distributions over 80% of the centered nuclei by ignoring the 10% comprising the largest nuclei and 10% comprising the smallest nuclei. A total of 15 statistics were measured for each of 40 features, resulting in 600 ROI features. A first feature reduction was then applied by eliminating features that exhibited no variance over the 1419 ROI dataset, yielding 472 features.
To identify the feature sets that were useful for distinguishing each lesion, a multiclass step-wise linear discriminant analysis (LDA) method was used. For this feature selection, a P- 0.05 was set for the discriminant function IN and OUT level. We used the Statistical Analysis Software Package R (R Project for Statistical Computing; http://www.r-project.org.
Furthermore, to confirm the discrimination level, we applied the machine learning method support vector machine (SVM), for which we used both linear and radial basis function kernels.[14] In this paper, we have reported the results using linear kernel SVM. To achieve a more accurate discrimination, we trained the SVM with 98% of the data and tested it with the remaining 2% (split randomly). This was performed >100 times, and the average results are reported. Although very similar to LDA, the advantage of linear SVM is that it looks directly at data points instead of approximate normal distributions when building the decision boundaries. Both LDA and SVM are used for discrimination purpose, but SVM needs the training set for creating the model, and prediction set for checking. SVM uses all given features, on the other hand, step-wise LDA uses minimum features set. Comparing both method results and discrimination rate, we analyzed features contribution level for each lesion discrimination.
RESULTS
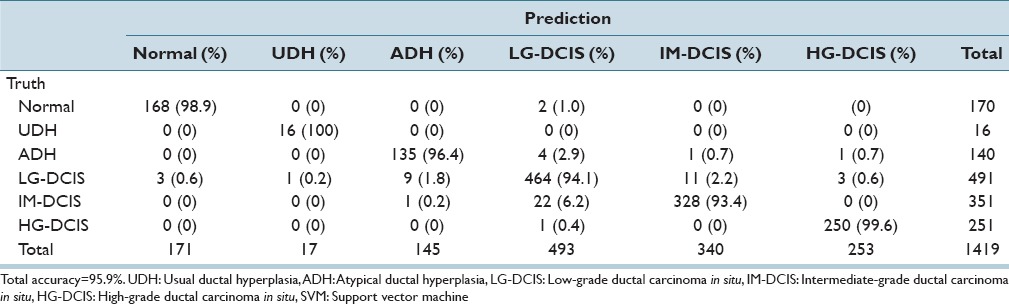
We first applied LDA and SVM to all 6 histological groups: Normal, UDH, ADH, LG-DCIS, IM-DCIS, and HG-DCIS [Tables 3a and b]. Table 3a shows an analysis of a total of 170 Normal mammary gland ROIs. By step-wise LDA, 147 ROIs were correctly classified as Normal. The remaining 4, 10, 5, 3, and 1 ROIs were misclassified, respectively, as UDH, ADH, LG-DCIS, IM-DCIS, and HG-DCIS. The diagonal cells in the table show the numbers of correctly classified ROIs. The overall accuracy rates of LDA and SVM were 77.4–95.9%, respectively. LDA yielded a lower accuracy because this method assumes a normal data distribution; however, realistically the distribution is closer to a Chi-square distribution with 2° of freedom. When using LDA, ADH had the lowest accuracy level (67.1%) [Table 3a], whereas when using SVM, IM-DCIS had the lowest accuracy level (93.4%) [Table 3b].
Table 3a.
Step-wise linear discriminant analysis results
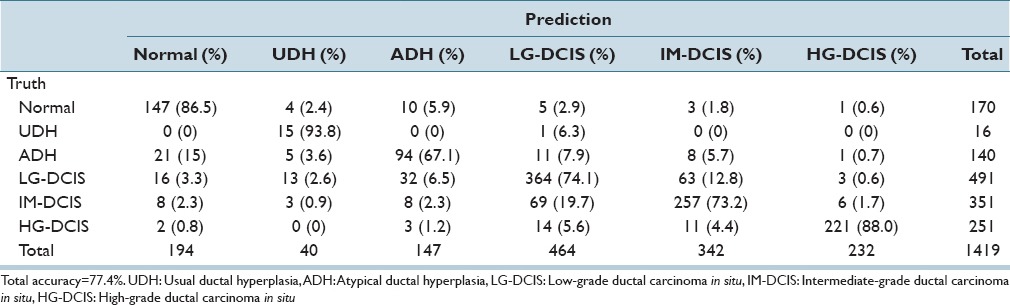
Table 3b.
Linear SVM analysis results
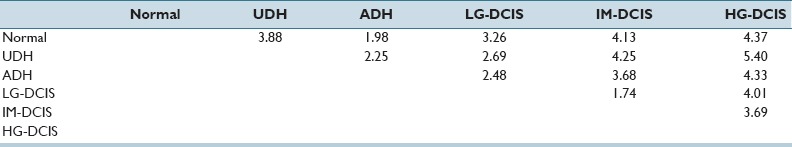
In Supplementary Table 1 (4.9MB, tif) , we report the standardized coefficient values of selected features for each pair-wise discriminant function. These values are useful for intuitively confirming the discrimination power of individual features. However, because the discriminant functions are pair-wise, for our six classes 15 coefficients required evaluation and the number of selected features became large. Hence, we performed a step-wise LDA (in which features with the highest prediction power were selected greedily and their variances were removed until the correlations stopped changing significantly) for each combination of histopathological conditions. High diagnostic accuracy (81.8–99.3%) was achieved, and the results are shown in Tables 4a and b. Table 4c shows the Mahalanobis distances between each group centroid. In this table, we note that the smallest distance values occurred between LG-DCIS and IM-DCIS and between ADH and Normal (1.73567 and 1.98269, respectively). The distance value between ADH and LG-DCIS (2.48288) was larger than these distance, and the values between HG-DCIS and the other types were, relatively, large. In Supplementary Table 2 (10.3MB, tif) , we report the standardized coefficient values of selected features after performing step-wise LDA. Blank table cells correspond to features that were not selected by a paired histological criteria analysis.
Table 4a.
Step-wise discriminant analyses for each combination of histopathological conditions
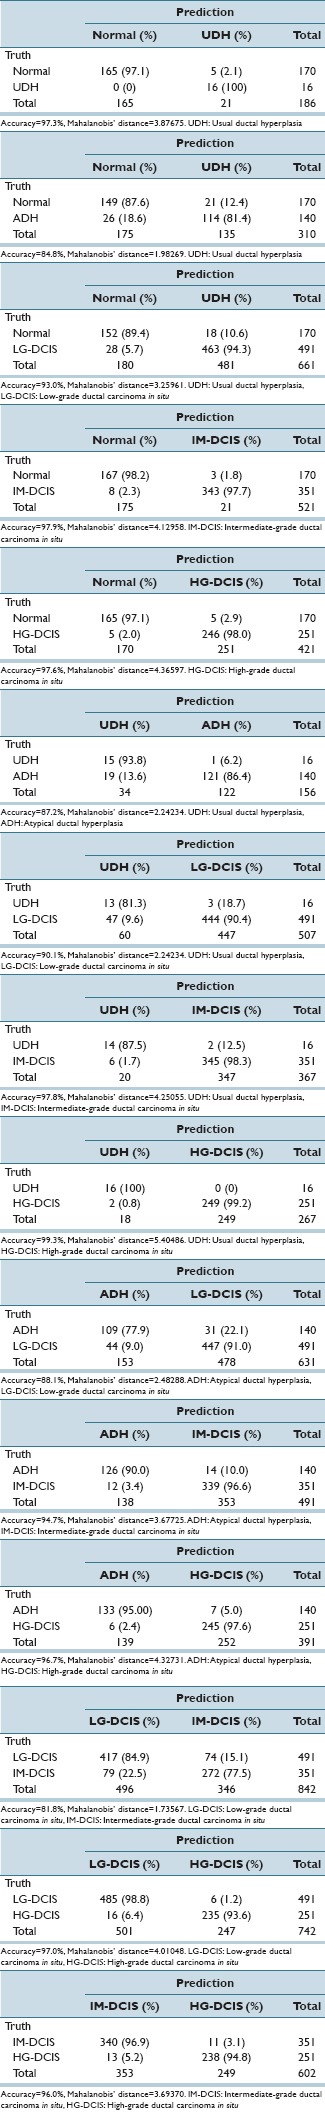
Table 4b.
Accuracy table
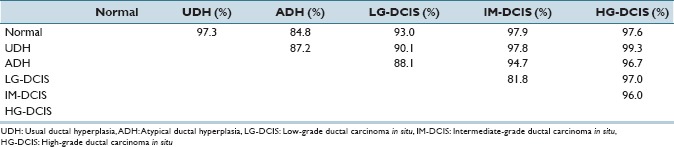
Table 4c.
Mahalanobis’ distance
Step-wise discriminant function (6 group-based) coefficient values
Step-wise discriminant function (2 group-based) coefficient values
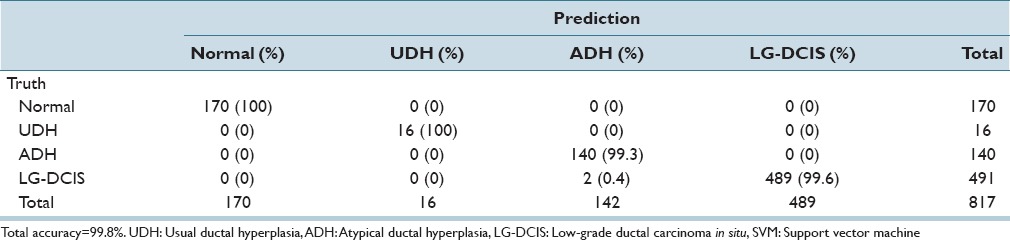
While focusing on LG-DCIS and benign lesions, we reduced the number of groups to 4 (Normal, UDH, ADH, and LG-DCIS). Tables 5a and b present the results obtained when using all features with LDA and SVM, respectively. Tables 5c and d show the results obtained using only nucleus size and shape-related features, whereas Tables 5e and f show those based on only intranuclear textural features. We noted that using only nucleus size- and shape-related features resulted in lower accuracy rates for both LDA (62.1% vs. 81.4%, respectively) and SVM (80.0% vs. 99.8%).
Table 5a.
Step-wise linear discriminant analysis: Nuclear size and shape and intranuclear texture features
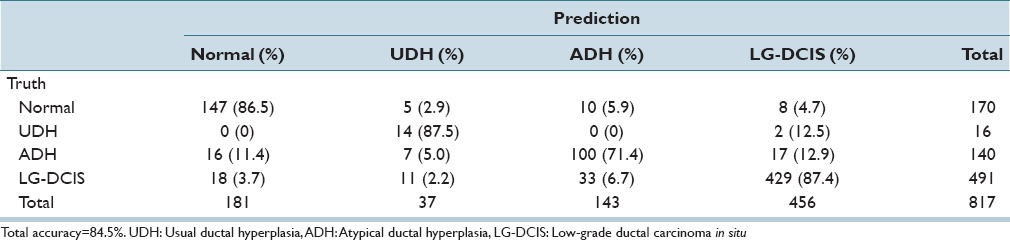
Table 5b.
Linear kernel SVM discriminant analysis: Nuclear size and shape and intranuclear texture features
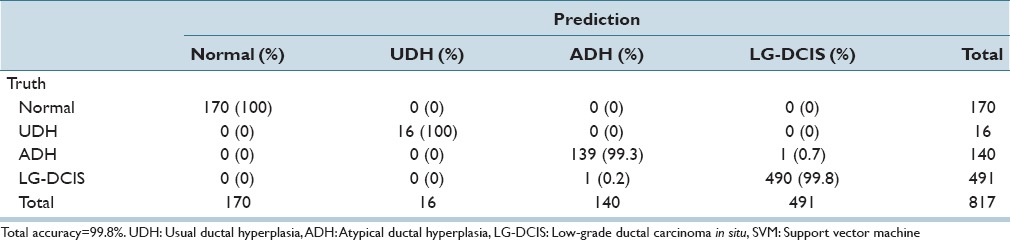
Table 5c.
Step-wise linear discriminant analysis: Nuclear size and shape features
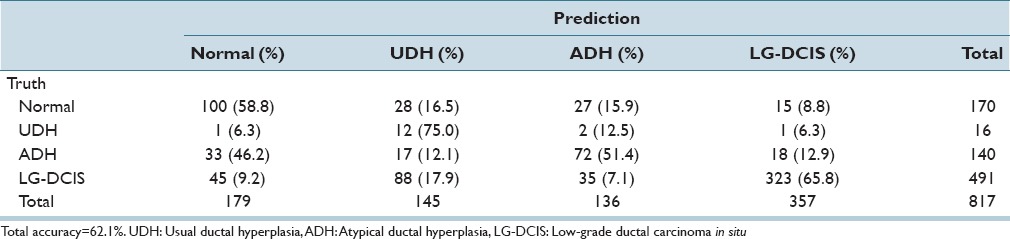
Table 5d.
Linear kernel SVM discriminant analysis: Nuclear size and shape features
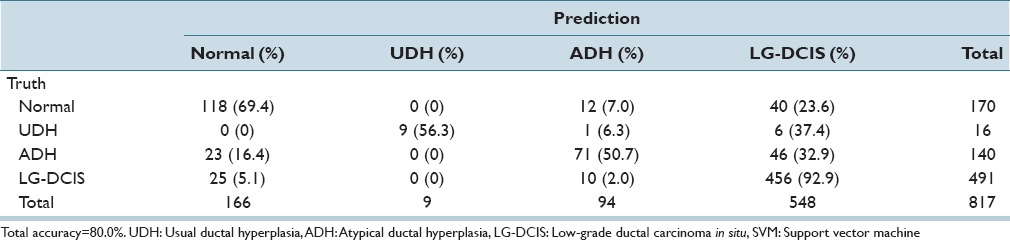
Table 5e.
Step-wise linear discriminant analysis: Intranuclear texture features
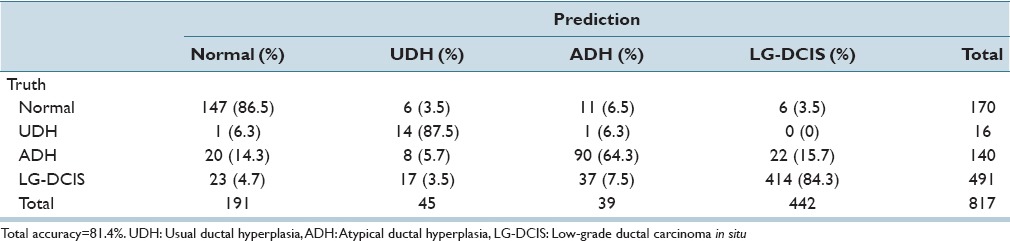
Table 5f.
Linear kernel SVM discriminant analysis: Intranuclear texture features
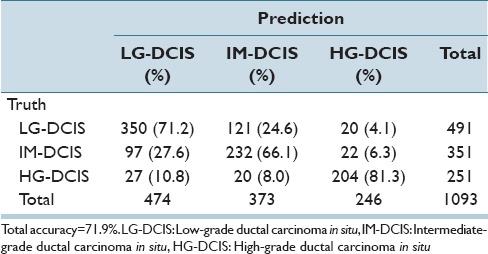
The same analysis was performed while focusing on the 3 DCIS grades (LG-DCIS, IM-DCIS, and HG-DCIS), and these results are reported in Table 6a-f. For this grouping, no significant differences in accuracy were observed between the two types of features. This demonstrates that although intranuclear texture features were more important when analyzing LG-DCIS and benign lesions, the nucleus size and shape features were equally important when grading DCIS lesions.
Table 6a.
Step-wise linear discriminant analysis: Nuclear size and shape and intranuclear texture features
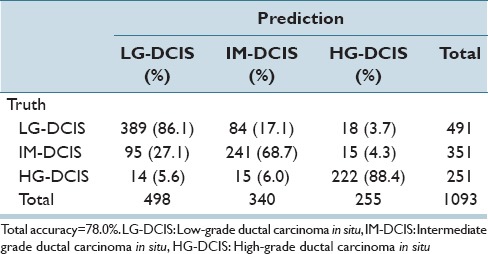
Table 6f.
Linear kernel SVM discriminant analysis: Intranuclear texture features
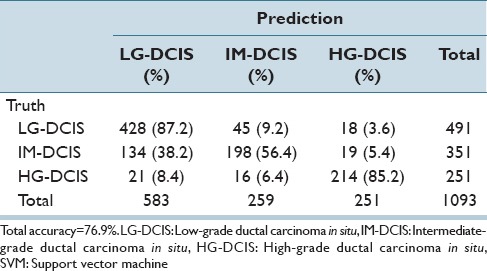
Table 6b.
Linear kernel SVM discriminant analysis: Nuclear size and shape and intranuclear texture features
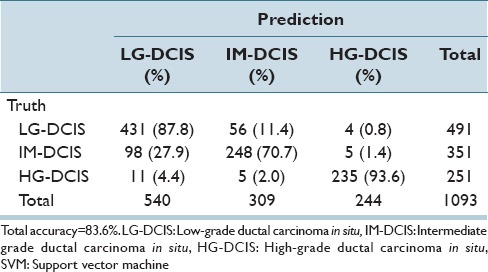
Table 6c.
Step-wise linear discriminant analysis: Nuclear size and shape features
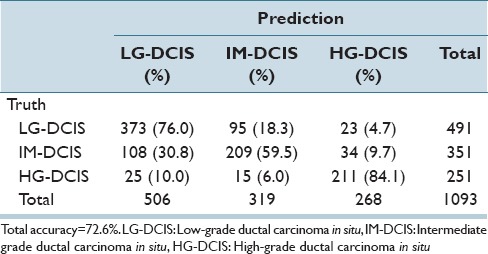
Table 6d.
Linear kernel SVM discriminant analysis: Nuclear size and shape features
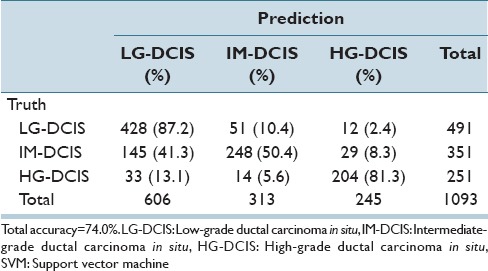
Table 6e.
Step-wise linear discriminant analysis: Intranuclear texture features
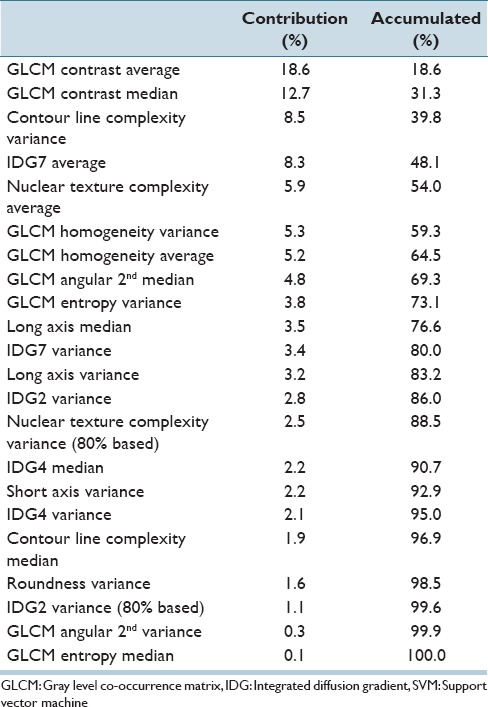
[Table 7] shows the levels of contribution for the top 22 features in an SVM analysis of the six histological classes. Nucleus size- and shape-related features accounted for 10.5%, whereas intranuclear texture accounted for 89.5%.
Table 7.
Contribution level of each feature via SVM analysis
In the WHO classification published in 2012, IDPLs were regarded as an independent category that included UDH, columnar cell lesions (e.g., columnar cell changes and hyperplasia, flat epithelial hyperplasia), ADH, and DCIS.[15] This categorization stratified IDPLs, which carry a risk of invasive ductal carcinoma, while targeting a practical diagnosis. ADH was first proposed as a lesion harboring the risk of invasive ductal carcinoma by Page et al. in 1985.[7,16]
On the other hand, a relatively low rate of concordance between pathologists has been noted with respect to ADH diagnostic criteria.[1,2,3] Some authors have reported that the introduction of unified diagnostic criteria[17] and supportive immunohistochemistry[3] have led to an increase in diagnostic concordance. However, other authors reported that the incidence of diagnostic discrepancy was not reduced, despite the introduction of unified diagnostic criteria.[18]
Under these circumstances, Rosai proposed the addition of mammary intraepithelial neoplasia, which corresponds to all IDPLs.[19] This new classification is effective for pathologists; however, it could cause confusion with regard to clinical management. Despite its noninvasive nature, the management of DCIS, generally, conforms to that of invasive carcinoma; therefore, total tumor resection is usually applicable. Accordingly, the introduction of DIN grades, in which the absence of invasion indicates a noncarcinoma lesion, could substantially modify the clinical concept of this disease.
It is customary to perform an initial pathological diagnosis of a mammary lesion via needle biopsy. If the pathological diagnosis is ADH, upstaging to carcinoma occurs in 11–36% of cases based on subsequent resection material.[20,21,22,23,24] Therefore, at minimum an excisional tumor biopsy is advisable following an ADH diagnosis.[20] However, excisional biopsy itself can place considerable stress on the patient. To avoid this, a new pathological diagnostic assessment is under development. Ely et al. reported that ≥3 ADH lesions per needle biopsy specimen indicates a higher risk of upstaging, whereas <3 ADH lesions indicates no risk.[24]
On the other hand, the existence of ADH lesions in the surgical margins of resected breast carcinoma material is of clinical concern. Currently, most researchers do not regard the existence of ADH lesions in the surgical margin as a risk factor for recurrence and, therefore, advise against re-operation.[25,26,27,28]
As mentioned above, although the pathological diagnosis of IDPLs is not simple, the strict distinction of the lesions in this category is clinically necessary. The features extracted using our algorithm show promising discriminatory power, with accuracies exceeding 80% when using LDA [Table 4b]. In particular, an 88% accuracy rate was achieved for HG-DCIS. This might reflect the fact that pathologists, generally, diagnose HG-DCIS based on nuclear atypia. On the other hand, the accuracy rate for ADH was relatively low except when distinguishing IM-DCIS and HG-DCIS. However, an 88.1% discrimination rate was achieved between ADH and LG-DCIS, which is the most problematic for distinction by visual inspection by pathologists. In the case of SVM analysis, the selection of training data set and prediction data set may be affect the accuracy level. In this analysis, all ROI images were treated as independent data. But ROIs came from the same case may have correlation each other. For checking this, we selected the training data set and prediction data set by case bases, and test ADH and LG-DCIS SVM discrimination for 4 times.
The accuracy results are 71.8% (correct predicted ROIs/prediction data set ROIs = 23/32), 75.6% (68/90), 76.5% (75/98), and 95.9% (163/170), the result cross-validation 88% becomes almost average for case level testing. Invasive breast carcinomas had large intercase and intracase heterogeneity. In the case of intraductal lesions, the nuclei-based heterogeneity was small comparing invasive cases. There was the possibility that results of discrimination keep around 80% accuracy level even using only nuclear features. These data suggests that imaging analysis might provide useful support for this distinction.
Table 4c shows the Mahalanobis distance value of two group centroid values on each group distribution. When this value has the small value, two group data have the close features data values. For example, Mahalanobis distance value between Normal and ADH group (1.98) is smaller than Normal and HG-DCIS (4.37), Normal and ADH nuclei have the near measured feature data values intuitively. For considering the similarity of each group data set, we use the Mahalanobis distance value by magnitude correlation. The Mahalanobis distance between each group centroid showed that the smallest distance value between LG-DCIS and IM-DCIS (1.74) followed by the distance between ADH and normal (1.98). The distance value between ADH and LG-DCIS was larger than these distance, indicating that considerable difference in nucleic features lies between ADH and LG-DCIS. It is difficult to explain what individual difference in nuclear features mean biologically and pathologically. However, it is noteworthy that the large distance lies between ADH and LG-DCIS which are considered to be difficult to differentiate morphologically by pathologist's eyes. This large distance indicates that these two diseases are biologically different and should be differentiated strictly at pathological diagnosis.
Moreover, the distance value between UDH and normal (3.88) was larger than that of LG-DCIS and normal (3.26), as well as that of ADH and normal. Although UDH is regarded as the disease that has the lowest risk to develop to invasive cancer in IDPLs, it may be possible that UDH has a different character from the other IDPLs from the viewpoint of nucleic features.
The smallest distance value was identified between LG-DCIS and IM-DCIS. When LG-DCIS is diagnosed by pathologists, the major ground of diagnosis is its structural atypia along with the monotonous nuclear shape of individual cells. If the nuclear pleomorphism exists to some extent, but not prominent like HG-DCIS, the lesion is diagnosed as IM-DCIS. Therefore, when the analytic features of over a thousand nuclei in each ROI images were averaged, the Mahalanobis distance value between LG-DCIS and IM-DCIS resulted in relatively small. This is supported by the larger distance value between IM-DCIS and HG-DCIS (3.69), in which the nuclear pleomorphism is prominent.
To explore the nuclear characteristics used for pathological diagnosis of intraductal lesions, the 472 imaging analysis features were simply classified as size and shape-related and intranuclear texture-related prior to further analysis. Interestingly, the intranuclear texture was found to be more important than size and shape when discriminating among normal duct, UDH, ADH, and LG-DCIS. On the other hand, nucleus size and shape and intranuclear texture were equally important only when grading DCIS, and therefore, both characteristics are apparently necessary for this process.
In summary, this study has shown that computerized analysis based on a detailed imaging study of nuclei can simulate pathological diagnoses of IDPLs. This study was limited to the analysis of nuclear data and did not consider other tissue data, including size, distribution, and presence of necrosis. Although this method is not a substitute for visual pathological analysis, the high accuracy rates of the reported methods suggest that it provides practical and useful support for pathological diagnosis, and, therefore, further studies are expected.
Financial Support and Sponsorship
Nil.
Conflicts of Interests
The authors declare that they have no competing interests.
Footnotes
Available FREE in open access from: http://www.jpathinformatics.org/text.asp?2016/7/1/1/175380
Contributor Information
Akira Saito, Email: ak-saito@tokyo-med.ac.jp.
Masahiko Kuroda, Email: kuroda@tokyo-med.ac.jp.
REFERENCES
- 1.Wells WA, Carney PA, Eliassen MS, Tosteson AN, Greenberg ER. Statewide study of diagnostic agreement in breast pathology. J Natl Cancer Inst. 1998;90:142–5. doi: 10.1093/jnci/90.2.142. [DOI] [PubMed] [Google Scholar]
- 2.Palli D, Galli M, Bianchi S, Bussolati G, Di Palma S, Eusebi V, et al. Reproducibility of histological diagnosis of breast lesions: Results of a panel in Italy. Eur J Cancer. 1996;32A:603–7. doi: 10.1016/0959-8049(95)00609-5. [DOI] [PubMed] [Google Scholar]
- 3.Jain RK, Mehta R, Dimitrov R, Larsson LG, Musto PM, Hodges KB, et al. Atypical ductal hyperplasia: Interobserver and intraobserver variability. Mod Pathol. 2011;24:917–23. doi: 10.1038/modpathol.2011.66. [DOI] [PubMed] [Google Scholar]
- 4.Tavassoli FA. Ductal intraepithelial neoplasia of the breast. Virchows Arch. 2001;438:221–7. doi: 10.1007/s004280100394. [DOI] [PubMed] [Google Scholar]
- 5.Elston CW, Sloane JP, Amendoeira I, Apostolikas N, Bellocq JP, Bianchi S, et al. Causes of inconsistency in diagnosing and classifying intraductal proliferations of the breast. European Commission Working Group on breast screening pathology. Eur J Cancer. 2000;36:1769–72. doi: 10.1016/s0959-8049(00)00181-7. [DOI] [PubMed] [Google Scholar]
- 6.Page DL, Vander Zwaag R, Rogers LW, Williams LT, Walker WE, Hartmann WH. Relation between component parts of fibrocystic disease complex and breast cancer. J Natl Cancer Inst. 1978;61:1055–63. [PubMed] [Google Scholar]
- 7.Page DL, Dupont WD, Rogers LW, Rados MS. Atypical hyperplastic lesions of the female breast. A long-term follow-up study. Cancer. 1985;55:2698–708. doi: 10.1002/1097-0142(19850601)55:11<2698::aid-cncr2820551127>3.0.co;2-a. [DOI] [PubMed] [Google Scholar]
- 8.Tavassoli FA, Norris HJ. A comparison of the results of long-term follow-up for atypical intraductal hyperplasia and intraductal hyperplasia of the breast. Cancer. 1990;65:518–29. doi: 10.1002/1097-0142(19900201)65:3<518::aid-cncr2820650324>3.0.co;2-o. [DOI] [PubMed] [Google Scholar]
- 9.Page DL, Rogers LW. Combined histologic and cytologic criteria for the diagnosis of mammary atypical ductal hyperplasia. Hum Pathol. 1992;23:1095–7. doi: 10.1016/0046-8177(92)90026-y. [DOI] [PubMed] [Google Scholar]
- 10.Tavassoli FA. Mammary intraepithelial neoplasia: A translational classification system for the intraductal epithelial proliferations. Breast J. 1997;3:48–58. [Google Scholar]
- 11.Dupont WD, Page DL. Risk factors for breast cancer in women with proliferative breast disease. N Engl J Med. 1985;312:146–51. doi: 10.1056/NEJM198501173120303. [DOI] [PubMed] [Google Scholar]
- 12.Saito A, Cosatto E, Kiyuna T, Sakamoto M. Dawn of the Digital Diagnosis Assisting System, Can it Open a New Age for Pathology? Proc SPIE. 2013;8676:867602. [Google Scholar]
- 13.Cosatto E, Miller M, Graf HP, Meyer JS. Grading Nuclear Pleomorphism on Histological Micrographs. Pattern Recognition, 2008. ICPR 2008. 19th International Conference on. 2008:1–4. [Google Scholar]
- 14.Cosatto E, Laquerre PF, Malon C, Graf HP, Saito A, Kiyuna T, et al. Automated Gastric Cancer Diagnosis on H and E-stained Sections; training a classifier on large scale with multiple instance machine learning. Proc SPIE. 2013;8676:867605. [Google Scholar]
- 15.Lakhani SR, Eiilis IO, Schnitt SJ. International Agency for Research on Cancer; 4th ed. 2012. WHO Classification of Tumours of the Breast; pp. 81–94. [Google Scholar]
- 16.Nguyen CV, Albarracin CT, Whitman GJ, Lopez A, Sneige N. Atypical ductal hyperplasia in directional vacuum-assisted biopsy of breast microcalcifications: Considerations for surgical excision. Ann Surg Oncol. 2011;18:752–61. doi: 10.1245/s10434-010-1127-8. [DOI] [PubMed] [Google Scholar]
- 17.Schnitt SJ, Connolly JL, Tavassoli FA, Fechner RE, Kempson RL, Gelman R, et al. Interobserver reproducibility in the diagnosis of ductal proliferative breast lesions using standardized criteria. Am J Surg Pathol. 1992;16:1133–43. doi: 10.1097/00000478-199212000-00001. [DOI] [PubMed] [Google Scholar]
- 18.Palazzo JP, Hyslop T. Hyperplastic ductal and lobular lesions and carcinomas in situ of the breast: Reproducibility of current diagnostic criteria among community- and academic-based pathologists. Breast J. 1998;4:230–7. doi: 10.1046/j.1524-4741.1998.440230.x. [DOI] [PubMed] [Google Scholar]
- 19.Rosai J. Borderline epithelial lesions of the breast. Am J Surg Pathol. 1991;15:209–21. doi: 10.1097/00000478-199103000-00001. [DOI] [PubMed] [Google Scholar]
- 20.McGhan LJ, Pockaj BA, Wasif N, Giurescu ME, McCullough AE, Gray RJ. Atypical ductal hyperplasia on core biopsy: An automatic trigger for excisional biopsy? Ann Surg Oncol. 2012;19:3264–9. doi: 10.1245/s10434-012-2575-0. [DOI] [PubMed] [Google Scholar]
- 21.Bendifallah S, Defert S, Chabbert-Buffet N, Maurin N, Chopier J, Antoine M, et al. Scoring to predict the possibility of upgrades to malignancy in atypical ductal hyperplasia diagnosed by an 11-gauge vacuum-assisted biopsy device: An external validation study. Eur J Cancer. 2012;48:30–6. doi: 10.1016/j.ejca.2011.08.011. [DOI] [PubMed] [Google Scholar]
- 22.Polat AK, Kanbour-Shakir A, Andacoglu O, Polat AV, Johnson R, Bonaventura M, et al. Atypical hyperplasia on core biopsy: Is further surgery needed? Am J Med Sci. 2012;344:28–31. doi: 10.1097/MAJ.0b013e318234cc67. [DOI] [PubMed] [Google Scholar]
- 23.Winchester DJ, Bernstein JR, Jeske JM, Nicholson MH, Hahn EA, Goldschmidt RA, et al. Upstaging of atypical ductal hyperplasia after vacuum-assisted 11-gauge stereotactic core needle biopsy. Arch Surg. 2003;138:619–22. doi: 10.1001/archsurg.138.6.619. [DOI] [PubMed] [Google Scholar]
- 24.Ely KA, Carter BA, Jensen RA, Simpson JF, Page DL. Core biopsy of the breast with atypical ductal hyperplasia: A probabilistic approach to reporting. Am J Surg Pathol. 2001;25:1017–21. doi: 10.1097/00000478-200108000-00005. [DOI] [PubMed] [Google Scholar]
- 25.Greene T, Tartter PI, Smith SR, Estabrook A. The significance of surgical margins for patients with atypical ductal hyperplasia. Am J Surg. 2006;192:499–501. doi: 10.1016/j.amjsurg.2006.06.024. [DOI] [PubMed] [Google Scholar]
- 26.Arora S, Menes TS, Moung C, Nagi C, Bleiweiss I, Jaffer S. Atypical ductal hyperplasia at margin of breast biopsy – is re-excision indicated? Ann Surg Oncol. 2008;15:843–7. doi: 10.1245/s10434-007-9681-4. [DOI] [PubMed] [Google Scholar]
- 27.Baker JL, Hasteh F, Blair SL. Atypical Ductal hyperplasia at the margin of lumpectomy performed for early stage breast cancer: Is there enough evidence to formulate guidelines? Int J Surg Oncol 2012. 2012:297832. doi: 10.1155/2012/297832. [DOI] [PMC free article] [PubMed] [Google Scholar]
- 28.Li S, Liu J, Yang Y, Zeng Y, Deng H, Jia H, et al. Impact of atypical hyperplasia at margins of breast-conserving surgery on the recurrence of breast cancer. J Cancer Res Clin Oncol. 2014;140:599–605. doi: 10.1007/s00432-014-1597-3. [DOI] [PMC free article] [PubMed] [Google Scholar]
Associated Data
This section collects any data citations, data availability statements, or supplementary materials included in this article.
Supplementary Materials
Step-wise discriminant function (6 group-based) coefficient values
Step-wise discriminant function (2 group-based) coefficient values