Significance
The synthesis of a protein takes tens of seconds to a few minutes, in which amino acids are polymerized linearly. Nonuniform progression of this elongation process is thought to be important for the subsequent fates of newly synthesized proteins. However, there have been few attempts to profile elongation intermediates, polypeptidyl–tRNAs, directly. Here we attempted to detect systematically the accumulation of tRNA-linked nascent chain intermediates during the translation of Escherichia coli proteins in vivo and in vitro. The results revealed the widespread occurrence of translational pausing in a manner correlated with the subcellular localization and solubility properties of proteins. Our in vivo/in vitro integrated nascent chain profiling provides groundwork information for our understanding of genetic message translation into functional proteins.
Keywords: translation pausing, nascent polypeptides | Escherichia coli, peptidyl–tRNA
Abstract
Although the importance of the nonuniform progression of elongation in translation is well recognized, there have been few attempts to explore this process by directly profiling nascent polypeptides, the relevant intermediates of translation. Such approaches will be essential to complement other approaches, including ribosome profiling, which is extremely powerful but indirect with respect to the actual translation processes. Here, we use the nascent polypeptide's chemical trait of having a covalently attached tRNA moiety to detect translation intermediates. In a case study, Escherichia coli SecA was shown to undergo nascent polypeptide-dependent translational pauses. We then carried out integrated in vivo and in vitro nascent chain profiling (iNP) to characterize 1,038 proteome members of E. coli that were encoded by the first quarter of the chromosome with respect to their propensities to accumulate polypeptidyl–tRNA intermediates. A majority of them indeed undergo single or multiple pauses, some occurring only in vitro, some occurring only in vivo, and some occurring both in vivo and in vitro. Thus, translational pausing can be intrinsically robust, subject to in vivo alleviation, or require in vivo reinforcement. Cytosolic and membrane proteins tend to experience different classes of pauses; membrane proteins often pause multiple times in vivo. We also note that the solubility of cytosolic proteins correlates with certain categories of pausing. Translational pausing is widespread and diverse in nature.
Biosynthesis of each protein comprises the translational initiation, elongation, and termination processes. Repeated in the elongation phase are (i) elongation factor thermo unstable (EF-Tu)-mediated accommodation of a codon-specified aminoacyl–tRNA to the A-site of the ribosome; (ii) transpeptidation from the P-site polypeptidyln–tRNA (“n” specifies the number of amino acid residues) to the A-site aminoacyl–tRNA; and (iii) translocation of the polypeptidyln+1–tRNA back to the P-site facilitated by elongation factor EF-G. The elongation phase continues for the time window that is determined by the polypeptide size and the step time of ribosome progression, 40–70 ms in bacteria (1, 2). However, nascent chain elongation does not necessarily proceed at a uniform speed through completion, and we still lack precise knowledge about the local elongation speed of individual proteins.
It is known that the elongation process can be subject to a range of local fluctuations, from a temporary pause to a prolonged stall, to which the elements in both mRNA and the nascent polypeptide contribute. The mRNA elements include the rarity of codons in relation to the abundance of the corresponding tRNA, the mode of codon–anticodon paring, and the structured regions (1, 3–5). However, it was proposed recently, on the basis of the results of ribosome profiling experiments, that in bacteria, Shine–Dalgarno (SD)-like sequences within coding regions are the primary determinants of translational pausing (6). Features of a nascent polypeptide also can modulate translation progression. Segments of amino acid sequences containing two or three consecutive proline residues of nascent polypeptides can lead to the pausing of elongation beyond them, although the pausing is largely alleviated by the action of a specialized elongation factor, EF-P, in bacteria (7–9). More generally, a range of amino acid sequences is known to arrest specific steps of translation in a cis-specific manners (10). They are integral parts of regulatory nascent polypeptides that monitor cellular physiology by undergoing regulated translational arrest (10, 11). Arrest sequences interact with the ribosomal components at the peptidyl transferase center and/or the exit tunnel to interfere with the peptidyl transfer, translocation, or termination functions of the ribosome (12–15). They are diverse in length and primary sequences; translation arrest is either inducible with a specific small molecule or is intrinsic but is subject to release by a physical pulling force that is applied to the nascent chain (10, 16, 17). Although SecM (secretion monitor protein), an intrinsic class of arrest peptide, robustly stalls the ribosome under Sec-pathway–compromised conditions in vivo, different single amino acid substitutions in its arrest sequence lead to different degrees of temporary pausing (18). Thus, the amino acid sequences of nascent polypeptides can modulate the local elongation speed.
Detecting translational pausing in vivo is technically challenging. Pulse-chase measurements of the appearance of 35S-methione radioactivity in the full-length polypeptide are useful for assessing overall translation speeds for long polypeptides or at low temperature (1, 19, 20) but are unable to provide information about intermediates states. In contrast, in the innovative ribosome-profiling technique (21), ribosomal occupancy peaks along a single mRNA species are thought to reflect local ribosomal pausing with nucleotide-level resolution. However, profiling outcomes could be affected by the binding of nontranslating ribosomes to certain regions of mRNA, isolation procedures and the stability of mRNA–ribosome complexes, biased conversion of the mRNA fragments into complementary DNAs, and procedures for aligning the ribosome-protected base sequences (9, 22–31). These considerations underscore the importance of profiling the translation progression directly. To do so, we must detect nascent polypeptides, which are ester-linked to a respective tRNA at the growing (C-terminal) ends.
We previously reported an electrophoretic method of detecting cellular nascent polypeptides (termed the “nascentome”) (32). This method is based on the fact that the tRNA moiety of a polypeptidyl–tRNA retards the electrophoretic mobility in neutral pH SDS/PAGE by the equivalent of ∼18 kDa as compared with the polypeptide itself. In the present study, we used this principle to detect nascent chains of specific proteins. We thus carried out systematic profiling of nascent chain elongation in vivo and in vitro in parallel for the products of 1,038 Escherichia coli genes. This approach, termed “integrated in vivo/vitro nascent chain profiling” (iNP), revealed that a majority of the proteins underwent single or multiple pausing events, some of which took place only in vitro, only in vivo, or both in vitro and in vivo. We discuss the possible biological significance of the widely observed translational pausing.
Results
Elongation Profiling of a Specific Protein by Subnascentome Analysis.
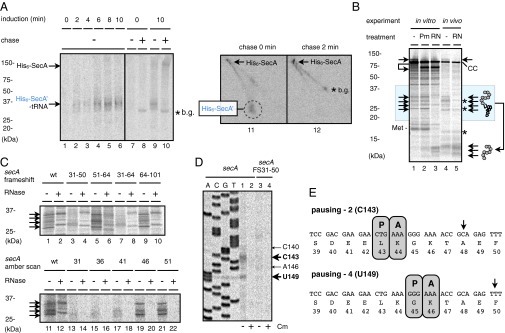
Previously, we devised a 2D electrophoretic method to display nascent polypeptide chains (“nascentome members”) separately from translation-completed chains (32). Removal of the tRNA from polypeptidyl–tRNAs after the first-dimension electrophoresis makes nascent polypeptides form a line below the main diagonal line in the second dimension. We extend this method to display growing polypeptides of a specific protein, which may be termed a “subnascentome,” using the ASKA (a complete set of E. coli K-12 ORF archive) library of E. coli genes encoding N-terminally His6-tagged proteins (33). A gene to be examined is induced briefly, and cells are pulse-labeled with [35S]methionine, followed by Ni2+-affinity isolation of SDS-denatured polypeptide/polypeptidyl–tRNA, which are subjected to the 2D separation. A translational pause at a prescribed position along the nascent chain will result in the formation of a radioactive spot well below the main diagonal, whereas continuous elongation would lead to a continuous or stepwise increase in radioactivity along the nascent polypeptide line. As a case study, we examined the biosynthesis of the protein export motor protein SecA by pulse-labeling the His6-SecA–expressing cells for 30 s at 20 °C. Electrophoresis at neutral pH revealed a broad band (Fig. 1A, lanes 2–6), which formed spots on the nascent polypeptide line but not on the main diagonal line upon the 2D separation (Fig. 1A, panel 11). The polypeptidyl–tRNA species were observed irrespective of the induction lengths (2–10 min) (Fig. 1A, lanes 2–6), suggesting that their production may not have been an overproduction artifact. They disappeared after a chase with unlabeled methionine, suggesting that they represented translation intermediates (Fig. 1A, lane 10 and panel 12). These results suggest that secA translation undergoes pausing.
Fig. 1.
Detection of polypeptidyl–tRNA intermediates in the synthesis of a specific protein: case studies of SecA. (A) Subnascentome analysis of SecA. E. coli cells harboring pCA24N-secA were grown at 20 °C and induced for the expression of His6-SecA for 0–10 min as indicated, followed by pulse-labeling with [35S]methionine for 0.5 min. Chase with unlabeled methionine for 2 min was included as indicated (lanes 8 and 10 and panel 12). Labeled His6-SecA species were affinity isolated, resolved by 1D (lanes 1–10) and 2D (panels 11 and 12) Nu-PAGE electrophoresis (32), and visualized by phosphorimaging. Translation-completed SecA (His6-SecA), elongation intermediates (His6-SecA'–tRNA; lanes 2–6 and 9) and the polypeptide moieties of the intermediates (His6-SecA', panel 11) are indicated. b.g, background signal. (B) iNP analysis of SecA. His6-SecA was synthesized in vitro (lane 1), followed by treatment with puromycin as indicated (PM, lanes 2 and 3). In parallel, the same protein was induced briefly in vivo, pulse-labeled, and affinity-isolated (lanes 4 and 5). Labeled protein species were separated by WIDE RANGE Gel electrophoresis after optional treatment with RNase A (RN, lanes 3 and 5). Radioactive bands representing polypeptidyl–tRNA intermediates are indicated by arrows. CC, translation-completed SecA (completed chain); Met, methionyl–tRNA; *background signal. (C) Mutational effects on the production of the elongation intermediates of SecA. In vitro transcription–translation using the PURE system was directed by the DNA template of His6-SecA (lanes 1, 2, 11, and 12), its frame-shifted mutants (lanes 3–10, indicated by residue numbers specifying the target segments), and its amber mutants (lanes 13–22, indicated by residue numbers specifying the sites of amber codon introduction). RNase A-treated (+) and untreated (−) samples were electrophoresed. Arrows indicate the RNase-sensitive intermediates of SecA. (D) Toeprint analysis of ribosomal stalling on secA. Coupled transcription–translation was directed by the secA (lanes 1 and 2) and the frame-shifted (FS31–50; lanes 3 and 4) templates in the presence or absence of 100 µg/mL chloramphenicol (Cm). Reaction mixtures then were subjected to reverse transcription using a downstream fluorescent primer. Dideoxy sequencing reactions also were primed with the same primer (lanes A, C, G, and T). (E) Schematic illustrations of the major sites of ribosome stalling on the secA mRNA. The points of reverse transcription interference are indicated by arrows, and the ribosomal occupancies are shown by the A-site (A) and P-site (P) codons.
iNP.
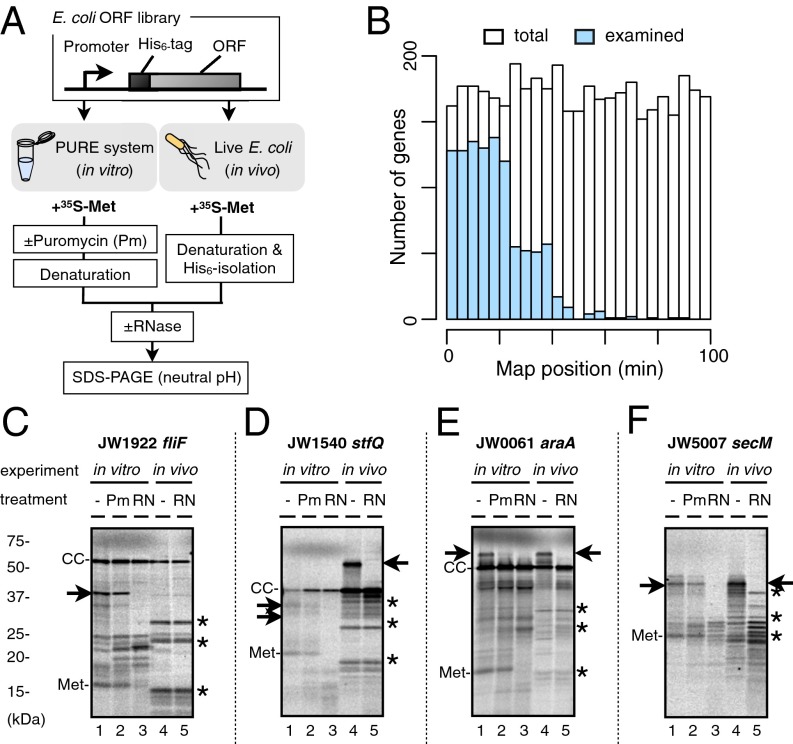
The results with SecA described above prompted us to undertake systematic profiling of the elongation of E. coli proteins expressed from the ASKA library clones, which also allow in vitro transcription–translation using a common primer for template preparation (33). The expression systems use the common promoters (the T7 promoter for in vitro expression and the T5 promoter-lac operator for in vivo expression) and the translation initiation region, from the SD sequence to the 17th codon, across different genes to ensure sufficient expression of all the target proteins. To handle multiple samples, we used RNase sensitivity to detect polypeptidyl–tRNA species. We improved electrophoretic resolution by using the WIDE-RANGE Gel system (Nacalai Tesque). To obtain integrated information on translation elongation, we carried out in vivo pulse-labeling and PURE (protein synthesis using recombinant elements) system in vitro translation (34) in parallel, using [35S]methionine for detection. The in vitro reaction system, consisting of the purified translation components, allowed us to follow translation in the absence of cellular-modulating elements. We include tests of puromycin sensitivity to decipher whether in vitro translation intermediates, if any, have been produced because of ribosomal dysfunction (35, 36). For in vivo analysis, we used the standard growth temperature of 37 °C and a brief induction time of the target gene to minimize artifacts of overproduction. We name this approach “in vivo/in vitro integrated nascent chain profiling” (iNP) (Figs. 1B and 2A).
Fig. 2.
Representative iNP patterns. (A) A schematic outline of the iNP procedures. The ASKA library genes are subjected to in vitro transcription–translation using the PURE system and in vivo pulse-labeling followed by His6-affinity isolation. Radioactive translation products, with and without treatment with RNase A, are separated by neutral pH SDS/PAGE. An electrophoretic band that disappears upon RNase treatment is taken to represent an event of translational pausing. In vitro, the puromycin sensitivity of the intermediates is examined also. (B) Distribution of the 1,038 genes examined in this study on the linkage map of the E. coli genome. The genes examined are shown in blue (n = 1,038), and whole E. coli genes are shown in white (0–100 min, n = 4,282). (C–F) iNP results of fliF (C), stfQ (D), araA (E), and secM (F). We chose these genes, which underwent a single pausing event, to avoid complications resulting from multiple pauses of different categories. In vitro translation products (lanes 1–3) and in vivo pulse-labeled products (lanes 4 and 5) were electrophoresed. Pm and RN indicate puromycin treatment and RNase A treatment, respectively. Polypeptidyl–tRNA is indicated by arrows. CC, translation-completed chain; Met, methionyl–tRNA; *, background signal.
An iNP Case Study of SecA Translation.
We applied the iNP procedures to characterize the pausing observed with SecA. In vivo experiments detected approximately four RNase-sensitive bands around the 25-kDa marker (Fig. 1B, lanes 4 and 5). In vitro translation also yielded four RNase-sensitive bands (Fig. 1B, lanes 1 vs. 4). They resisted puromycin (Fig. 1B, lane 2). Segment-specific frameshift mutations showed that the pausing required the SecA segment of amino acids 31–50 (the tag sequence was not counted) (Fig. 1C, Upper, lanes 3 and 7) but not its downstream region (Fig. 1C, Upper, lanes 5 and 9). Stop codon placement at the 41st secA codon, but not at the 46th codon, abolished the pausing (Fig. 1C, Lower). Thus, the pausing events depend on the amino acid, rather than on the nucleotide, sequence upstream of the 45th residue of SecA. Toeprint analysis of the in vitro translation complex detected that the stalled ribosome interfered with two major and two minor products of primer extension (Fig. 1D); this interference was abolished by the frame-shift mutation (FS31–50). The secA translating ribosome stalls when its A-site encounters the 43rd (pause 1), 44th (pause 2), 45th (pause 3), or 46th (pause 4) codon of secA (Fig. 1E). The discovery of the nascent polypeptide-dependent pausing in SecA translation demonstrated the effectiveness of the iNP approach in studying translation of E. coli genes.
Systematic iNP Analysis of E. coli Proteins Encoded by the First Quarter of the Genome.
We undertook systematic iNP analysis of E. coli proteins (Fig. 2A) by choosing, as an unbiased but tractable number of targets, the clones in plates 1–14 (JW0001–JW1750) (see Fig. 2B and Dataset S1 for details) of the ASKA library (www.shigen.nig.ac.jp/ecoli/strain/request/uponPublication.jsp), which are aligned largely according to the E. coli (W3110) linkage map (37). Among them, 1,038 genes gave translation products of expected sizes both in vitro and in vivo. In the autoradiographic images, common background bands were recognized, including the ∼18-kDa band of 35S-methionyl–tRNA in the in vitro samples (Met; Figs. 1B and 2 C–F) and in the three bands in the in vivo samples indicated in these figures by asterisks. Some representative single-site pausing patterns are presented in Fig. 2 C–F. Translation of SecM yielded almost exclusively an RNase-sensitive band both in vitro (Fig. 2F, lanes 1 and 2) and in vivo (Fig. 2F, lane 4). FliF translation yielded an RNase-sensitive and puromycin-resistant band in vitro (Fig. 2C, lanes 1 and 2, arrow) but not in vivo (Fig. 2C, lane 4). Conversely, StfQ produced an RNase-sensitive band in vivo (Fig. 2D, lanes 4 and 5) but not in vitro (Fig. 2D, lane 1). AraA produced an RNase-sensitive band both in vitro (Fig. 2E, lanes 1 and 2) and in vivo (Fig. 2E, lane 4).
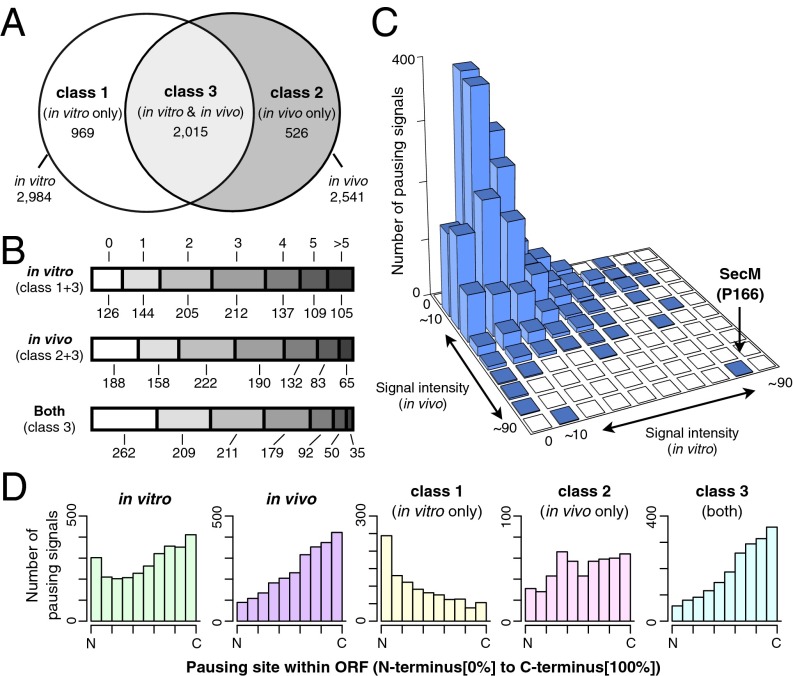
Assuming that an RNase-sensitive band represents a single event of translational pausing, we detected 2,984 pauses in vitro in 912 genes and 2,541 pauses in vivo in 850 genes (Fig. 3 A and B and Dataset S2). There were 969 in vitro-specific pauses (class 1 pausing), 526 in vivo-specific pauses (class 2 pausing), and 2,015 pauses that appeared to have occurred at the same sites both in vitro and in vivo (class 3 pausing, observed in 75% of the genes). The estimated total number of pausing events was 3,510 among the 1,038 genes examined. Only 71 genes proved to be translated without any pause. On average, each gene contains 2.87 in vitro pausing sites and 2.45 in vivo pausing sites (Fig. 3B). These results reveal that E. coli genes are indeed translated with frequent pausing events.
Fig. 3.
Overviews of translational pauses found in 1,038 E. coli ORFs by iNP. (A) Venn diagram representation of the occurrence of different pausing categories. Class 1 pausing occurs only in vitro, class 2 pausing occurs only in vivo, and class 3 pausing occurs under both conditions. The numbers indicate the occurrences of each class among the 1,038 genes examined in this study. (B) Classification of the ORFs by the numbers of pausing sites. The number of pausing events in a single gene is shown at the top (0, no pausing; 1, 2, 3, 4, 5 and >5 indicating numbers of occurrence). The numbers below each bar indicate the numbers of genes belonging to the corresponding categories. The aggregate numbers of occurrence in vitro, in vivo, and both in vitro and in vivo are 2,984, 2,541, and 2,015, respectively. (C) Distribution of the estimated pausing strengths in vitro and in vivo. Each pausing event was evaluated for the relative intensity of the polypeptidyl–tRNA signal. The results are shown in the in vitro–in vivo 2D histogram. The position of the major SecM pausing signal is indicated by an arrow. (D) Pausing site placement bias. The relative position of each pausing site within the ORF was scored as a value increasing from the N terminus to the C terminus (Materials and Methods). The distribution of the values for different classes of pausing is shown in the histograms.
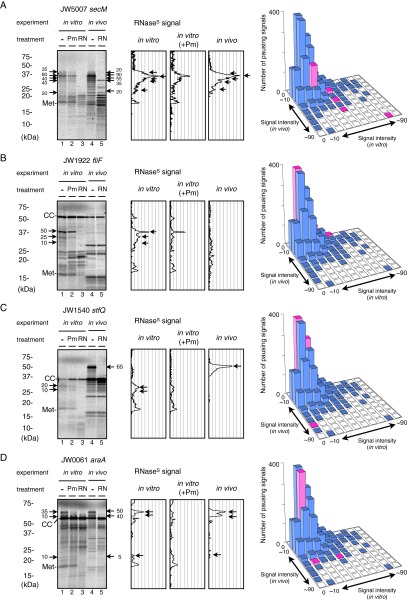
We quantified the intensity of RNase-sensitive materials as an indication of pausing strength, as described in Materials and Methods (Fig. S1 and Dataset S2). Fig. 3C shows a 2D histogram of the in vivo and in vitro pausing strengths. The pausing in SecM was the strongest in vitro and in vivo, although the in vivo value for SecM must have been overestimated for two reasons: (i) the arrest-released and exported SecM molecules are rapidly degraded in the periplasm (38), and (ii) the use of the N-terminal His6 tag precludes detection of the signal sequence-processed molecules that are expected to be generated upon release from the elongation arrested state (18, 39). The average pausing strength (%) was 17.0% in vitro and 16.7% in vivo, placing SecM, with an in vitro value of 90%, at the high end; a majority of the pausing events seem to be transient and weaker than the translation arrest of SecM. Although the sites of pausing show a wide overall distribution relative to the full-length coding regions, some distinct tendencies can be noted for the different classes of pausing (Fig. 3D). Class 1 pauses frequently occur at regions closer to the N-terminal ends. In contrast, class 3 pausing events frequently occur toward the C-terminal ends. Class 2 pausing occurs somewhat less frequently toward the N-terminal regions.
Fig. S1.
Examples of data evaluation. (A) secM. (B) fliF. (C) stfQ. (D) araA. (Left) Autoradiographic images after electrophoresis. Arrows indicate RNase-sensitive bands (for polypeptidyl–tRNA) whose intensity values (Materials and Methods) are given by numbers. (Center) The graphs show differential densitometry outputs for in vitro RNase-sensitive signals, RNase-sensitive signals after puromycin treatment (+Pm), and in vivo RNase-sensitive signals. (Right) The histograms show the distribution of in vitro and in vivo pauses of different strength. The positions of the pauses of the target gene are highlighted in magenta.
Puromycin Resistance of the in Vitro Pause Products.
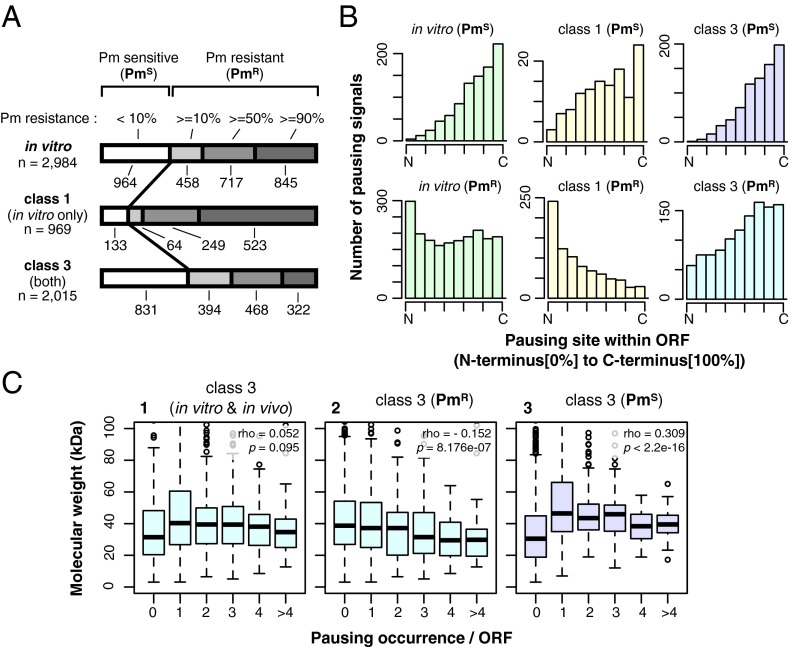
Puromycin resistance suggests that the ribosomal function somehow has been impaired, as shown for the elongation arrest by SecM (Fig. 2F) (35), whereas puromycin-sensitive polypeptidyl–tRNA could be produced upon a message truncation, limitation in the supply of an aminoacyl–tRNA, or other causes. Among the 2,984 pausing signals detected in vitro, 964 were highly sensitive to puromycin, with signal intensity decreasing to 10% or less. The remainder, collectively referred to as “puromycin-resistant pauses” (PmR), exhibited varying degrees of resistance (10% and more); these signals included those representing 86% of the class 1 pauses and 59% of the class 3 pauses (Fig. 4A), including the pausing observed with SecA (Fig. 1B). We note a tendency that the class 1 pauses show stronger resistance to puromycin than the class 3 pauses. Puromycin-sensitive pauses tend to occur more frequently toward the C-terminal regions (Fig. 4B), class 1 puromycin-resistant pauses are enriched toward the N termini, and the class 3 puromycin-resistant pauses are slightly enriched toward the C termini (Fig. 4B). Within the class 3 category, puromycin-resistant pauses show a weak and negative correlation with the molecular masses of the proteins (Fig. 4C), raising the possibility that they could be related to the folding of small proteins (40). Finally, it should be noted that an in vitro-specific, short, puromycin-resistant polypeptidyl–tRNA could arise from peptidyl–tRNA drop-off (Discussion).
Fig. 4.
In vitro pauses classified by puromycin resistance. (A) Translational pauses were classified by sensitivity to puromycin. PmS, less than 10% of signals remaining after puromycin treatment; PmR, 10% or more of signals remaining after puromycin treatment. Puromycin resistance is shown at the top: <10%; 10% or more but less than 50% (10%); 50% or more but less than 90% (≥50%); and ≥90%. The numbers below each bar indicate the number of pauses belonging to the corresponding categories. The horizontal bars show the proportions of PmS and PmR pauses in the total in vitro (class 1 and class 3) pausing events. (B) Pausing class-dependent bias in the pausing site placement. Relative positions of pausing sites within the ORFs are shown from the N terminus to the C terminus (Fig. 3D). Histograms of different classes of pausing are presented. (C) Boxplot representation of possible relationships between the occurrence of class 3 pausing and protein sizes. The total class 3 pausing events (graph 1), the PmR subpopulation (graph 2), and the PmS subpopulation (graph 3) were analyzed for the number of pausing occurrence vs. the molecular masses of the full-length polypeptides. Values of Spearman's rank correlation coefficient (ρ) and P value between molecular weight and pausing occurrence are given in each graph.
iNP Detection of Pausing That Is Mediated by Previously Proposed Determinants.
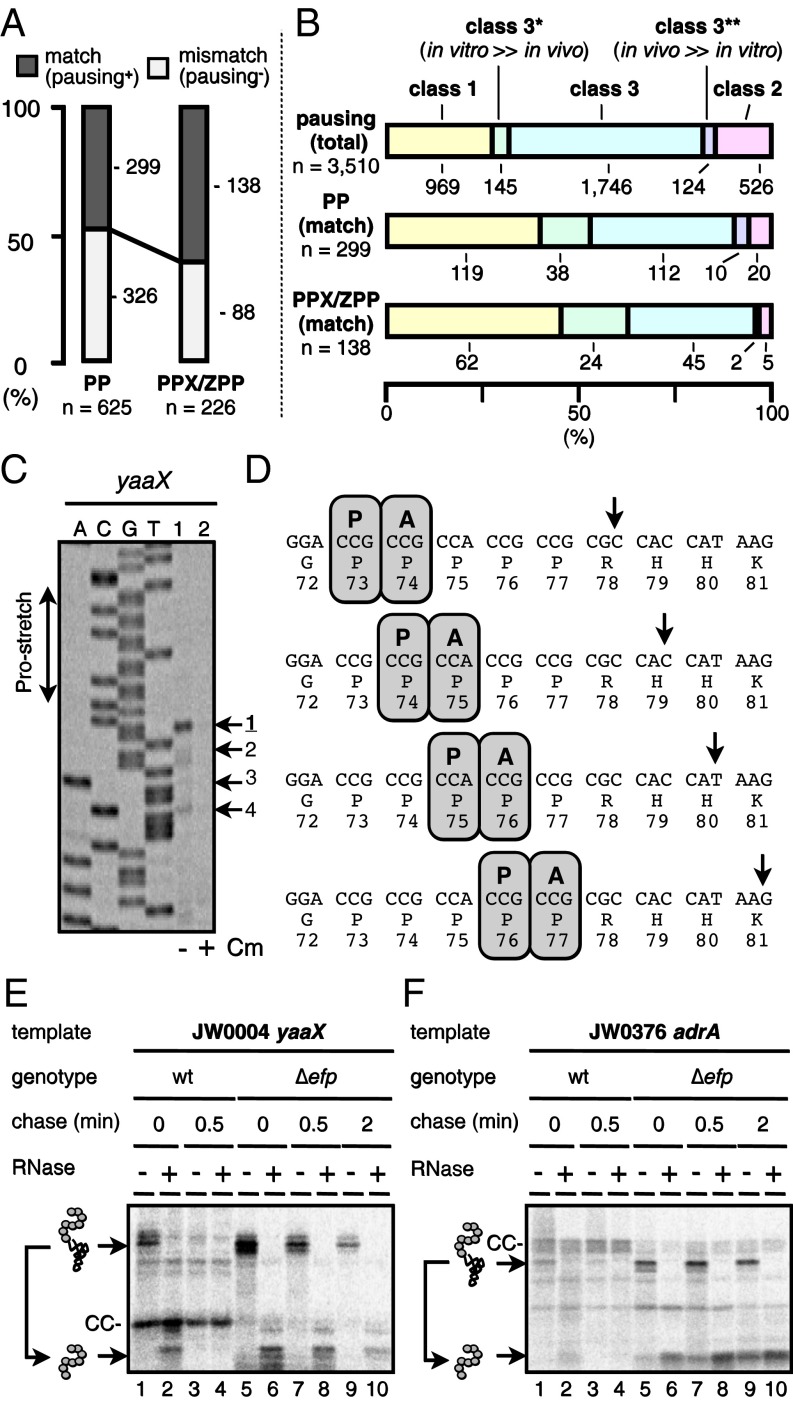
Consecutive proline residues serve as a major determinant of translational pausing (41). The 1,038 genes examined contained 625 Pro–Pro sequences, 226 of which were followed or preceded by an amino acid in the form PPX (X = P, W, N, D, E, or G) or ZPP (Z = A, D, or G) that were reported to cause strong translation arrest in the absence of EF-P (9, 42–44). We inspected whether pausing signals were observed near the PP, PPX, and ZPP motifs as judged from the estimated molecular masses of the nascent polypeptides detected in vivo (Materials and Methods). The 625 PP motifs and 226 PPX-ZPP motifs gave, respectively, 299 and 138 pausing signals that were likely caused by the prolines (Fig. 5A). Class 1 pauses and class 2 pauses are enriched and disfavored, respectively, in these signals, as is consistent with the facts that the PURE in vitro system did not contain EF-P, whereas the in vivo host was efp+. Class 3 pauses also occupied significant fractions (Fig. 5B). We validated translational pausing of yaaX, having a G72PPPPPR78-coding sequence, by toeprint analysis of the in vitro translation complex directed by this gene. The ribosome translating yaaX stalls strongly (44) when its P-site encounters the Pro73 or the Pro74 codon (Fig. 5 C and D). As expected, the in vivo pausing signals of yaaX (Fig. 5E) and adrA (Fig. 5F), having a PPP motif, were enhanced and stabilized in the ∆efp strain. These results illustrate the ability of the iNP method to detect translational pausing faithfully in vitro and in vivo.
Fig. 5.
Detection of proline-based pausing by iNP. (A) The occurrence of pausing around the 625 PP motifs and the 226 PPX/ZPP motifs in the 1,038 target genes. The existing PP and PPX/ZPP motifs were scored by whether they were (match) or were not (mismatch) accompanied by the accumulation of polypeptidyl–RNAs, whose estimated sizes can be accounted for by pausing therein (Materials and Methods). (B) Classification of the putative PP- and PPX/ZPP-mediated pausing events. The classification of the 299 PP-matched pausing events and the 138 PPX/ZPP-matched pausing events that were assigned as proline-mediated in A into the class 1, class 2, or class 3 (denoted “both”) categories is compared with the equivalent classification of the 3,510 total pausing events. In addition, distributions into subclasses of class 3 are included: class 3*, normalized polypeptidyl–tRNA intensity higher in vitro than in vivo by a factor of 3 or more; class 3**, normalized polypeptidyl–tRNA intensity higher in vivo than in vitro by a factor of 3 or more. (C) Toeprint confirmation of ribosome stalling on yaaX. PURE system translation complexes directed by the yaaX template in the absence (lane 1) or presence (lane 2) of chloramphenicol were subjected to the toeprint assay. Dideoxy sequencing products of yaaX are shown in lanes A, C, G, and T. (D) Schematic illustration of ribosome pausing on the yaaX mRNA. (E and F) Effects of the ∆efp mutation on translation pausing observed with yaaX and adrA. ASKA library clones of yaaX (E) and adrA (F) were expressed in the original host (efp+: lanes 1–4) and in its ∆efp derivative (lanes 5–10). Cells were pulse-labeled with [35S]methionine for 0.5 min and then were chased with unlabeled methionine for the indicated periods (0, 0.5, or 2 min). Samples were processed by the in vivo iNP procedures.
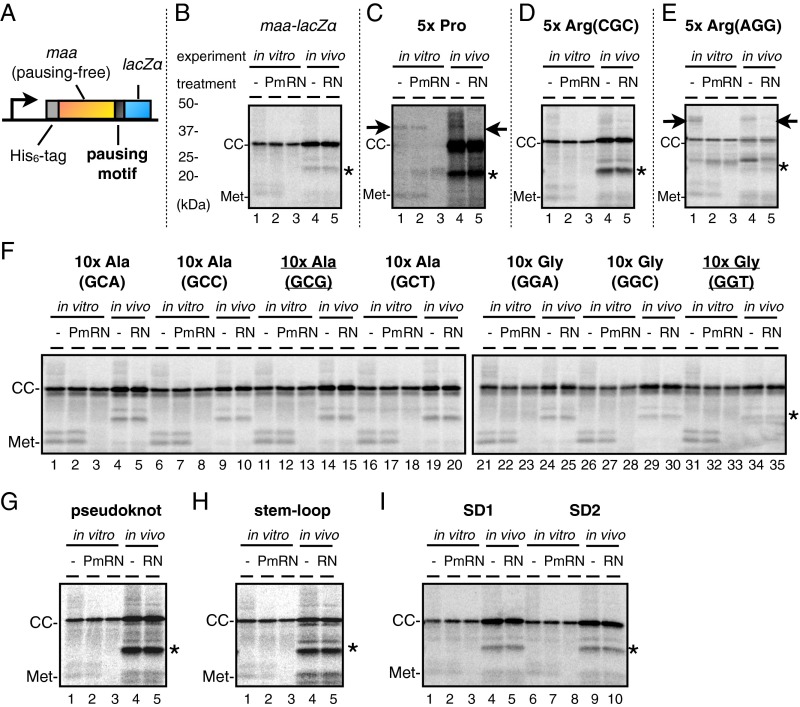
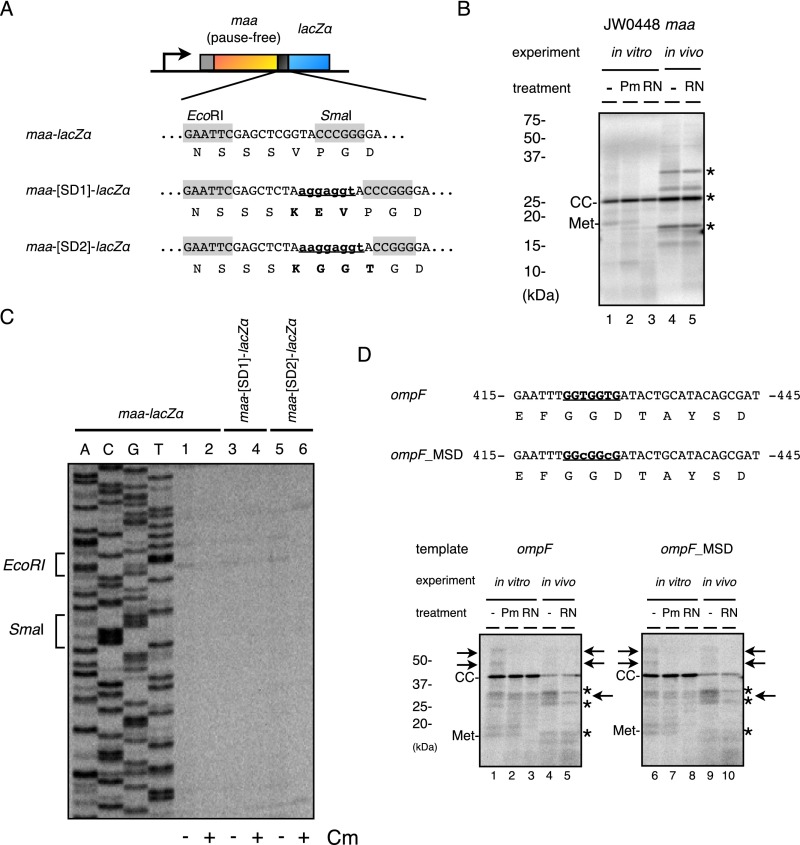
We also used a model system to examine the pausing propensity of short sequences of either nucleotides or amino acids that have been proposed to attenuate translation. We placed the sequences to be examined between the gene maa sequence (on the N-terminal side) and the LacZα sequence (on the C-terminal side) (Fig. S2A). Translation of maa was pausing-free (Figs. S2A and S3B), as was the Maa-LacZα fusion protein (Fig. S2B). Its derivative, having five consecutive prolines in the junction, produced a puromycin-resistant polypeptidyl–tRNA species in vitro but not in vivo (in the presence of EF-P) (Fig. S2C). We next placed five CGC arginine codons in the junction to examine the effects of a positive charge cluster, a known pausing element in the eukaryotic systems (45–47), without a significant accumulation of polypeptidyl–tRNAs (Fig. S2D). In contrast, a rare codon cluster composed of five AGG Arg codons (48) did cause significant pausing (Fig. S2E), which was puromycin-sensitive in vitro. The placement of neither 10 consecutive wobble-decoded codons (GCG and GGT) (Fig. S2F), nor the pseudoknot- or stem–loop-forming sequences (5) (Fig. S2 G and H) led to an appreciable accumulation of polypeptidyl–tRNAs. Finally, we placed an internal SD-like sequence but failed to detect any accumulation of a polypeptidyl–tRNA species in vitro or in vivo (Figs. S2I and S3). We did not detect any translation inhibitor-sensitive toeprint signal that can be ascribed to the inserted SD-like sequence (Fig. S3C). We further examined the reported SD sequence-dependent translational pausing in the ompF gene (6) using the iNP method. The SD-disrupting mutation of ompF (6) did not affect the in vitro or the in vivo iNP results appreciably (Fig. S3D). The in vitro results are consistent with a recent report that dismisses the elongation-delaying effects of SD-like sequences (2). The in vivo results also are in line with the recently published discussion on this subject (13, 30, 42, 49). Taken together, the iNP method appears to be suitable for detecting translational pausing that is robust enough to lead to the accumulation of distinct polypeptidyl–tRNA species (see Discussion for further comparisons of the iNP and the ribosome-profiling results).
Fig. S2.
iNP reports of model constructs. (A) Schematic illustration of an maa-lacZα model construct. A sequence to be examined for its ability to induce translational pausing was inserted between the N-terminally His6-tagged maa ORF and the in-frame fused lacZα ORF. Maa itself does not undergo any detectable translational pause in vitro or in vivo. (B–I) iNP analysis of maa-lacZα and its variants. Polypeptidyl–tRNAs are indicated by arrows. CC, translation-completed SecA (completed chain); Met, methionyl–tRNA; *, background signal. (B) maa-lacZα without insert. (C) Pro codons (5×) inserted into the Maa-LacZα boundary. (D) Arg (CGC) codons (5×) inserted. (E) Arg (AGG) codons (5×) inserted. (F) Ala (GCX) codons (10×) and Gly (GGX except for GGG) codons (10×), as indicated, inserted. (G) A pseudoknot-forming sequence, GGCGCGCGCGCAGCGCGCGCGCAATCCACGCCACGTGCGCGCGCGCTGCGCGCGCGCCGTGGC (5), inserted. (H) A stem–loop–forming sequence, GGCGCGCGCGCAGCGCGCGCGCAATCCACTGCGCGCGCGCTGCGCGCGCGC (5), inserted. (I) an SD-like sequence inserted in different contexts, SD1 and SD2 (see Fig. S3 for the inserted nucleotide sequences).
Fig. S3.
SD sequences do not induce translational pausing detectable by iNP. (A) Schematic illustration of the maa-lacZα fusion gene and nucleotide and amino acid sequences of the junction region (the first sequence). An SD sequence (AGGAGGT) was inserted in two different contexts to construct maa-[SD1]-lacZα and maa-[SD2]-lacZα (the second and third sequences). SD2 contained an extra A on the 5′ side of AGGAGGT with compensating deletion of C on the 3′ side to maintain the reading frame. (B) Pause-free translation of maa. Translation of His6-Maa was subjected to iNP analysis. Only the translation-completed chain (CC) was produced in vitro and in vivo. Met, methionyl–tRNA. (C) Toeprint analysis of maa-lacZα and its variants with the SD1 and SD2 insertions. Reaction mixtures of coupled in vitro transcription–translation directed by the indicated templates in the presence and the absence of chloramphenicol, as indicated, were subjected to toeprint analysis. Dideoxy sequencing products of maa-lacZα are shown in lanes A, C, G, and T. (D) A mutational disruption of an internal SD sequence does not affect translation pausing of ompF. An internal SD-like sequence in His6-OmpF (the first nucleotide sequence underlined) was synonymously mutated to construct His6-OmpF_MSD (the second nucleotide sequence underlined) according to a previous publication showing that a ribosomal occupancy peak in the ribosome profiling data was decreased by the mutation (6). Both constructs were subjected to iNP analysis. Although a few RNase-sensitive bands were observed (arrows), they were not affected by the MSD mutation.
Translational Pausing in the Biogenesis of Membrane Proteins.
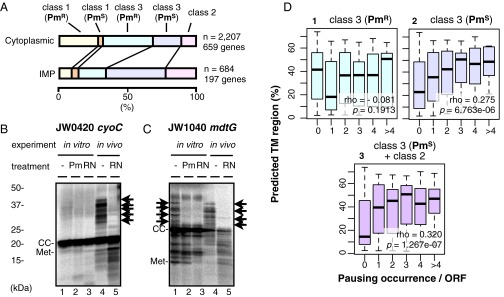
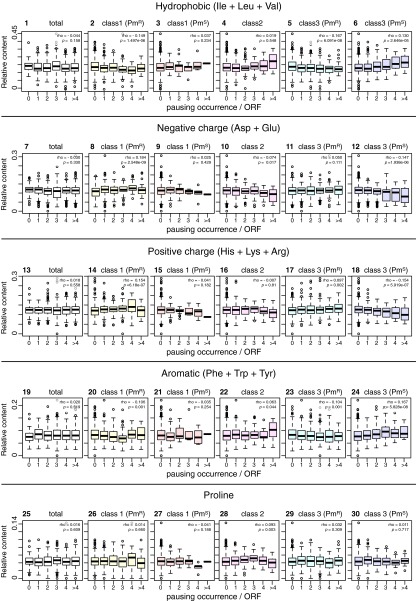
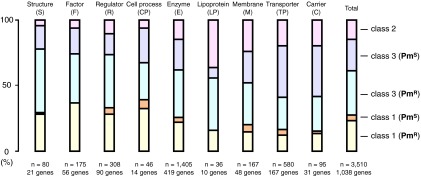
We examined statistically whether the biosynthesis of proteins of different subcellular localizations involves different classes of pausing (Figs. 6 and 7). Examinations of the amino acid composition of the translation products in relation to the number of pausing events (Fig. S4) indicate that multiple class 2 or class 3 puromycin-sensitive pauses are preferred by proteins with higher contents of hydrophobic amino acids (Fig. S4, graphs 4 and 6) and aromatic amino acids (Fig. S4, graphs 22 and 24) but are relatively disfavored by proteins rich in polar amino acids (Fig. S4, graphs 10, 12, 16, and 18). The data analysis shown in Fig. 6 indicates that the inner membrane proteins (identified as “IMP” in Fig. 6A and as “membrane”, “transporter,” and “carrier” in Fig. S5) prefer class 2 (in vivo-only) and class 3 (in vivo and in vitro) pausing over class 1 (in vitro-only) pausing, in comparison with the cytosolic proteins (identified as “cytoplasmic” in Fig. 6A and as “regulator,” “factor,” “cell process,” and “enzyme” in Fig. S5). Within the class 3 pausing categories, puromycin-sensitive pausing appears to be preferred by the membrane proteins, whereas puromycin-resistant class of pausing appears to be preferred by the cytosolic proteins. It is notable that some membrane proteins undergo strong class 2 or class 3 pausing at multiple sites; examples are presented in Fig. 6 B and C. Transmembrane (TM) abundance values (as a proportion of the number of TM amino acid residues in the protein) exhibited some positive correlation with the occurrence of class 3 puromycin-sensitive pauses and with a combination of class 3 puromycin-sensitive pauses and class 2 pauses but with not the puromycin-resistant subclass (Fig. 6D). These results suggest that the translation of cytosolic proteins and that of membrane proteins are subject to different mechanisms of elongation modulation.
Fig. 6.
Translational pausing in membrane protein biogenesis. (A) Cytosolic and membrane proteins differ in their likelihood of undergoing different categories of pausing. Distributions of the 2,207 pauses observed with the 659 cytosolic proteins examined and the 684 pauses in the 197 integral inner membrane proteins (IMPs) examined are shown as 100% stacked column charts. (B) CyoC translation undergoes in vivo-only multiple pausing as indicated by arrows. (C) MdtG translation undergoes multiple in vitro puromycine-sensitive pausing and multiple in vivo pausing, as indicated by arrows. (D) Multiple occurrences of class 3 puromycin-sensitive pausing and class 2 pausing correlate with the presence of multiple TM regions. A focus is placed on class 3 and class 2 pausing events that predominate in the membrane proteins. Class 3 pauses are classified further into puromycin-resistant and puromycin-sensitive pauses. The proportions of TM amino acid residues in the full-length polypeptides are box-plotted against the number of the pausing occurrences per single polypeptides. The Spearman's rank correlation coefficient (ρ) and P value are given in each graph.
Fig. 7.
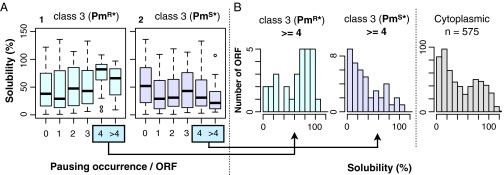
Correlations between pausing occurrence and solubility of cytosolic proteins. (A) Box plot representation. Solubility values (50) are box-plotted against the number of occurrences of puromycin-resistant (Left) and puromycin-sensitive (Right) class 3 pauses per single polypeptide. (B) Positive correlation between class 3 puromycin-resistant pauses and solubility of the completed chains. Proteins undergoing four or more class 3 PmR* pauses (Left) or class 3 PmS* pauses (Center) were classified according to the solubility scores (50), and their histograms are presented. (Right) Solubility histogram of the 575 cytosolic proteins examined by iNP.
Fig. S4.
Translational pausing and amino acid contents of proteins. The number of occurrences, per single polypeptide, of each class of pausing events is box-plotted against the contents of grouped amino acids: graphs 1–6, hydrophobic amino acids; graphs 7–12, negatively charged amino acids; graphs 13–18, positively charged amino acids; graphs 19–24, aromatic amino acids; graphs 25–30, proline. Total occurrences of pausing are shown in graphs 1, 7, 13, 19, and 25. Class 1 puromycin-resistant occurrences are shown in graphs 2, 8, 14, 20, and 26. Class 1 puromycin-sensitive occurrences are shown in graphs 3, 9, 15, 21, and 27. Class 2 occurrences are shown in graphs 4, 10, 16, 22, and 28. Class 3 puromycin-resistant occurrences are shown in graphs 5, 11, 17, 23, and 29. Class 3 puromycin-sensitive occurrences are shown in graphs 6, 12, 18, 24, and 30. The values of Spearman's rank correlation coefficient (ρ) and P value are given in each graph.
Fig. S5.
Correlation between the modes of translational pausing and protein function. Proteins functionally assigned as structure (S; 80 pausing sites in 21 genes), factor (F; 175 sites in 56 genes), regulator (R; 308 sites in 90 genes), cell process (CP; 46 sites in 14 genes), enzyme (E; 1,405 sites in 419 genes), lipoprotein (LP; 36 sites in 10 genes), membrane (M; 167 sites in 48 genes), transporter (TP; 580 sites in 167 genes), and carrier (C; 95 sites in 31 genes) and total data evaluated in this study (3,510 sites in 1,038 genes) were analyzed for the occurrence of different classes of pausing as shown in the 100% stacked column charts.
Translational Pausing in the Biogenesis of Cytosolic Proteins.
We examined whether the pauses observed with cytosolic proteins correlate with the published information on the aggregation propensity of E. coli proteins translated in vitro in the absence of molecular chaperones (50). The E. coli proteins in general (50) and those analyzed here (Fig. 7B) exhibit bimodal solubility distributions. In contrast, proteins undergoing class 3 pauses and those undergoing multiple (four or more) and strong puromycin-resistant pauses (PmR*; resistance ≥50%) tend to have higher solubility (Fig. 7). The subclass that exhibited multiple puromycin-resistant, class 3 pausing included a larger proportion of proteins that formed the higher solubility peak [solubility(class 3 PmR* pauses ≥4) against solubility(cytoplasmic): P = 0.004995; Welch's t test] (Fig. 7B). In contrast, the proteins with puromycin-sensitive pausing did not form the high solubility peak [solubility(class 3 PmS* pauses ≥4) against solubility(cytoplasmic): P = 0.1418]. These results raise an intriguing possibility that a class of translational pausing is related to facilitated spontaneous folding of some proteins (50, 51).
Discussion
We profiled translation elongation of the E. coli proteome members by directly detecting the intermediates, polypeptidyl–tRNAs, and showed that translation indeed proceeds with a high incidence of pausing. Importantly, the iNP procedures examine in vitro and in vivo translation in parallel to illuminate translation as an elementary process carried out by the basic translation machinery (in vitro) as well as to profile translation orchestrated with cellular factors (in vivo). Among the 1,038 E. coli genes examined, as many as ∼88% and 82% are translated with one or more events of pausing in vitro and in vivo, respectively, leaving only 71 genes without any pausing detectable by iNP. SecM exhibited the strongest translation arrest in vitro and in the sec+ cell, although the strength of the arrest in vivo may have been overestimated (Results). We can safely conclude that a majority of the pausing events we detected were much weaker than the robust arrest of SecM in the Sec-pathway–compromised cells. Our approach will complement higher throughput and higher resolution analyses (21, 27), which nevertheless could be indirect (see the Introduction).
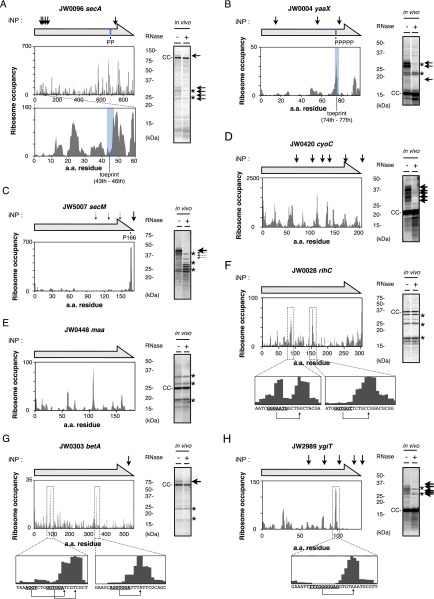
We note that global comparison of our data with those of the ribosome-profiling experiments is difficult at this stage because of the limited positional resolution inherent in the iNP approach and the low expression levels of a number of genes in the ribosome-profiling experiments (6). Nevertheless, we selected several genes to compare their iNP and the ribosome-profiling results individually (Fig. S6). Within the limited number of genes examined, possible correlations between the two methodologies were notable only for the pause in secM (Fig. S6C), the proline-related pause in yaaX (Fig. S6B), and the multisite pauses in cyoC (Fig. S6D). Remarkably, none of the ribosome-profiling peaks that could be ascribed to an internal SD-like sequence proved to have a corresponding peak of polypeptidyl–tRNA in the iNP data (Fig. S6 F–H). The transient pausing we detected still may be stronger than the local slowing down of translation caused by internal SD sequences, the major pausing determinants that ribosome-profiling experiments had suggested in E. coli (6). It seems that SD-mediated translation attenuation, if any, is too weak (2) or unfocused (26) to be detectable by the iNP procedures. Alternatively, the increased stability of the mRNA-ribosome complexes against nuclease digestion could account for the ribosome profiling read-outs near the SD-like sequences (49).
Fig. S6.
Comparison of representative iNP and ribosome-profiling (RP) data. Comparison of the iNP data with the published RP data (6) is not straightforward because the iNP data do not have nucleotide-level resolution for the pausing positions. Therefore, we attempted to compare individual genes by manually inspecting whether the RP and iNP patterns are similar. Results are shown for secA (A), yaaX (B), secM (C), cyoC (D), maa (E), rihC (F), betA (G), and ygiT (H). We also examined the data for fliF, stfQ, araA, mdtG, and adrA, but the ribosome profiling read numbers were too low to show peaks of translational pausing events unequivocally. (A–D) First, we selected the genes (secA, fliF, stfQ, araA, mdtG, cyoC, adrA, and yaaX) whose in vivo iNP gel data are presented here. In iNP, different genes are translated at similar levels, enabling us to detect nascent chains of nearly all the target proteins by pulse-labeling. In contrast, RP data with low read-outs are not informative about the occurrence of pausing (6); in these cases, comparison was not possible. The expression levels of genes other than secA, cyoC, and yaaX proved insufficient to allow reliable RP analysis. (A) In the case of secA, the RP and the iNP data were very different, in that the former has many more peaks of ribosomal occupancies, rendering the comparison impractical. (B) In the case of yaaX, the proline-based stalling shows up as a major peak, which is followed by the second peak in both data. (C) secM shows a major stalling peak in both experiments. One conceivable scenario is that strong pauses can be captured by both approaches. (D) In the case of cyoC, both experiments showed multiple peaks of similar numbers, although it is unclear at this stage whether they correspond mutually. (E and F) Next, we examined genes maa (E) and rihC (F), which exhibited no appreciable pauses in iNP. In contrast, they exhibited a number of RP peaks. The two major peaks in the rihC data apparently were caused by internal SD-like sequences shown in bold face in the Insets. Thus, in these cases the two methods gave very different results. (G and H) Finally, we picked up genes betA (G) and ygiT (H), which exhibited marked RP peaks following internal SD-like sequences shown in boldface in the Insets. Again, the RP peaks were not accompanied by corresponding iNP signals. Procedures: In each panel, the top horizontal arrow shows the primary structure of the protein, and the small vertical arrows show the positions, estimated on the basis of electrophoretic mobilities, of translational pauses detected by the iNP experiments. The ribosome occupancy distribution along each gene was obtained from Gene Expression Omnibus accession numbers GSE35641 and GSM872393 (6), with the aid of the Genome Wide Information on Protein Synthesis (GWIPS)-viz Browser (gwips.ucc.ie) (66). In all panels, the iNP in vivo gel pattern is shown on the right. Positions of pauses determined by toeprint experiments are indicated by a blue shadow in the graphs, when applicable.
In contrast, an array of a rare AGG codon did lead to significant translational pausing in vivo and in vitro, although trans-translation (52) may have acted to unmask the effect in vivo. Although the use of standardized transcription and translation initiation strengths across different genes was inevitable at this stage of analysis, it remains to be investigated whether initiation frequency affects pause strength. A majority of the in vitro pausing intermediates resisted puromycin, pointing to the involvement of specific mechanisms that led to ribosomal dysfunction. We have shown that the newly discovered pausing in SecA translation is determined by a specific amino acid sequence of the nascent SecA chain. We anticipate the widespread occurrence of nascent polypeptide-mediated pausing.
Our integrated in vivo and in vitro approach revealed the occurrence of distinct classes of pausing. In vitro-only (class 1) pausing can be explained by assuming that some factor that overcomes pausing is operative in the cell. A known example is EF-P, which overcomes polyproline-mediated translational pausing, as confirmed here by our iNP approach. Also, a pausing-release mechanism, conceptually similar to the one known for the arrest release of SecM, could be responsible. It should be noted, however, that peptidyl–tRNA drop-off (53) also could explain some of the class 1 events. In such cases polypeptidyl–tRNAs already have been dissociated from the translation machinery and, hence, do not react with puromycin. In vivo, their tRNA moieties will be removed by the cytosolic peptidyl–tRNA hydrolase (54), preventing their detection by iNP. Incidentally, we note a tendency for class 1 events to take place preferentially at the N-terminal regions. Peptidyl–tRNA drop-off typically occurs very early in translation (55).
In vivo-only (class 2) pausing may require some pausing-enhancing factors in the cell, a known example being the signal recognition particle (SRP) in eukaryotic cells (56). It is of prime interest to identify any such factors in E. coli and to elucidate the mechanisms of action and physiological roles. Interestingly, we found that class 3 pausing frequently occurs at C-terminal regions. The puromycin-resistant subclass has a tendency to occur in small proteins. An intriguing possibility might be that such a class of pausing gives single-domain proteins time to fold cotranslationally (40), although the same may hold for domain-wise folding of larger proteins.
Our statistical analyses suggest that membrane proteins and cytosolic proteins have different probabilities of undergoing different types of pausing. Membrane proteins prefer class 2 or class 3 puromycin-sensitive pausing. Such pauses could facilitate an integration of hydrophobic segments into the lipid bilayer. It was proposed recently that internal SD-like nucleotide sequences are strategically placed within the E. coli membrane protein-coding sequences to pause translation and thereby facilitate cotranslational recognition of the membrane integration signals by SRP (57). However, given our failure to recapitulate SD-mediated translational pausing, we assume that the pausing events we observed for membrane proteins are unrelated to the pausing elements proposed by Fluman et al. (57). The multiple occurrences of the TM segments correlate, albeit weakly, with the occurrence of class 3 puromycin-sensitive pauses and class 2 pauses. Further in-depth studies will be required to elucidate whether such combinations of pauses have any role in the formation of the correct arrangements of TM segments. In cytosolic proteins the occurrence of puromycin-resistant pausing correlates with the high solubility indexes previously determined for E. coli proteins. These pauses may coordinate spontaneous folding during translation.
However, any correlation between a particular class of proteins and a single mechanism of pausing is not overwhelmingly strong. This weak correlation seems to suggest that multiple mechanisms of pausing are actually used in combination. This notion seems reasonable because pausing determinants must be compatible with the functional structures of the final protein, so that different proteins must rely on different compatibility principles. Our experiments at this stage use individually cloned ASKA library genes. The use of a brief induction makes it unlikely that translation features have been altered artificially by overproduction (Results). However, we anticipate that, to study translation of multisubunit proteins, it may be necessary to coexpress multiple cistrons in the cis configuration (58). SecA is physiologically translated from secM-secA mRNA, in which the upstream secM could affect the folding behavior of the nascent SecA chain (59); therefore it may be necessary to express secA in the presence of cis-expressed secM to study the secA translational pausing further. Intramolecular interplays also should be addressed, because nascent chain folding can affect translation processes (17). The present study shows that we have only started to gain precise knowledge about how individual proteins are translated with temporal fine-tuning.
Materials and Methods
E. coli Strains, Plasmids, and Primers.
The E. coli strains, plasmids, and primers used in this study are listed in Tables S1–S3, respectively. The ASKA gene library on a vector pCA24N (33) was obtained from National Institute of Genetics (NIG), Japan. To construct pCY735, a DNA fragment amplified by PCR from a template pTWV228 using primers PE12 and PE13 and a DNA fragment amplified from pCA24N-maa using primers PE14 and PE15 were assembled by Gibson assembly (60). pCY718 and pCY722 were constructed by site-directed mutagenesis (61) using pCA24N-secA as a template and mutagenic primers PE04 and PE01, respectively. pCY719 and pCY720 were constructed by site-directed mutagenesis using pCY718 as a template and mutagenic primers PE02 and PE05, respectively. pCY724 and pCY725 were constructed by site-directed mutagenesis using pCY722 as a template and mutagenic primers PE04 and PE03, respectively. pCY741 was constructed by cloning a duplex of PE22 and PE23 into KpnI-SphI–digested pCY735. pCY864 was constructed by cloning a duplex of PE24 and PE25 into KpnI-SphI–digested pCY735. Other plasmids were constructed by single or two oligonucleotides-based site-directed mutagenesis using the mutagenic primer(s) listed in Table S3 and the appropriate parental plasmid as the template for mutagenic PCR.
Table S1.
Bacterial strains
| Strain | Genotype | Source or reference |
| MG1655 | F−, λ−, ilvG−, rfb-50, rph-1 | Laboratory stock |
| AG1 | endA1, recA1, gyrA96, thi-1, relA1, glnV44, hsdR17(rK− mK+) | Laboratory stock |
| BW25113 | ∆(araD-araB)567, ∆lacZ4787(::rrnB-3), λ−, rph-1, ∆(rhaD-rhaB)568, hsdR514 | Laboratory stock |
| JW4107 | BW25113 ∆efp::FRT-KmR-FRT | (63) |
Table S3.
Primers
| Primer | Nucleotide sequence |
| Primer 1 | GGCCTAATACGACTCACTATAGGAGAAATCATAAAAAATTTATTTGCTTTGTGAGCGG |
| Primer 3 | AGTCAGTCACGATGAATTCCCCTAGCTTGG |
| pe-lacZ-N-rv | AACGACGGCCAGTGAATCCGTAATCATGGT |
| ASKA-tp Stop+10 | AACGACGGCCAGTGAATCCGTAATCATGGTAGCTAATTAAGCTTGGCTGC |
| tp_pCY735stop+_rv | AACGACGGCCAGTGAATCCGTAATCATGGTTTAATGTGCTGCAAGGCGATTAAG |
| tp-secA212-rv | AACGACGGCCAGTGAATCCGTAATCATGGTGCGCTTACTTGCCTCACGTA |
| PE01 | CATCATCAATGCCAATGGAACCGGAGATGG |
| PE02 | AAACCGCAGAGTTTACGTGCACGTCTGGAA |
| PE03 | GAAAACCGCAGAGTTCGTGCACGTCTGGAA |
| PE04 | GCTGGAAAATCTGTCCCGGAAGCTTTCGCC |
| PE05 | ACGCTGCATCGCCGAAAATGCGTACCGGTG |
| PE06 | ATCATCAATGCCTAGGAACCGGAGATGGAA |
| PE07 | GAACCGGAGATGTAGAAACTCTCCGACGAA |
| PE08 | AAACTCTCCGACTAGGAACTGAAAGGGAAA |
| PE09 | GAACTGAAAGGGTAGACCGCAGAGTTTCGT |
| PE10 | ACCGCAGAGTTTTAGGCACGTCTGGAAAAA |
| PE11 | CCAGAATTTGGCGGCGATACTGCATACAGC |
| PE12 | CGGCCGCTACACCATGATTACGAATTCGAG |
| PE13 | ATCAACAGGAGTCCAAGCTCTTAATGCGCCGCTACAGGG |
| PE14 | GAGCTTGGACTCCTGTTGATAGATCCAGTA |
| PE15 | CGTAATCATGGTGTAGCGGCCGCATAGGCC |
| PE16 | ATTCGAGCTCGGTACCTCCACCTCCACCCGAGTCGACCTGCAGGC |
| PE17 | ATTCGAGCTCGGTACGCCGCCGCCGCCGCGAGTCGACCTGCAGGC |
| PE18 | ATTCGAGCTCGGTAAGGAGGAGGAGGAGGGAGTCGACCTGCAGGC |
| PE19 | ACCGAGCTCGAATTCGTAATCATGGTGTAG |
| PE20 | GAATTCGAGCTCTAAGGAGGTACCCGGGGA |
| PE21 | ATTCGAGCTCTAAAGGAGGTACCGGGGATCCTCTA |
| PE22 | CGGCGCGCGCGCAGCGCGCGCGCAATCCACGCCACGTGCGCGCGCGCTGCGCGCGCGCCGTGGCGCATG |
| PE23 | CGCCACGGCGCGCGCGCAGCGCGCGCGCACGTGGCGTGGATTGCGCGCGCGCTGCGCGCGCGCCGGTAC |
| PE24 | CGGCGCGCGCGCAGCGCGCGCGCAATCCACTGCGCGCGCGCTGCGCGCGCGCGCATG |
| PE25 | CGCGCGCGCGCAGCGCGCGCGCAGTGGATTGCGCGCGCGCTGCGCGCGCGCCGGTAC |
| PE26 | ATTCGAGCTCGGTAGCAGCAGCAGCAGCAGCAGCAGCAGCAGCAGAGTCGACCTGCAGGC |
| PE27 | ATTCGAGCTCGGTAGCCGCCGCCGCCGCCGCCGCCGCCGCCGCCGAGTCGACCTGCAGGC |
| PE28 | ATTCGAGCTCGGTAGCGGCGGCGGCGGCGGCGGCGGCGGCGGCGGAGTCGACCTGCAGGC |
| PE29 | ATTCGAGCTCGGTAGCTGCTGCTGCTGCTGCTGCTGCTGCTGCTGAGTCGACCTGCAGGC |
| PE30 | ATTCGAGCTCGGTAGGAGGAGGAGGAGGAGGAGGAGGAGGAGGAGAGTCGACCTGCAGGC |
| PE31 | ATTCGAGCTCGGTAGGCGGCGGCGGCGGCGGCGGCGGCGGCGGCGAGTCGACCTGCAGGC |
| PE32 | ATTCGAGCTCGGTAGGTGGTGGTGGTGGTGGTGGTGGTGGTGGTGAGTCGACCTGCAGGC |
Table S2.
Plasmids
| Plasmid | Relevant features | Construction primer(s) | Source or reference |
| pTWV228 | bla, ColE1, lacZα | Takara | |
| ASKA library | Collection of pCA24N carrying E. coli ORFs | (33) | |
| pCA24N-secA | |||
| pCY718 | secA (del191A) | PE04 | This study |
| pCY719 | secA (150_151insA, del191A: FS51-64) | PE02, PE04 | This study |
| pCY720 | secA (del191A, 300_301insA: FS64-100) | PE04, PE05 | This study |
| pCY722 | secA (90_91insA) | PE01 | This study |
| pCY724 | secA (90_91insA, del191A: FS31-64) | PE01, PE04 | This study |
| pCY725 | secA (90_91insA, del151T: FS31-50) | PE01, PE03 | This study |
| pCY726 | secA A30_M31insX | PE06 | This study |
| pCY727 | secA M35_E36insX | PE07 | This study |
| pCY728 | secA D40_E41insX | PE08 | This study |
| pCY729 | secA G45_K46insX | PE09 | This study |
| pCY730 | secA F50_R51insX | PE10 | This study |
| pCA24N-ompF | (33) | ||
| pCY777 | ompF_MSD (424T > C 427T > C) | PE11 | This study |
| pCA24N-maa | (33) | ||
| pCY735 | pCA24N-maa-lacZα | This study | |
| pCY736 | maa-5x Pro-lacZα | PE16, PE19 | This study |
| pCY737 | maa-5x Arg (CGC)-lacZα | PE17, PE19 | This study |
| pCY738 | maa-5x Arg (AGG)-lacZα | PE18, PE19 | This study |
| pCY739 | maa-SD1-lacZα | PE20 | This study |
| pCY740 | maa-SD2-lacZα | PE21 | This study |
| pCY741 | maa-pseudoknot(22-6a)-lacZα | This study | |
| pCY819 | maa-10x Ala (GCT)-lacZα | PE19, PE29 | This study |
| pCY824 | maa-10x Gly (GGT)-lacZα | PE19, PE32 | This study |
| pCY841 | maa-10x Ala (GCA)-lacZα | PE19, PE26 | This study |
| pCY842 | maa-10x Ala (GCC)-lacZα | PE19, PE27 | This study |
| pCY843 | maa-10x Ala (GCG)-lacZα | PE19, PE28 | This study |
| pCY864 | maa-stem-loop-lacZα | This study | |
| pCY880 | maa-10x Gly (GGA)-lacZα | PE19, PE30 | This study |
| pCY881 | maa-10x Gly (GGC)-lacZα | PE19, PE31 | This study |
iNP.
Quality check of the ASKA library genes of E. coli and preparation of templates for in vitro transcription–translation.
Derivatives of the E. coli AG1 strain harboring each of the ASKA library clones were obtained from the National Institute of Genetics (NIG), Japan. In vivo expression of each gene was directed by the T5 promoter-lac operator for transcription and the common sequence from the SD element to the 17th codon for translation. Cells were inoculated into LB supplemented with 20 µg/mL of chloramphenicol. After overnight culture, plasmids were purified individually using the QIAprep Spin Miniprep Kit (Qiagen). DNA templates for in vitro transcription/translation were individually amplified by PCR using the common primers, primer 1 and primer 3, which attached the T7 promoter to the 5′ site. We examined the 96-well plates numbered 1–14 distributed from NIG and successfully recovered the 1,038 genes that are listed in Dataset S1 along with the dataset of translational pauses obtained in this study.
Cell-free translation in the reconstituted reaction system.
The PURE system (34)-coupled transcription–translation reaction (PUREfrex 1.0; GeneFrontier) was performed in the presence of [35S]methionine at 37 °C for 30 min using the DNA templates described above. One-third of the reaction mixture was mixed with an excess volume of 5% trichloroacetic acid (TCA) to stop reactions and was kept on ice. The remainder was treated with 1 mg/mL of puromycin at 37 °C for 5 min and subsequently was mixed with 5% TCA. After standing on ice for 10 min or more, samples were centrifuged for 3 min at 4 °C, and supernatant was discarded by aspiration. Precipitates were washed with 0.9 mL of acetone by vigorous mixing, centrifuged again, and dissolved in SDS sample buffer [62.5 mM Tris⋅HCl (pH 6.8), 2% SDS, 10% glycerol, 50 mM DTT] that had been supplemented with RNasecure (Ambion) by vortexing at room temperature. The puromycin-treated sample was divided into two portions, one of which was treated with 50 µg/mL of RNase A (Roche) at 37 °C for 30 min.
In vivo profiling of polypeptidyl–tRNAs.
E. coli cells harboring a plasmid encoding a His6-tagged protein were precultured overnight at 37 °C (for iNP experiments) or at 20 °C (for the initial subnascentome experiments) in M9 medium (62) supplemented with amino acids (20 µg/mL each, other than methionine and cysteine), 50 µg/mL of thiamine, 0.4% glycerol, and 20 µg/mL chloramphenicol and then were inoculated into the same medium to make the initial turbidity of A660 = 0.1. Cells were grown at the same temperature until an early exponential phase (A660 = 0.25–0.3). A 0.1-mL portion of the culture was induced with 2 mM isopropyl β-d-1-thiogalactopyranoside (IPTG) for 10 min to express the cloned gene, followed by protein pulse-labeling with 3.7 MBq/mL of [35S]methionine (PerkinElmer) for 0.5 min. When indicated, chase was initiated by adding unlabeled l-methionine to a final concentration of 200 µg/mL. Upon sampling, labeled culture was mixed directly with an equal volume of 10% TCA to stop any biological reactions and to precipitate macromolecules. After standing on ice for 15 min or more, samples were centrifuged for 3 min at 4 °C, and supernatant was discarded by aspiration. Precipitates were washed with 0.9 mL of acetone by vigorous mixing, centrifuged again, and dissolved in 40 µL of buffer A [50 mM Tris⋅HCl (pH 6.8), 1% SDS] by vortexing for 15 min at room temperature. The SDS-solubilized lysate was mixed with 560 µL of buffer B [25 mM Tris⋅HCl (pH 6.8), 300 mM NaCl, 0.1% SDS], incubated at 37 °C for 10 min, and then centrifuged for 5 min at room temperature. Supernatant was incubated with Dynabeads His-Tag Isolation & Pull Down (Life Technologies) for 15 min with mixing at room temperature. The beads then were collected by a magnet, washed twice with buffer B, and incubated with buffer C [50 mM Tris⋅HCl (pH 6.8), 1% SDS, 250 mM imidazole] to elute bound His6 proteins. The eluate was mixed with an equal volume of 2× SDS sample buffer [125 mM Tris⋅HCl (pH 6.8), 4% SDS, 20% glycerol, 100 mM DTT, treated with RNasecure] and divided into two portions, one of which was treated with 50 µg/mL of RNase A at 37 °C for 30 min.
SDS/PAGE under neutral pH conditions.
Nascentome 2D gel electrophoresis was carried out as described previously (32). In the experiments reported in Fig. 1A, 12% Nu-PAGE Bis-Tris gels were used with Mes-SDS running buffer (Life Technologies). Samples for the iNP analysis were electrophoresed using 11% WIDE Range Gel (Nacalai Tesque) according to the manufacturer's instructions. The gels were dried and exposed to phosphorimaging plates (Fuji Film). The intensity of radioactive bands was quantified using Multi Gauge software (Fuji Film).
Estimation of the Strength and Location of Translational Pausing.
Multi Gauge software (Fuji Film) was used to quantify the signal intensity of autoradiographic images. The intensities of bands in the in vitro iNP format (lanes 1–3 in Fig. 2 and Fig. S1) were divided by the maximum intensity value among the bands originating from the same translation reaction for easy normalization. The intensities of bands in the in vivo sample (lanes 4 and 5 in Fig. 2 and Fig. S1) were evaluated similarly. RNase-sensitive signals, which represent polypeptidyl–tRNAs, were estimated by subtracting the autoradiographic profile after RNase treatment (in vitro, lane 3 and in vivo, lane 5 in Fig. 2 and Fig. S1) from that of untreated sample (in vitro, lane 1 and in vivo, lane 4 in Fig. 2 and Fig. S1). The intensity of a puromycin-resistant polypeptidyl–tRNA was calculated similarly by subtracting the autoradiographic profile of the RNase-treated sample (lane 3 in Fig. 2 and Fig. S1) from that of the puromycin-treated sample (lane 2 in Fig. 2 and Fig. S1). The intensity of an RNase-sensitive signal relative to the highest-intensity signal originating from the same translation reaction or pulse-labeling (see above) was taken as the pause strength, which was expressed in 5% increments (0, 5, 15, …, 95, and 100%) in Fig. S1. The signals of polypeptidyl–tRNA were finally confirmed by manual inspection of the autoradiographic images. The puromycin resistance of a polypeptidyl–tRNA is estimated by the following formula: Puromycin resistance = [signal intensity (puromycin treated) − signal intensity (RNase treated)]/[signal intensity (untreated) − signal intensity (RNase treated)]. Molecular weight values (MW) were estimated from the electrophoretic mobility of the band of interest and of size markers (Precision Plus Protein Dual; Bio-Rad). The relative position of pausing within each ORF (0, N terminus; 1, C terminus) was estimated by the following formula: pausing site = [MW of polypeptidyl–tRNA − 18(MW of tRNA) − 2(MW of His6-tag)]/[MW of full-length chain − 2(MW of His6-tag)]. To identify translation pauses that are likely caused by the PP/PPX/ZPP motifs, the relative position of the PP/PPX/ZPP motifs within each ORF was calculated by the following formula: PP site = the first amino acid residue number of PP/PPX/ZPP motif/number of amino acids of the full-length chain. A translational pause whose pausing site value does not deviate by more than ±0.05 from the PP site value is assumed to be caused by the PP/PPX /ZPP motif.
Data Quality Check.
We focused our analysis on genes that gave reliable patterns of translation by excluding those genes whose in vitro and in vivo product sizes mutually disagreed or deviated by more than 100% from the theoretical sequence-based values. Also, we disregarded polypeptidyl–tRNA signals with an apparent MW <21 kDa (note that tRNA occupies an equivalent of ∼18 kDa), to eliminate possible contributions from the extra sequence introduced in the library construction, including the His6-tag attached to the native N termini. Some of the signal intensity datasets contained saturated signals (Dataset S2). We omitted these potentially overestimated signals from the analysis shown in Fig. 3C, but they were included as class 3 pausing in the in vitro–in vivo comparison shown in Fig. 5B. Datasets with a pausing site value >1.0 (beyond the stop codon) were omitted from the pausing site assignments shown in Figs. 3D and 4B. The positions of the genes on the E. coli chromosomal map and the amino acid sequences of their products were obtained from the PEC (Profiling of Escherichia coli chromosome) database (www.shigen.nig.ac.jp/ecoli/pec/). Subcellular locations and gene product features were obtained from GenoBase (63) (ecoli.naist.jp/GB/). TM assignments of the E. coli proteome members were based on the prediction by the TMHMM server v. 2.0 (64) (www.cbs.dtu.dk/services/TMHMM/). The dataset for the solubility information of E. coli proteins was obtained from eSOL (Solubility database of all E. coli proteins) (50) (www.tanpaku.org/tp-esol/index.php?lang=en). Statistical analyses were conducted using R software (65) (https://www.r-project.org).
Toeprint Analysis.
Toeprint analysis was performed as described previously (36) with the following variations. The DNA template for in vitro translation of secA (using PURE System Classic) was amplified from pCA24N-secA or pCY725 using primers 1 and tp-secA212-rv. Template for yaaX translation (using PUREfrex 1.0) was amplified from pCA24N-yaaX using primers 1 and ASKA-tp Stop+10. Templates for translation of maa-lacZα and its variants (using PUREfrex 1.0) were amplified from pCY735, pCY739, and pCY740, respectively, using primers 1 and tp_pCY735stop+_rv. The translation complexes were immobilized with thiostrepton (100 µg/mL) and were subjected to reverse transcription using the primer pe-lacZ-N-rv that had been labeled with Alexa 647 at the 5′ terminus. To prepare negative control samples, chloramphenicol (100 µg/mL) was included in the translation mixture, as indicated. Dideoxy DNA sequencing samples were prepared using the Thermo Sequenase Primer Cycle Sequencing Kit (GE Healthcare) and the same templates and the primer used for toeprint analysis.
Supplementary Material
Acknowledgments
We thank The National BioResource Project, E. coli (National Institute of Genetics, Japan) for providing the ASKA library clones; Rikiya Takeuchi for help in data analysis of the ribosome profiling results in the literature; Allen Buskirk for communicating ref. 49 prior to publication; Nobuo Shimamoto and Hideki Nakayama for discussions; Susumu Hibino for technical support; and Akiko Nakashima for secretarial assistance. This work was supported by grants from the Japanese Ministry of Education, Culture, Sports, Science, and Technology (MEXT); by Japan Society for the Promotion of Science (JSPS) Grants-in-Aid for Scientific Research 20247020 (to K.I.), 26116008 and 25291006 (to S.C.), and 26116002 (to H.T.); by Grant-in-Aid for JSPS Fellows 12J02403 (to Y.C.); and by Private University Strategic Research Foundation Support Program from MEXT Grant S1219 (to K.I. and S.C.). Y.C. was supported by a JSPS Research Fellowship for Young Scientists (Postdoctoral).
Footnotes
The authors declare no conflict of interest.
This article is a PNAS Direct Submission.
This article contains supporting information online at www.pnas.org/lookup/suppl/doi:10.1073/pnas.1520560113/-/DCSupplemental.
References
- 1.Sørensen MA, Kurland CG, Pedersen S. Codon usage determines translation rate in Escherichia coli. J Mol Biol. 1989;207(2):365–377. doi: 10.1016/0022-2836(89)90260-x. [DOI] [PubMed] [Google Scholar]
- 2.Borg A, Ehrenberg M. Determinants of the rate of mRNA translocation in bacterial protein synthesis. J Mol Biol. 2015;427(9):1835–1847. doi: 10.1016/j.jmb.2014.10.027. [DOI] [PubMed] [Google Scholar]
- 3.Dana A, Tuller T. Determinants of translation elongation speed and ribosomal profiling biases in mouse embryonic stem cells. PLOS Comput Biol. 2012;8(11):e1002755. doi: 10.1371/journal.pcbi.1002755. [DOI] [PMC free article] [PubMed] [Google Scholar]
- 4.Zhang G, Ignatova Z. Folding at the birth of the nascent chain: Coordinating translation with co-translational folding. Curr Opin Struct Biol. 2011;21(1):25–31. doi: 10.1016/j.sbi.2010.10.008. [DOI] [PubMed] [Google Scholar]
- 5.Tholstrup J, Oddershede LB, Sørensen MA. mRNA pseudoknot structures can act as ribosomal roadblocks. Nucleic Acids Res. 2012;40(1):303–313. doi: 10.1093/nar/gkr686. [DOI] [PMC free article] [PubMed] [Google Scholar]
- 6.Li GW, Oh E, Weissman JS. The anti-Shine-Dalgarno sequence drives translational pausing and codon choice in bacteria. Nature. 2012;484(7395):538–541. doi: 10.1038/nature10965. [DOI] [PMC free article] [PubMed] [Google Scholar]
- 7.Ude S, et al. Translation elongation factor EF-P alleviates ribosome stalling at polyproline stretches. Science. 2013;339(6115):82–85. doi: 10.1126/science.1228985. [DOI] [PubMed] [Google Scholar]
- 8.Doerfel LK, et al. EF-P is essential for rapid synthesis of proteins containing consecutive proline residues. Science. 2013;339(6115):85–88. doi: 10.1126/science.1229017. [DOI] [PubMed] [Google Scholar]
- 9.Woolstenhulme CJ, Guydosh NR, Green R, Buskirk AR. High-precision analysis of translational pausing by ribosome profiling in bacteria lacking EFP. Cell Reports. 2015;11(1):13–21. doi: 10.1016/j.celrep.2015.03.014. [DOI] [PMC free article] [PubMed] [Google Scholar]
- 10.Ito K, Chiba S. Arrest peptides: Cis-acting modulators of translation. Annu Rev Biochem. 2013;82:171–202. doi: 10.1146/annurev-biochem-080211-105026. [DOI] [PubMed] [Google Scholar]
- 11.Tenson T, Ehrenberg M. Regulatory nascent peptides in the ribosomal tunnel. Cell. 2002;108(5):591–594. doi: 10.1016/s0092-8674(02)00669-4. [DOI] [PubMed] [Google Scholar]
- 12.Wilson DN, Beckmann R. The ribosomal tunnel as a functional environment for nascent polypeptide folding and translational stalling. Curr Opin Struct Biol. 2011;21(2):274–282. doi: 10.1016/j.sbi.2011.01.007. [DOI] [PubMed] [Google Scholar]
- 13.Sohmen D, et al. Structure of the Bacillus subtilis 70S ribosome reveals the basis for species-specific stalling. Nat Commun. 2015;6:6941. doi: 10.1038/ncomms7941. [DOI] [PMC free article] [PubMed] [Google Scholar]
- 14.Bischoff L, Berninghausen O, Beckmann R. Molecular basis for the ribosome functioning as an L-tryptophan sensor. Cell Reports. 2014;9(2):469–475. doi: 10.1016/j.celrep.2014.09.011. [DOI] [PubMed] [Google Scholar]
- 15.Arenz S, et al. Drug sensing by the ribosome induces translational arrest via active site perturbation. Mol Cell. 2014;56(3):446–452. doi: 10.1016/j.molcel.2014.09.014. [DOI] [PMC free article] [PubMed] [Google Scholar]
- 16.Ismail N, Hedman R, Schiller N, von Heijne G. A biphasic pulling force acts on transmembrane helices during translocon-mediated membrane integration. Nat Struct Mol Biol. 2012;19(10):1018–1022. doi: 10.1038/nsmb.2376. [DOI] [PMC free article] [PubMed] [Google Scholar]
- 17.Goldman DH, et al. Ribosome. Mechanical force releases nascent chain-mediated ribosome arrest in vitro and in vivo. Science. 2015;348(6233):457–460. doi: 10.1126/science.1261909. [DOI] [PMC free article] [PubMed] [Google Scholar]
- 18.Nakatogawa H, Ito K. The ribosomal exit tunnel functions as a discriminating gate. Cell. 2002;108(5):629–636. doi: 10.1016/s0092-8674(02)00649-9. [DOI] [PubMed] [Google Scholar]
- 19.Spencer PS, Siller E, Anderson JF, Barral JM. Silent substitutions predictably alter translation elongation rates and protein folding efficiencies. J Mol Biol. 2012;422(3):328–335. doi: 10.1016/j.jmb.2012.06.010. [DOI] [PMC free article] [PubMed] [Google Scholar]
- 20.Pedersen S. Escherichia coli ribosomes translate in vivo with variable rate. EMBO J. 1984;3(12):2895–2898. doi: 10.1002/j.1460-2075.1984.tb02227.x. [DOI] [PMC free article] [PubMed] [Google Scholar]
- 21.Ingolia NT, Ghaemmaghami S, Newman JR, Weissman JS. Genome-wide analysis in vivo of translation with nucleotide resolution using ribosome profiling. Science. 2009;324(5924):218–223. doi: 10.1126/science.1168978. [DOI] [PMC free article] [PubMed] [Google Scholar]
- 22.Guttman M, Russell P, Ingolia NT, Weissman JS, Lander ES. Ribosome profiling provides evidence that large noncoding RNAs do not encode proteins. Cell. 2013;154(1):240–251. doi: 10.1016/j.cell.2013.06.009. [DOI] [PMC free article] [PubMed] [Google Scholar]
- 23.Guydosh NR, Green R. Dom34 rescues ribosomes in 3′ untranslated regions. Cell. 2014;156(5):950–962. doi: 10.1016/j.cell.2014.02.006. [DOI] [PMC free article] [PubMed] [Google Scholar]
- 24.Lareau LF, Hite DH, Hogan GJ, Brown PO. Distinct stages of the translation elongation cycle revealed by sequencing ribosome-protected mRNA fragments. eLife. 2014;3:e01257. doi: 10.7554/eLife.01257. [DOI] [PMC free article] [PubMed] [Google Scholar]
- 25.Gerashchenko MV, Gladyshev VN. Translation inhibitors cause abnormalities in ribosome profiling experiments. Nucleic Acids Res. 2014;42(17):e134. doi: 10.1093/nar/gku671. [DOI] [PMC free article] [PubMed] [Google Scholar]
- 26.O’Connor PB, Li GW, Weissman JS, Atkins JF, Baranov PV. rRNA:mRNA pairing alters the length and the symmetry of mRNA-protected fragments in ribosome profiling experiments. Bioinformatics. 2013;29(12):1488–1491. doi: 10.1093/bioinformatics/btt184. [DOI] [PMC free article] [PubMed] [Google Scholar]
- 27.Pelechano V, Wei W, Steinmetz LM. Widespread co-translational RNA decay reveals ribosome dynamics. Cell. 2015;161(6):1400–1412. doi: 10.1016/j.cell.2015.05.008. [DOI] [PMC free article] [PubMed] [Google Scholar]
- 28.Artieri CG, Fraser HB. Accounting for biases in riboprofiling data indicates a major role for proline in stalling translation. Genome Res. 2014;24(12):2011–2021. doi: 10.1101/gr.175893.114. [DOI] [PMC free article] [PubMed] [Google Scholar]
- 29.Miettinen TP, Björklund M. Modified ribosome profiling reveals high abundance of ribosome protected mRNA fragments derived from 3′ untranslated regions. Nucleic Acids Res. 2015;43(2):1019–1034. doi: 10.1093/nar/gku1310. [DOI] [PMC free article] [PubMed] [Google Scholar]
- 30.Martens AT, Taylor J, Hilser VJ. Ribosome A and P sites revealed by length analysis of ribosome profiling data. Nucleic Acids Res. 2015;43(7):3680–3687. doi: 10.1093/nar/gkv200. [DOI] [PMC free article] [PubMed] [Google Scholar]
- 31.Nakahigashi K, et al. Effect of codon adaptation on codon-level and gene-level translation efficiency in vivo. BMC Genomics. 2014;15:1115. doi: 10.1186/1471-2164-15-1115. [DOI] [PMC free article] [PubMed] [Google Scholar]
- 32.Ito K, et al. Nascentome analysis uncovers futile protein synthesis in Escherichia coli. PLoS One. 2011;6(12):e28413. doi: 10.1371/journal.pone.0028413. [DOI] [PMC free article] [PubMed] [Google Scholar]
- 33.Kitagawa M, et al. Complete set of ORF clones of Escherichia coli ASKA library (a complete set of E. coli K-12 ORF archive): Unique resources for biological research. DNA Res. 2005;12(5):291–299. doi: 10.1093/dnares/dsi012. [DOI] [PubMed] [Google Scholar]
- 34.Shimizu Y, et al. Cell-free translation reconstituted with purified components. Nat Biotechnol. 2001;19(8):751–755. doi: 10.1038/90802. [DOI] [PubMed] [Google Scholar]
- 35.Muto H, Nakatogawa H, Ito K. Genetically encoded but nonpolypeptide prolyl-tRNA functions in the A site for SecM-mediated ribosomal stall. Mol Cell. 2006;22(4):545–552. doi: 10.1016/j.molcel.2006.03.033. [DOI] [PubMed] [Google Scholar]
- 36.Chiba S, Ito K. Multisite ribosomal stalling: A unique mode of regulatory nascent chain action revealed for MifM. Mol Cell. 2012;47(6):863–872. doi: 10.1016/j.molcel.2012.06.034. [DOI] [PubMed] [Google Scholar]
- 37.Berlyn MK. Linkage map of Escherichia coli K-12, edition 10: The traditional map. Microbiol Mol Biol Rev. 1998;62(3):814–984. doi: 10.1128/mmbr.62.3.814-984.1998. [DOI] [PMC free article] [PubMed] [Google Scholar]
- 38.Nakatogawa H, Ito K. Secretion monitor, SecM, undergoes self-translation arrest in the cytosol. Mol Cell. 2001;7(1):185–192. doi: 10.1016/s1097-2765(01)00166-6. [DOI] [PubMed] [Google Scholar]
- 39.Nakamori K, Chiba S, Ito K. Identification of a SecM segment required for export-coupled release from elongation arrest. FEBS Lett. 2014;588(17):3098–3103. doi: 10.1016/j.febslet.2014.06.038. [DOI] [PubMed] [Google Scholar]
- 40.Chen W, et al. Rational design of translational pausing without altering the amino acid sequence dramatically promotes soluble protein expression: A strategic demonstration. J Biotechnol. 2014;189:104–113. doi: 10.1016/j.jbiotec.2014.08.031. [DOI] [PubMed] [Google Scholar]
- 41.Starosta AL, Lassak J, Jung K, Wilson DN. The bacterial translation stress response. FEMS Microbiol Rev. 2014;38(6):1172–1201. doi: 10.1111/1574-6976.12083. [DOI] [PMC free article] [PubMed] [Google Scholar]
- 42.Elgamal S, et al. EF-P dependent pauses integrate proximal and distal signals during translation. PLoS Genet. 2014;10(8):e1004553. doi: 10.1371/journal.pgen.1004553. [DOI] [PMC free article] [PubMed] [Google Scholar]
- 43.Peil L, et al. Distinct XPPX sequence motifs induce ribosome stalling, which is rescued by the translation elongation factor EF-P. Proc Natl Acad Sci USA. 2013;110(38):15265–15270. doi: 10.1073/pnas.1310642110. [DOI] [PMC free article] [PubMed] [Google Scholar]
- 44.Woolstenhulme CJ, et al. Nascent peptides that block protein synthesis in bacteria. Proc Natl Acad Sci USA. 2013;110(10):E878–E887. doi: 10.1073/pnas.1219536110. [DOI] [PMC free article] [PubMed] [Google Scholar]
- 45.Lu J, Deutsch C. Electrostatics in the ribosomal tunnel modulate chain elongation rates. J Mol Biol. 2008;384(1):73–86. doi: 10.1016/j.jmb.2008.08.089. [DOI] [PMC free article] [PubMed] [Google Scholar]
- 46.Ito-Harashima S, Kuroha K, Tatematsu T, Inada T. Translation of the poly(A) tail plays crucial roles in nonstop mRNA surveillance via translation repression and protein destabilization by proteasome in yeast. Genes Dev. 2007;21(5):519–524. doi: 10.1101/gad.1490207. [DOI] [PMC free article] [PubMed] [Google Scholar]
- 47.Charneski CA, Hurst LD. Positively charged residues are the major determinants of ribosomal velocity. PLoS Biol. 2013;11(3):e1001508. doi: 10.1371/journal.pbio.1001508. [DOI] [PMC free article] [PubMed] [Google Scholar]
- 48.Ikemura T. Codon usage and tRNA content in unicellular and multicellular organisms. Mol Biol Evol. 1985;2(1):13–34. doi: 10.1093/oxfordjournals.molbev.a040335. [DOI] [PubMed] [Google Scholar]
- 49.Mohammad F, Woolstenhulme CJ, Green R, Buskirk A. Clarifying the translational pausing landscape in bacteria by ribosome profiling. Cell Reports 2016 doi: 10.1016/j.celrep.2015.12.073. , 10.1016/j.celrep.2015.12.073. [DOI] [PMC free article] [PubMed] [Google Scholar]
- 50.Niwa T, et al. Bimodal protein solubility distribution revealed by an aggregation analysis of the entire ensemble of Escherichia coli proteins. Proc Natl Acad Sci USA. 2009;106(11):4201–4206. doi: 10.1073/pnas.0811922106. [DOI] [PMC free article] [PubMed] [Google Scholar]
- 51.Niwa T, Kanamori T, Ueda T, Taguchi H. Global analysis of chaperone effects using a reconstituted cell-free translation system. Proc Natl Acad Sci USA. 2012;109(23):8937–8942. doi: 10.1073/pnas.1201380109. [DOI] [PMC free article] [PubMed] [Google Scholar]
- 52.Keiler KC. Mechanisms of ribosome rescue in bacteria. Nat Rev Microbiol. 2015;13(5):285–297. doi: 10.1038/nrmicro3438. [DOI] [PubMed] [Google Scholar]
- 53.Herr AJ, Wills NM, Nelson CC, Gesteland RF, Atkins JF. Drop-off during ribosome hopping. J Mol Biol. 2001;311(3):445–452. doi: 10.1006/jmbi.2001.4899. [DOI] [PubMed] [Google Scholar]
- 54.Das G, Varshney U. Peptidyl-tRNA hydrolase and its critical role in protein biosynthesis. Microbiology. 2006;152(Pt 8):2191–2195. doi: 10.1099/mic.0.29024-0. [DOI] [PubMed] [Google Scholar]
- 55.Cruz-Vera LR, Magos-Castro MA, Zamora-Romo E, Guarneros G. Ribosome stalling and peptidyl-tRNA drop-off during translational delay at AGA codons. Nucleic Acids Res. 2004;32(15):4462–4468. doi: 10.1093/nar/gkh784. [DOI] [PMC free article] [PubMed] [Google Scholar]
- 56.Walter P, Blobel G. Translocation of proteins across the endoplasmic reticulum III. Signal recognition protein (SRP) causes signal sequence-dependent and site-specific arrest of chain elongation that is released by microsomal membranes. J Cell Biol. 1981;91(2 Pt 1):557–561. doi: 10.1083/jcb.91.2.557. [DOI] [PMC free article] [PubMed] [Google Scholar]
- 57.Fluman N, Navon S, Bibi E, Pilpel Y. mRNA-programmed translation pauses in the targeting of E. coli membrane proteins. eLife. 2014;3:e03440. doi: 10.7554/eLife.03440. [DOI] [PMC free article] [PubMed] [Google Scholar]
- 58.Pradhan P, Li W, Kaur P. Translational coupling controls expression and function of the DrrAB drug efflux pump. J Mol Biol. 2009;385(3):831–842. doi: 10.1016/j.jmb.2008.11.027. [DOI] [PubMed] [Google Scholar]
- 59.Nakatogawa H, Murakami A, Mori H, Ito K. SecM facilitates translocase function of SecA by localizing its biosynthesis. Genes Dev. 2005;19(4):436–444. doi: 10.1101/gad.1259505. [DOI] [PMC free article] [PubMed] [Google Scholar]
- 60.Gibson DG. Enzymatic assembly of overlapping DNA fragments. Methods Enzymol. 2011;498:349–361. doi: 10.1016/B978-0-12-385120-8.00015-2. [DOI] [PMC free article] [PubMed] [Google Scholar]
- 61.Sawano A, Miyawaki A. Directed evolution of green fluorescent protein by a new versatile PCR strategy for site-directed and semi-random mutagenesis. Nucleic Acids Res. 2000;28(16):E78. doi: 10.1093/nar/28.16.e78. [DOI] [PMC free article] [PubMed] [Google Scholar]
- 62.Miller JH. 1972. Experiments in Molecular Genetics (Cold Spring Harbor Laboratory, Cold Spring Harbor, NY), pp xvi, 466 pp.
- 63.Baba T, et al. 2006. Construction of Escherichia coli K-12 in-frame, single-gene knockout mutants: The Keio collection. Mol Syst Biol 2:2006.0008.
- 64.Krogh A, Larsson B, von Heijne G, Sonnhammer EL. Predicting transmembrane protein topology with a hidden Markov model: Application to complete genomes. J Mol Biol. 2001;305(3):567–580. doi: 10.1006/jmbi.2000.4315. [DOI] [PubMed] [Google Scholar]
- 65. R_Development_Core_Team (2011) R: A Language and Environment for Statistical Computing (the R Foundation for Statistical Computing, Vienna)
- 66.Michel AM, et al. GWIPS-viz: Development of a ribo-seq genome browser. Nucleic Acids Res. 2014;42(Database issue):D859–D864. doi: 10.1093/nar/gkt1035. [DOI] [PMC free article] [PubMed] [Google Scholar]
Associated Data
This section collects any data citations, data availability statements, or supplementary materials included in this article.


