Significance
Vaccines are one of the most cost-effective public health tools in history and offer a means to probe the human immune system. Recent advances have applied the tools of systems biology to study immune responses to vaccination in humans. Here we describe the application of this “systems vaccinology” approach to studying immunity to vaccination of 14- to 24-mo-old children with the inactivated influenza vaccine, administered with or without the MF59 adjuvant. These results reveal important new insights about the dynamics of the innate and adaptive responses to vaccination in this population, and identify potential correlates of immunity to vaccination in children.
Keywords: systems biology, influenza vaccine, MF59, adjuvant, children
Abstract
The dynamics and molecular mechanisms underlying vaccine immunity in early childhood remain poorly understood. Here we applied systems approaches to investigate the innate and adaptive responses to trivalent inactivated influenza vaccine (TIV) and MF59-adjuvanted TIV (ATIV) in 90 14- to 24-mo-old healthy children. MF59 enhanced the magnitude and kinetics of serum antibody titers following vaccination, and induced a greater frequency of vaccine specific, multicytokine-producing CD4+ T cells. Compared with transcriptional responses to TIV vaccination previously reported in adults, responses to TIV in infants were markedly attenuated, limited to genes regulating antiviral and antigen presentation pathways, and observed only in a subset of vaccinees. In contrast, transcriptional responses to ATIV boost were more homogenous and robust. Interestingly, a day 1 gene signature characteristic of the innate response (antiviral IFN genes, dendritic cell, and monocyte responses) correlated with hemagglutination at day 28. These findings demonstrate that MF59 enhances the magnitude, kinetics, and consistency of the innate and adaptive response to vaccination with the seasonal influenza vaccine during early childhood, and identify potential molecular correlates of antibody responses.
Influenza infection can be associated with severe complications and hospitalization in young children (1). Vaccination of children is safe and may substantially reduce disease burden and influenza transmission within the community. However, the trivalent inactivated influenza vaccine (TIV) is poorly immunogenic and has low effectiveness (2) under 2 y of age (3). Furthermore, two doses of TIV ≥1 mo apart are required for protection for the first year of immunization (4).
The availability of novel adjuvants provides a potential solution toward effective influenza control in the first 2 y. MF59 is an oil-in-water squalene-based adjuvant currently licensed for use in many countries worldwide for >65-y-old adults and in Canada for 6- to 24-mo-old children. Clinical trials have shown MF59-based influenza vaccines to be safe and to induce significantly enhanced, longer lasting, as well as broader immune responses compared with nonadjuvanted split vaccines (2, 5–7). Importantly the adjuvanted vaccine was shown to be significantly more efficacious than nonadjuvanted vaccines in preventing influenza infection in 6- to 72-mo-old children (2). This difference is thought to be mediated by MF59-mediated improved recruitment and activation of antigen presenting cells (APCs) (8), activation of vaccine specific CD4+ T lymphocytes, and spreading of the neutralizing sites recognized by specific antibodies (9, 10). MF59-adjuvanted TIV is not currently licensed for use in children, but has been administered to over 5,000 children in clinical trials (11) and showed enhanced immunogenicity and efficacy compared with TIV (2). No previous studies have attempted to assess the molecular mechanisms underlying influenza vaccine-induced immunity in children under 2 y of age.
Systems vaccinology is an emerging field that employs systems biology approaches to identify early molecular signatures, which may be helpful in predicting immune responses and in discovering new correlates of protection (12). Although systems vaccinology has been successfully applied to study different vaccines (13, 14), including TIV in young adults (15, 16) and older children (17), it has not yet been applied in very young children.
We described here a phase II, open-labeled randomized controlled trial that uses systems approaches to study the innate and adaptive responses to seasonal TIV and MF59-adjuvanted TIV (ATIV) in 90 14- to 24-mo-old healthy children. Our results illustrate the potential utility of using systems approaches to delineate mechanisms of vaccine immunity and identify correlates of vaccine immunity in children.
Results
Antibody Responses to MF59-Adjuvanted vs. Nonadjuvanted Influenza Vaccines.
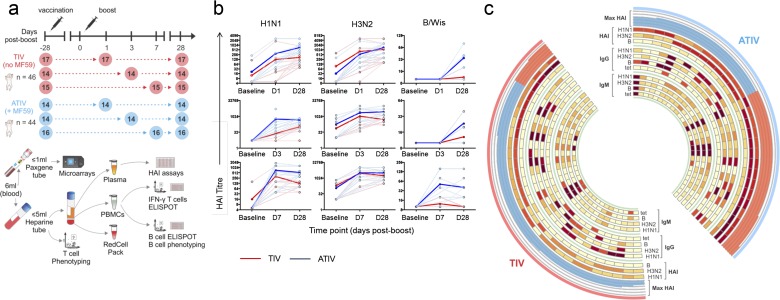
Two vaccine doses were given 28 d apart, and antibody responses were measured before and at various time points after vaccination (Fig. S1A; see demographics in Table S1). A major goal of this study was to document the kinetics of vaccine responses in children. Given the limits on the amount and frequency of blood draws in children, the 90 subjects were randomized into three subgroups where blood could be obtained before immunization and 1 mo after the second dose for all participants, and on either days 1, 3, or 7 following the second vaccine dose in each subgroup (Fig. S1A).
Fig. S1.
Experimental approach and accumulation of HAI titres. (A) Study design and sample prioritization. Ninety 14- to 24-mo-old children were recruited and randomized to receive two doses of either TIV or ATIV, 28 d apart. Blood samples were obtained at the time points indicated by the circles. The numbers inside the circles represent the number of children from which blood was collected. Microarray experiments and HAI assays were used to obtain, respectively, the gene-expression profiles and antibody responses of children vaccinated with trivalent influenza vaccine with (ATIV, blue) or without (TIV, red) MF59 adjuvant. A maximum volume of 6 mL blood was drawn at the indicated time points. The first 1 mL was prioritized for transcriptomics and added to a Paxgene tube. The remaining volume of blood was added to a preservative-free heparin tube and used for T-cell phenotyping, and the remainder for isolation of plasma for HAI and PBMCs for IFN-γ ELISpots, frozen T cells, B-cell ELISpots, and B-cell phenotyping. (B) HAI titer accumulation in individual patients. Strain-specific HAI titers are shown for each subject in each of the three cohorts. Red color indicates subjects that received TIV vaccine; blue is the ATIV vaccine. Bold lines indicate average values across all vaccines in the cohort. (C) Antibody responses induced by vaccination. The circos plot shows the log2 fold-induction of HAI titers on day 28 postboost compared with preimmunization for each one of the three Influenza virus strains (“HAI” heat maps) and for the highest fold-induction among all three strains (i.e., the Max HAI; histogram). Vaccinees with log2 fold-induction ≥6 and <6 are shown, respectively, as red and blue bars in the histogram. The inner heat maps show the log2 fold-induction of IgM- and IgG-secreting cells (ELISpots) on day 28 postboost compared with preimmunization for each one of the three Influenza virus strains (“IgG” and “IgM” heat maps) and for Tet.
Table S1.
Demographics for the entire study cohort by vaccine group along with those for the subgroups at the visit three kinetics time points
| Demographic | TIV group | ATIV group | ||||
| Median age (mo) | 22 | 21 | ||||
| Age range (mo) | 14–26 | 14–27 | ||||
| Sex (% female) | 43 | 34 | ||||
| Anticipated (n) | 45 | 45 | ||||
| Enrolled (n) | 46 | 44 | ||||
| Visit 3 Kinetic group (d postboost) | 1 | 3 | 7 | 1 | 3 | 7 |
| Median age (mo) | 21 | 21.5 | 22 | 21 | 21 | 21.5 |
| Age range (mo) | 15–26 | 14–26 | 15–26 | 15–26 | 14–24 | 14–27 |
| Sex (% female) | 24 | 50 | 60 | 21 | 43 | 38 |
| Anticipated (n) | 15 | 15 | 15 | 15 | 15 | 15 |
| Enrolled (n) | 17 | 14 | 15 | 14 | 14 | 16 |
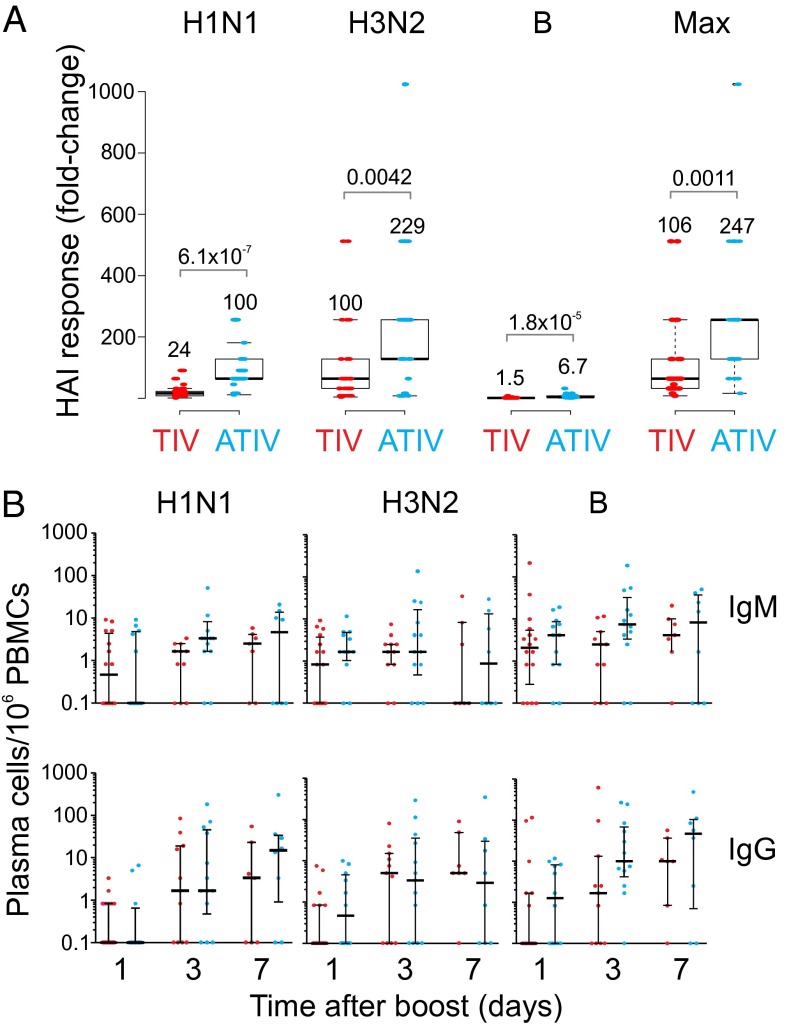
Before immunization there were detectable hemagglutination (HAI) titers against the H1N1 and H3N2 strains in some children, indicating prior exposure to influenza (Fig. S1B). Children receiving either TIV or ATIV showed elevated HAI titers (Fig. 1A). Robust HAI titers were detected at day 1 after the second dose of vaccine in both groups (Fig. S1B), although to what extent this was residual titers from the primary vaccination versus those induced by booster vaccination is unknown. At day 28 postboost, HAI geometric mean titers (GMT) were higher in ATIV vaccinees compared with TIV (Fig. 1A, Fig. S1 B and C, and Table S2). Because HAI titers of >1:40 are described as protective in adults but are not sufficient in children, Black et al. (18) modeled titers that would confer up to 90% protection from reinfections. In this study, 100% of children receiving ATIV had achieved titers ≥629 [90% protection according to Black et al. (18)] by day 28 postboost, and as early as day 1 postboost to the A/strains (Table S2). This level of protection was only reached by 3% (A/H1N1) and 47% (A/H3N2) of TIV-immunized children. In response to B/Hubei, only 48% of the ATIV group and 3% in the TIV group achieved any level of protection. Thus, MF59 induces a substantially greater antibody response to vaccination with seasonal influenza vaccine in children.
Fig. 1.
Humoral immunity to influenza vaccination in children. (A) Box plot showing the HAI response of ATIV and TIV vaccinees on day 28 postboost compared with preimmunization for each one of the three Influenza virus strains and for the highest fold-induction among all three strains (P value for t test; two-tailed test). Numbers above each box represent the mean fold-change values. (B) Vaccine-specific (H1N1, H3N2, and B/Hubei) and Tet control plasma cells frequency by ex vivo ELISpot on days 1, 3, or 7 following two doses of vaccine. The number of IgM- and IgG-secreting plasma cells is shown on a log-scale with the median and interquartile ranges indicated by the line and error bars.
Table S2.
HAI GMT before and following two doses of TIV or ATIV
| GMT | Before first dose | After second dose | ||||||||
| Day 0 | Day 1 | Day 3 | Day 7 | Day 28 | ||||||
| TIV | ATIV | TIV | ATIV | TIV | ATIV | TIV | ATIV | TIV | ATIV | |
| Total | 41 | 42 | 17 | 14 | 11 | 13 | 9 | 11 | 36 | 33 |
| Paired | N/A | N/A | 15 | 14 | 10 | 12 | 9 | 11 | 33 | 33 |
| A/H1N1 | ||||||||||
| GMT | 5.87 | 5.47 | 15 | 119 | 18 | 156 | 160 | 482 | 82 | 434 |
| (95% CI) | 4.71–7.32 | 4.58–6.54 | 7–32 | 68–207 | 11–28 | 70–347 | 73–351 | 256–908 | 58–115 | 332–567 |
| A/H3N2 | ||||||||||
| GMT | 24.92 | 19.35 | 174 | 297 | 265 | 751 | 1493 | 1754 | 604 | 1546 |
| (95% CI) | 15.07–41.21 | 12.27–30.53 | 78–389 | 179–492 | 97–724 | 327–1,723 | 575–3,879 | 921–3,340 | 426–856 | 1142–2,094 |
| B/Hubei | ||||||||||
| GMT | 10 | 10 | 10 | 10 | 10 | 10 | 12 | 31 | 11 | 26 |
| (95% CI) | 10–10 | 10–10 | 10–10 | 10–10 | 10–10 | 10–10 | 9.6–14 | 17–58 | 9.9–12 | 21–33 |
Influenza-Specific Plasmablast and Memory B-Cell Responses to Vaccination.
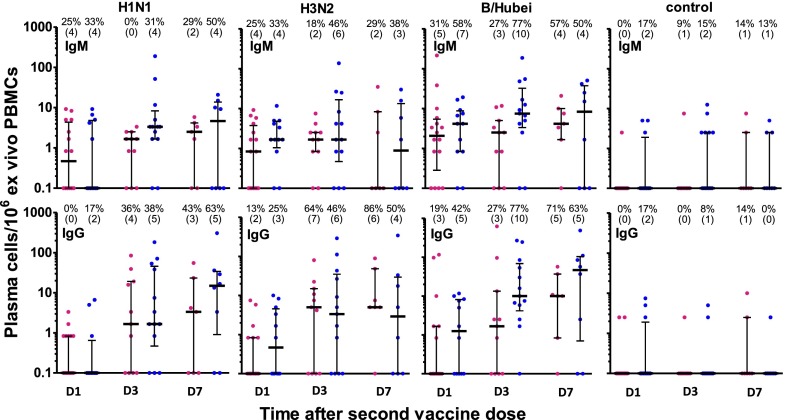
A characteristic feature of immunity to seasonal influenza vaccination in adults is the plasmablast response, which is induced briskly and peaks sharply at day 7, postvaccination (19). In children, there was a substantial increase in the frequencies of IgG-secreting plasmablasts, although this was not statistically significant because there was a considerable variation in the response between the vaccinees. Furthermore, the magnitude of the response was much lower than reported in adults [mean 398 IgG secreting TIV specific plasmablasts per million peripheral blood mononuclear cells (PBMCs), range 1–104 per million PBMCs (15)] (Fig. 1B and Fig. S2) (15, 19). Because there were more responders in the ATIV group, the higher HAI response to ATIV despite apparently similar plasmablasts frequencies may reflect differences in the kinetics of the plasmablast responses. Interestingly, the frequencies of the IgG-secreting plasmablasts at days 3 and 7 were similar, which also differs from the adults. This kinetic difference may arise partly from different study designs (primary responses in adults vs. boost responses in infants) but warrants further investigation. Importantly, TIV and ATIV induced a similar magnitude of IgM- and IgG-secreting plasmablast cells specific to H1N1 and H3N2, with a trend for greater IgM- and IgG-secreting plasmablasts specific for the B strain. Nevertheless, Fig. 1B and Fig. S2 suggest that vaccination induces a plasmablast response of greater than 10 spots per million in a considerably greater proportion of subjects.
Fig. S2.
Plasma cell responses. Children were immunized on day 0 and day 28 with either TIV (red) or ATIV (blue) and the frequency of vaccine specific plasma cells was determined by ex vivo ELISpot from subgroups of children bled either on day 1, 3, or 7 postboost. The number of IgM- and IgG-secreting plasma cells is shown on a log scale with the median and interquartile ranges indicated by the line and error bars. A response was determined to be >four spots per million ex vivo PBMCs and percentage of responders is given above each plot with (n = responders) in parenthesis.
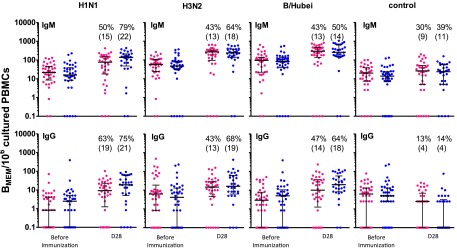
Preimmunization IgM memory B cells were detected to all HA strains in the TIV and ATIV groups (Fig. S3). At day 28 postboost, their frequency were higher (>fourfold) to all of the vaccine antigens following TIV or ATIV immunization compared with the Tet control (Fig. S3). IgG memory cells were low before immunization and did not significantly increase during the course of the study.
Fig. S3.
Memory B-cell responses. Children were immunized on day 0 and day 28 with either TIV (red) or ATIV (blue) and the frequency of vaccine specific BMEM was determined following polyclonal stimulation of PBMCs in vitro to expand memory cell populations. BMEM ELISpot were undertaken before immunization and on 1 mo after the second dose of vaccine. The number of IgM and IgG BMEM is shown on a log scale with the median and interquartile ranges indicated by the line and error bars. A response was determined to be ≥fourfold rise from baseline and the percentage of responders is given above each plot with (n = responders) in parenthesis.
ATIV Vaccine Induces a Higher Expansion of Multicytokine-Producing Vaccine-Specific CD4+ T Cells Compared with TIV Vaccine.
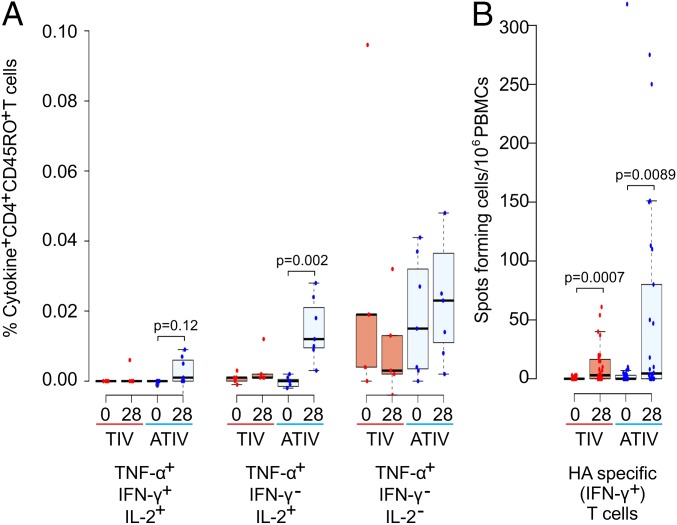
To assess vaccine-induced T-cell responses, PBMCs were stimulated with pooled overlapping peptides spanning the hemagglutinins of vaccine strains. The cytokine profiles of vaccine-specific T cells were characterized by intracellular cytokine assay (Fig. 2A). Consistent with recently published data (7), the MF59-adjuvanted TIV vaccine induced a higher expansion of multicytokine-producing vaccine-specific CD4+ T cells, mostly producing TNF-α and IL-2. An increase in the frequency of vaccine-specific IFN-γ+ T cells was observed by ex vivo human IFN-γ enzyme-linked immunospot (ELISpot) assays in both TIV- and ATIV-vaccinated individuals (Fig. 2B). The fold-increase in ex vivo vaccine-specific IFN-γ+ T cells for each vaccine group, however, remained comparable in both vaccine groups (Fig. 2B).
Fig. 2.
Expansion of multicytokine-producing vaccine-specific CD4+ T cells. (A) Percentage of cytokine-producing vaccine-specific CD4+ T cells before immunization and 28 d postboost in TIV- (blue) and ATIV- (red) vaccinated individuals, respectively. Significant differences are indicated (Wilcoxon signed-rank test, n = 12). TNF-α+, IFN-γ+, IL-2− T cells and TNF-α− T cells are not illustrated because no difference was found. (B) IFN-γ ELISpot assays were used to identify hemagglutinin-specific T cells. Significant differences are indicated (Wilcoxon signed-rank test, TIV n = 27, ATIV n = 26).
Transcriptional Signatures to Influenza Vaccination in Children.
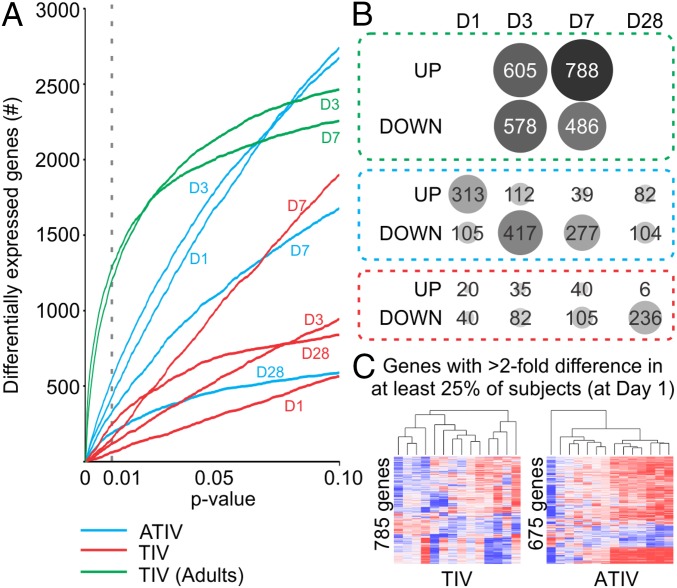
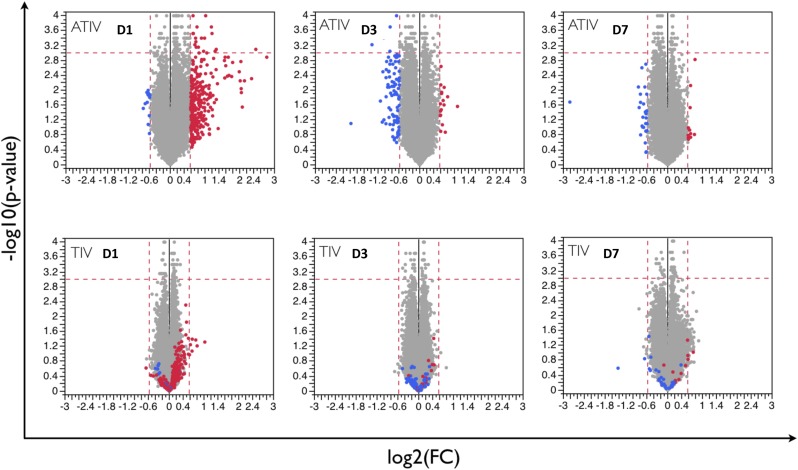
We next assessed the transcriptional signatures induced by vaccination with TIV or ATIV. Paired t-test analyses were performed to identify differentially expressed genes at each time point postboost compared with before immunization. ATIV induced a much stronger perturbation of gene expression at days 1, 3, and 7 postboost compared with TIV at any P value cut-off below 0.05 (Fig. 3A); the only exception is day 28 postboost, where the two vaccines elicited similar magnitude of response at more stringent cut-off (Fig. 3A). To provide context for these results, we compared them to responses observed for vaccination in adults (15). Infant responses to vaccine boost were markedly attenuated compared with adult responses to vaccine prime (Fig. 3A) (P value < 0.01). Although this difference may partially derive from the comparison between primary and boost responses, adults in the previous study were not immunologically naïve to influenza (15); therefore, it is difficult to define the appropriate adult comparator group for the infants. In terms of average numbers of genes up- or down-regulated, we observed the strongest responses in the ATIV vaccine cohorts at days 1 and 3 after the boost. Interestingly, at day 1 most genes were up-regulated, whereas at day 3 they were down-regulated (Fig. 3B). The numbers of regulated genes is much smaller than in an adult cohort observed under the same conditions (Fig. 3B). Comparative analysis of gene expression between two vaccines at each time point is represented in Fig. S4. At day 1 postboost there is a considerable similarity between the overall predominant direction of response between ATIV and TIV subjects, although the response in the TIV arm is much weaker. At days 3 and 7 postboost, the similarities become less pronounced (Fig. S4).
Fig. 3.
Blood transcriptome analyses of ATIV and TIV vaccinees. (A) Impact in the blood transcriptome of ATIV and TIV vaccinees. Number of differentially expressed genes (y axis) using different paired t test two-tailed P value cut-offs (x axis) identified in response to ATIV (blue lines) or TIV (red lines) vaccination on children, or in response to TIV vaccination on young adults (green lines) (25). The time points after vaccination compared with before are represented above each line. (B) Number of differentially expressed genes identified using P value < 0.01. Circle sizes are proportional to the number of genes (shown inside the circle) up- or down-regulated postboost. (C) Heterogeneity in blood-expression profiles. The heat map shows 785 and 675 genes with twofold difference (up-regulated in red and down-regulated in blue) in at least 25% of TIV and ATIV vaccinees, respectively, on day 1 postboost compared with preimmunization.
Fig. S4.
Average transcriptional responses at days 1, 3, and 7 postboost. Each dot represents a probe set. Fold-changes and statistical significance are shown for days 1, 3, and 7 postboost compared with prevaccination time point. Vertical dashed lines are drawn at 1.5-fold change level; horizontal dashed lines correspond to P value of 0.001. At each time point, probe sets up-regulated (red) or repressed (blue) in ATIV vaccinees are shown in the TIV vaccinees for comparison purposes.
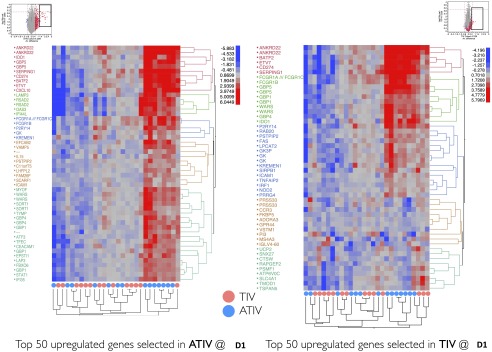
The overall weak transcriptomic responses in vaccinated young children may be explained in part by the high heterogeneity within each group. To assess the consistency of gene transcriptional programs across subjects, we monitored the expression of genes that are robustly regulated (>twofold) in at least a small fraction of subjects (>25%). We observed that all of these genes appear to be up-regulated in a subset of subjects, but are repressed or not regulated in others (Fig. 3C), demonstrating great subject-to-subject heterogeneity of responses. To further emphasize this point, we have also demonstrated the extent of heterogeneity using genes that are, on average, most up-regulated in each vaccine arm and cohort. Monitoring the expression of these genes in each child, we detected a large fraction of individuals with the same genes being repressed instead of up-regulated, or left unchanged compared with before immunization. This is especially pronounced for the TIV arm and less so for the ATIV arm (Fig. S5).
Fig. S5.
Subject-to-subject heterogeneity. Top 50 most up-regulated on average probe sets were selected in ATIV (Left) and TIV (Right) at D1 following the boost immunization. Heat maps demonstrate the expression of these probe sets in each subject at D1 relative to preimmunization time point.
Modular Analysis of Transcriptomic Responses.
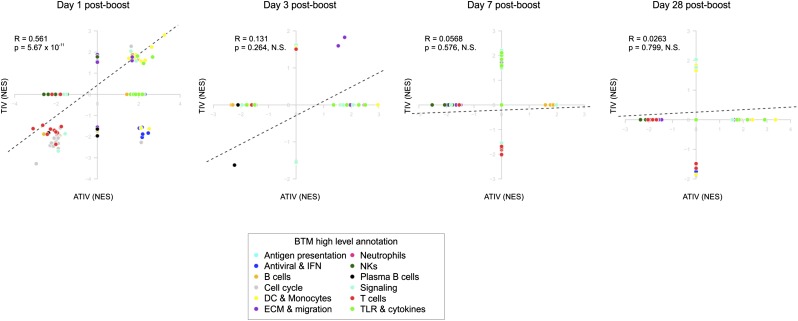
To describe the functional content of the transcriptional responses elicited by the two vaccines, we applied gene set enrichment analysis (GSEA) to the lists of genes ranked by the average expression fold-change across all subjects in a cohort. Blood transcription modules (BTMs) developed previously by our group (13) were used as gene sets on these analyses. The BTMs encompass a collection of 346 gene sets that, taken together, describe various aspects of the functioning of the immune system, including markers of various cell lineages, innate and adaptive immunity, as well as modules describing general physiological processes, such as the cell cycle, cell migration, energy metabolism, and intracellular signaling in blood circulating cells (13). Our GSEA analyses show that on day 1 postboost, the BTM activity changes are similar between TIV and ATIV subjects, whereas on days 3, 7, and 28, the changes seem to be more specific for each arm (Fig. S6). Additionally, day 1 postboost had the strongest changes and greatest significance in both vaccine arms (Fig. S6). However, because these analyses used lists of genes ranked by the average expression across all subjects, the inherent biological variability within each group may have affected the transcriptomic responses.
Fig. S6.
Comparison of blood transcriptomics between ATIV (x axis) and TIV (y axis) vaccinees in different days postboost. GSEA (1,000 permutations) was used to obtain the NES between BTMs (gene sets) and preranked gene lists, where genes were ranked according to their fold-change between expression on a given day postboost and baseline. Each dot represents a BTM and the colors represent the high level annotation of BTMs. R and P values are for Pearson correlation.
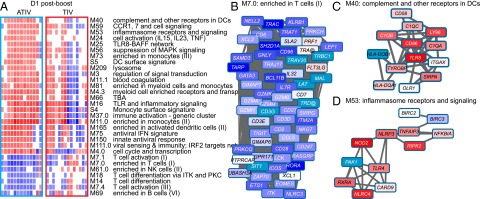
Therefore, instead of ranking genes based on the average fold-change values, we ran GSEA on individual subject’s responses. This single-sample GSEA approach can be valuable in identifying consistent and stable responses across subjects (20). At day 1 following the boost, several modules related to innate immunity were found as strongly positively enriched (Fig. 4A). These include M75 “antiviral interferon signature,” S5 “dendritic cell signature,” M16 “Toll-like receptor (TLR) and inflammatory signaling,” and others (Fig. 4A). Among the negatively enriched modules, several modules related to T-cell function, NK cells, and cell cycle were found, including M7.1 “T cell activation,” M7.2 “enriched in NK cells,” and M4.0 “cell cycle and transcription” (Fig. 4A). Individual gene expression at day 1 postboost, as well as the interactions between genes in a BTM, are shown for selected BTMs (Fig. 4 B–D).
Fig. 4.
GSEA applied to individual ATIV and TIV vaccinees. (A) GSEA (nominal P < 0.05; 1,000 permutations) was used to identify positive (red), negative (blue), or no (white) enrichment between BTMs (gene sets) and preranked gene lists, where genes were ranked according to their fold-change between expression on day 1 postboost and before immunization for each subject. ATIV and TIV vaccinees are shown in columns and BTMs in rows. (B) Genes in BTM M7.0; each “edge” (gray line) represents a coexpression relationship, as described in Li et al. (13); colors represent the mean fold-change for all ATIV vaccinees on day 1 postboost compared with before immunization. (C) Genes in BTM M40; same as in iB. (D) Genes in BTM M53; same as in B.
Signatures of Immunogenicity for MF59 Adjuvanted and Nonadjuvanted Influenza Vaccines.
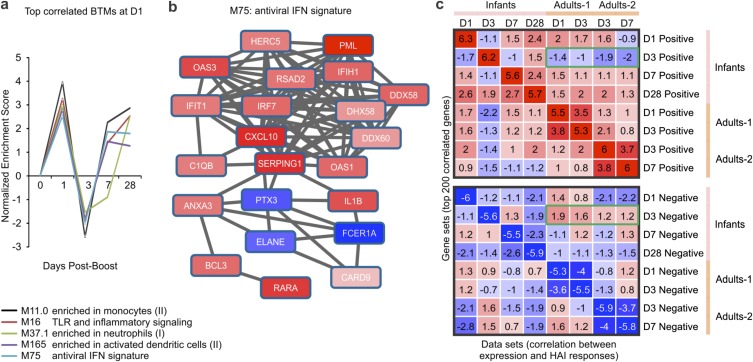
Next, we sought to identify BTMs whose expression activity correlates with HAI titers in children. Pearson correlation analyses were performed between the preimmunization-normalized expression at days 1, 3, 7, and 28 following the boost and the maximum fold-change of HAI titers selected across all three influenza strains present in the vaccine at day 28 after the boost. We then ranked genes based on correlation values, and applied GSEA to identify the BTMs that are positively or negatively correlated with HAI response (Fig. S7). When both arms are pooled together, we observed that a number of innate immunity modules exhibit a strong, statistically significant, and coordinated pattern of enrichment (Fig. S7A). These modules include M75 “antiviral interferon signature,” M165 “enriched in activated dendritic cells,” and several others. These modules were positively correlated with HAI response at days 1, 7, and 28 following the boost (Fig. S7A). Indeed, several genes from the M75 module were positively correlated with HAI titers at day 1 postboost (Fig. S7B). An unexpected finding was that the same modules appear to be negatively enriched at day 3 after the boost (Fig. S7A). We have further verified our observations by running the correlation analysis using preimmunization-normalized HAI titers for individual vaccine strains, removing the subjects with preexisting titers. Although we noted some difference in correlates of immunogenicity between the two strains, using maximum preimmunization-normalized HAI titers across both strains allowed us to recapitulate the common or dominant features of response.
Fig. S7.
Gene signatures associated with HAI response in children and adults. (A) Temporal activity pattern of top correlated BTMs at D1 postboost. GSEA (nominal P < 0.05; 1,000 permutations) was used to identify BTMs (gene sets) whose genes were enriched in preranked lists (i.e., genes ranked according to their correlation between expression fold-change and maximum HAI response). Graph shows the NES of each selected BTM in the different time points. (B) Genes in BTM M75; each “edge” (gray line) represents a coexpression relationship, as described in Li et al. (13); colors represent the Pearson correlation between gene expression on day 1 postboost compared with baseline and the maximum HAI response. (C) Comparison of HAI-correlated signatures between infants and adults. Gene sets (rows) were defined as the top 200 genes with highest positive (Upper) or negative (Lower) correlation between gene expression at given time point (shown on the right of the heat map) and the HAI response. GSEA (1,000 permutations) was used to obtain the NES of those gene sets in preranked lists (columns; genes ranked according to their correlation between expression fold-change and HAI response for different datasets). Colors represent positive (red) or negative (blue) enrichment. The green rectangles indicate that D3-correlated signatures in infants are very different from those in adults. Adults-1 and Adults-2 datasets were obtained from GEO database: GSE48024 (21) and GSE29619 (15), respectively.
We next compared the signatures that correlate with HAI response in children with those from young adults (15, 21). We generated gene sets consisting of the top 200 genes correlating, either positively or negatively, with the maximum increase in HAI titers in the children, as well as in both adult studies. We then used GSEA to determine if the gene sets in children were significantly enriched in genes preranked by their correlation to HAI response in adults, and vice-versa (Fig. S7C). Genes that positively correlated with HAI response at days 1 and 7 postboost in children appear to be also positively correlated with the HAI response in both adult cohorts at the same time points postvaccination (Fig. S7C). The striking difference is represented by day 3 postboost gene sets in children, which showed an opposite trend in adults (Fig. S7C).
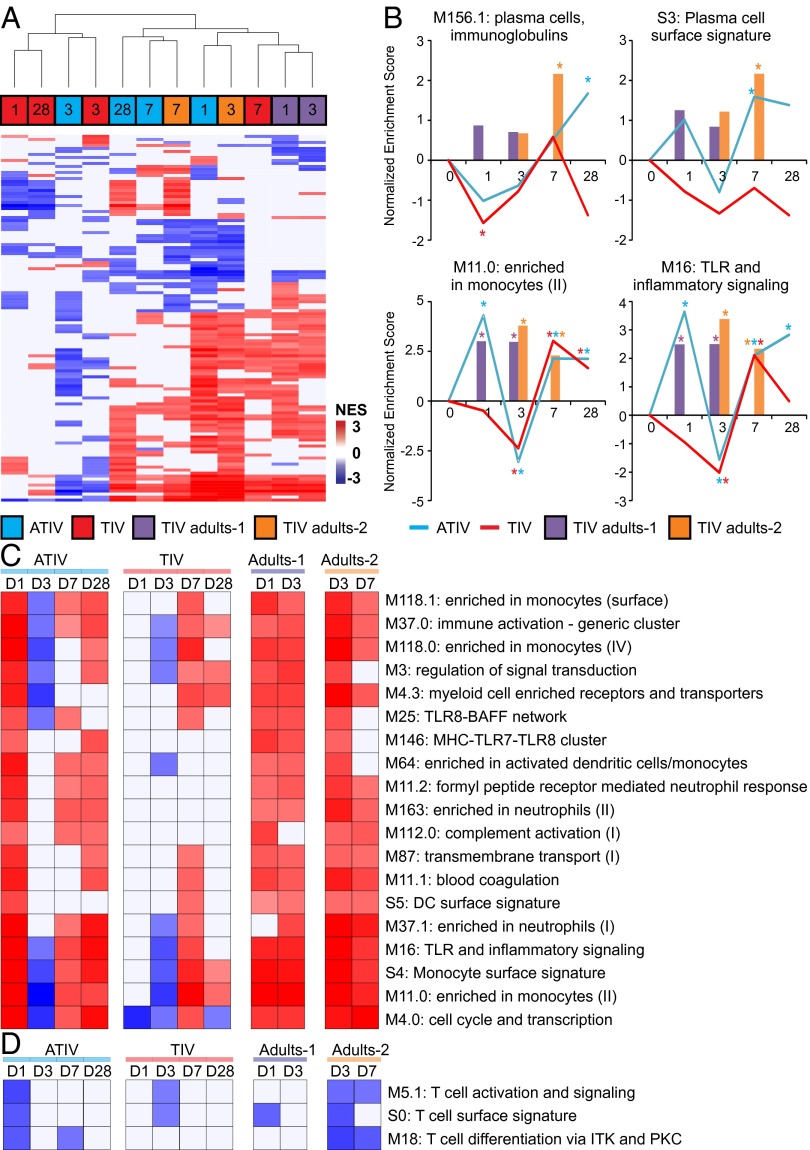
Finally, we performed an additional correlation GSEA analysis but this time separating the children according to their vaccine arm. As shown in Fig. 5A, the activity profile of BTMs that correlate with HAI response in ATIV vaccinated children on days 1, 7, and 28 are more similar to days 1, 3, and 7 of adults. With the exception of day 7 postboost, TIV vaccinated children have a more unique HAI-correlated BTM signature (Fig. 5A). The kinetics of enrichment of two BTMs associated with antibody-secreting cells (M156.1 and S3) show that enrichment is higher on days 7 and 28 only for ATIV (Fig. 5B). In fact, the M156.1 module “plasma cell, immunoglobulins” only achieves statistical significance at day 28 postboost, suggesting that unlike in adults, the expansion of antibody secreting cells may occur after day 7 (Fig. 5B). BTMs associated with monocytes (M11.0) and TLR and inflammatory signaling (M16) are higher in ATIV compared with TIV on day 1 but not on day 7 (Fig. 5B). Additionally, several other BTMs associated with innate immunity followed this pattern (Fig. 5C), suggesting that MF59 adjuvant induce a robust innate response and that is correlated with HAI response. Among the BTMs whose activity was negative correlated with HAI response on day 1 postboost in ATIV, several were related to T-cell activation and differentiation (Fig. 5C). In adults, these modules were instead negatively enriched on later time points (Fig. 5C). These results underscore potential differences in the kinetics of immune response in children compared with adults.
Fig. 5.
Kinetics of signatures of immunogenicity to TIV and ATIV vaccination. (A) Hierarchical clustering of children and adults using BTMs, whose activity correlates with HAI response. GSEA (nominal P < 0.05; 1,000 permutations) was used to identify positive (red), negative (blue), or no (white) enrichment between BTMs (rows) and preranked gene lists (columns), where genes were ranked according to their correlation between expression fold-change at a given time point (shown inside the squares) and HAI response (euclidean distance and average clustering method). Shown are 112 BTMs significantly enriched in at least 4 of 12 lists. (B) Temporal activity pattern of selected BTMs. Graph shows the normalized enrichment score (NES) of each selected BTM in the different time points for ATIV (blue lines), TIV (red lines), Adults-1 (purple bars), and Adults-2 (brown bars) cohorts. (C) Heat map of selected BTMs whose activity is positively correlated in several lists. (D) Heat map of selected BTMs whose activity is negatively correlated in several lists.
Discussion
MF59 enhanced the magnitude and kinetics of serum antibody titers and induced a greater frequency of vaccine-specific, multicytokine-producing CD4+ T cells. Vaccination with TIV or ATIV induced an antigen-specific plasmablast response, albeit with a lower magnitude and altered kinetics to that observed in adults. Unlike our previous observations in adults, in infants TIV induced a weak transcriptional signature consisting of genes encoding proteins involved in antiviral immunity and antigen presentation. In contrast, ATIV immunization induced a more homogenous and robust transcriptional response. The responses in children are highly heterogeneous, being up-regulated, unchanged, or even down-regulated in subsets of children. Correlation analyses indicated that this heterogeneity does not merely reflect prior exposure to influenza, suggesting that other factors are at play. Unexpectedly, a large fraction of children showed repressed instead of up-regulated genes following TIV immunization, which contrasts to adult responses (15). Whether it reflects the existence of specific regulatory process active in young children remains to be tested.
Intriguing features of the data are the kinetics and magnitude of the plasmablast response to vaccination. Previous studies in adults have demonstrated that influenza vaccination induces a plasmablast response that peaks sharply at day 7 after vaccination. In the present study the response was much weaker and displayed a different kinetics as similar numbers of IgG-secreting plasmablasts were observed at days 3 and 7. Both TIV and ATIV induced a similarly weak magnitude of IgM- and IgG-secreting plasmablast cells. Unlike in the adult population in which there is a strong correlation between the magnitude of the day 7 plasmablast response and the serum HAI titers at day 28 (15), no such correlations were apparent. This finding may be indicative of an altered kinetics of plasmablast responses in children (possibly because of the short period between priming dose and boosting dose). Alternatively, it may indicate an as yet undefined population of B cells that contribute toward antibody production in children.
Assessing the relative associations of molecular responses on vaccine-induced HAI titers suggests that the same coordinated pattern of antiviral IFN signature, dendritic cell activations, and other innate immunity-associated genes are positively correlated with HAI responses in children and in adults. An intriguing finding is that BTMs that are positively correlated with HAI titers at days 1 and 7 appear to be negatively correlated with HAI titers at day 3 (Fig. S7A). One possible explanation for this is that cells in the blood may migrate to the lymph nodes or spleen, in response to inflammatory triggers induced in the blood by vaccination. Consistent with this notion, in nonhuman primates injected with TLR ligands, there is a rapid and transient decrease in the numbers of PBMCs, likely as a result of trafficking to lymphoid organs (22). Notwithstanding, our results demonstrate that ATIV immunization increases both HAI and transcriptional responses toward more adult-like patterns, and identify putative correlations between early innate transcriptional responses and HAI responses in children. In contrast, in response to TIV, only about half of all subjects responded in a way similar to the majority of subjects in the ATIV arm, whereas the remaining did not respond or responded in the opposite way. These findings reveal heterogeneity in the response to TIV, and suggest that ATIV may not necessarily induce a much stronger but a more consistent (i.e., in a larger fraction of subjects) transcriptomic response. Although the use of BTMs allowed us to dissect the transcriptional response to influenza vaccination in infants, further studies should define whether these BTMs defined from adult populations can be generalizable to the infant population. In summary, these findings demonstrate that MF59 enhances the magnitude, kinetics, and consistency of the innate and adaptive responses to TIV during early childhood, and identify early molecular correlates of the antibody response.
Methods
All participants gave informed written consent in accordance with ethical approval from the local ethics committee [Oxford Research Ethics Committee (OxREC) C approval number 12/SC/0407. EudraCT number 2012-002443-26]. Ninety 14- to 26-mo-old healthy children received two doses of TIV or ATIV at 4-wk intervals during the 2012–2013 winter season. Antibody titers were measured by HAI and the data were log-transformed to calculate the GMT and GMR (ratio) with 95% confidence intervals (CI). Plasmablast and memory B-cell responses were quantitated by ELISpot. T-cell cytokine profiles were characterized by flow cytometry. Total RNA was extracted from blood and checked for quality before amplification, labeling, hybridization, and scanning (Affymetrix). Expression differences were calculated for each subject/time point, and difference of mean difference was assessed by one-sample Student t test. GSEA was performed using BTMs as gene sets. Probe sets were ranked based on fold-change relative to preimmunization or based on correlation between expression fold-change relative to preimmunization and HAI response. GSEA was run in preranked list mode with 1,000 permutations to generate normalized enrichment scores for the BTMs based on the distribution of member genes of each module in the ranked list.
See SI Methods for details and additional references (23–25).
SI Methods
Clinical Study.
This study was a phase II, open-labeled randomized control trial to describe immune and transcriptomic responses to TIV (Imuvac; Abbott Healthcare Products) and MF59- ATIV (Fluad; Novartis Vaccines) in 14- to 26-mo-old, healthy children (n = 90). The study was undertaken during the winter 2012–2013 influenza season (Oxford Research Ethics Committee reference no. 12/SC/0407, EudraCT no. 2012–002443). The participants were randomized to two groups at baseline to receive either TIV or ATIV. Each group was then further randomized into three subgroups where blood would be obtained on either days 1, 3, or 7 following the second vaccine dose. All participants had a final blood draw on day 28 postboost.
Sample Allocation, Prioritization, and Processing (Plasma, PBMCs, RNA, DNA).
A maximum of 6-mL heparinized blood sample was obtained at each time point, with the first 1 mL prioritized for collection in Paxgene tubes for RNA extraction (PreAnalytiX, Qiagen, BD Pharmingen). These tubes were frozen at −80 °C and shipped to Emory University, Atlanta, GA, for transcriptome analysis. An initial 100-µL aliquot of heparinized blood was removed for T-cell phenotyping (Weatherall Institute for Molecular Medicine, Medical Research Council Human Immunology Unit, Oxford, United Kingdom). All remaining heparin samples were centrifuged at 1,700 × g for 10 min and the plasma removed. The plasma was recentrifuged at 2,500 × g for 10 min to removed residual cells, split into four aliquots, and frozen at −80 °C before shipping to Novartis Vaccines Laboratories, Sienna, Italy, for HAI testing. The remaining heparin sample was resuspended in RPMI+Heparin and PBMCs isolated over Lymphoprep density gradient medium at 1,000 × g, for 30 min, break off.
HAI Assays.
Novartis Vaccine Laboratories conducted all of the HAI assays measuring titers against H1N1 (A/California/7/09), H3N2 (A/Victoria/361/11), and B (B/Hubei Wuyagdng/158/09), according to the standard procedures, described in detail elsewhere (2).
Prestimulation of PBMCs for the Memory B-Cell ELISpot Assay.
For the memory B-cell (BMEM) ELISpot Assay, PBMCs were obtained before immunization (day −28) and 1 mo after the second dose of vaccine (day 28) and seeded into round-bottom, 96-well culture plates at 2 × 10⁵ PBMCs per well in complete medium [RPMI supplemented with 10% (vol/vol) newborn bovine serum, penicillin, and streptomycin]. The cells were stimulated with a mixture of Staphylococcus aureus Cowan Strain (1:5,000), Pokeweed mitogen (83 ng/mL), and CpG-ODN-2006 1.7 µg/mL (diluted in complete medium) for 6 d at 37 °C with 5% (vol/vol) CO2 and 95% (vol/vol) humidity. Following this, cells were harvested, pooled, and washed before seeding on to ELISpot plates using complete medium.
Dual-Color ELISpot Assay for Detection of HA-Specific IgG and IgM Antibody Secreting Cells.
ELISpot plates (Millipore, MSHAN4510) were coated with 10 µg/mL each of influenza HA from H1N1 (A/California/7/09), H3N2 (A/Victoria/361/11), and B (B/Hubei Wuyagdng/158/09), all supplied by Novartis Vaccine Laboratories. The plates were coated overnight at 4 °C with mouse anti-human IgG, 2.5 µg/mL (BD Bioscience; clone G18-145, 555784) and mouse anti-human IgM, 5 µg/mL (BD Bioscience; clone JDC-15, 555856), tetanus toxoid (Tet), 5 µg/mL (Statens Serum Institute, 2674, DK), human serum albumin (HSA), 10 µg/mL (A9080, Sigma), or PBS alone. Next, the plates were washed four times with 200 µL per well of PBS. The wells were blocked for 1 h at 37 °C with 200 µL per well of PBS-1% skimmed milk. PBMCs (fresh for direct ex vivo enumeration of plasma cells or following 6-d stimulation, as described above for BMEM detection) were diluted in complete medium, were added in duplicate at 2 × 10⁵ to the Tet wells, 2 × 10⁵, 1 × 10⁵, 5 × 10⁴ to the H1N1, H3N2, B, and HSA wells, and 5 × 10⁵, 5 × 10⁴, and 5 × 10³ to the total IgG+IgM wells. The cells were incubated overnight at 37 °C with 5% (vol/vol) CO2 and 95% (vol/vol) humidity. For the three steps, dual detection of IgG-FITC-alkaline phosphatase (AP)-vector blue and IgM-HRP-AEC, the plates were then washed four times with 200 µL per well of PBS followed by four times with 200 µL per well of PBS-Tween20 at 0.05% to remove PBMCs. Secreted IgG and IgM were detected by dual-color detection. Goat anti-human polyclonal IgG-FITC (Sigma; F1641) and mouse anti-human IgM-biotin (clone G20-127; BD Biosciences) were mixed together at dilutions of 1 in 2,000 and 1 in 1,000 respectively, in PBS+4% skimmed milk. The anti–IgG-FITC/IgM-biotin mix was added at 100 µL per well and incubated at 37 °C for 4 h. The plate was then washed four times with 200 µL per well of PBS-T 0.05%. The detection reagents mouse anti–FITC-AP (Sigma; A1812) and Streptavidin-HRP were both diluted 1 in 1,000 in PBS+4% skimmed milk and 100 µL per well added and incubated at room temperature for 30 min. The plate was washed four times with PBS-T 0.05% and then IgM-HRP was stained using 100 µL per well of AEC substrate (AEC101-1KT; Sigma) as per the manufacturer’s instructions and incubated at room temperature for 30 min. The AEC substrate was removed with one wash of 200 µL per well distilled water. IgG-AP was then detected using Vector Blue substrate (SK-5300; Vector Laboratories) as per the manufacturer’s instructions, adding 100 µL per well, incubating at room temperature for 10 min and stopping with one wash of distilled water. The plates were dried overnight and red-IgM and blue-IgG spots counted on dual-color settings using AID ELR03 ELISpot reader and software v5.0sr (AID Diagnostika and Cadama Medical).
For HAI titres, the data were log-transformed and the GMT and GMR (ratio) with 95% CIs were calculated in excel. For the Ex vivo ELISpot assays, a positive responses is >four spots per million PBMCs. For the BMEM, the median IgG-ASC with interquartile ranges were plotted in PRISM. A response was defined as >fourfold rise in frequency from baseline (shown in Fig. S3).
Synthetic Peptides for T-Cell Assays.
We designed 18-amino acid peptides overlapping by 10-amino acid residues and spanning the hemagglutinin of the vaccine strain A/California/7/2009 (H1N1) pdm09-like virus and A/Victoria/361/2011 (H3N2)-like virus using the Los Alamos National Library web-based software PeptGen (www.hiv.lanl.gov/content/sequence/PEPTGEN/peptgen.html) (purity > 70%; PEPscreen; Sigma-Aldrich).
Ex Vivo IFN-γ Enzyme-Linked Immunospot (T-cell ELISPot).
PBMCs were separated from heparinized peripheral blood by density gradient centrifugation. ELISpot assays were performed using the human IFN-γ ELISpot kit (Mabtech) according to the manufacturer's instructions. Overlapping peptides were pooled such that the final concentration of each peptide used was 2 μg/mL and then added to 200,000 PBMCs per test for 16–18 h. Both tests and negative controls were run in triplicate. Negative and positive controls were run in parallel. T-cell responses above twice of the negative control mean for each donor, and 95% percentile of negative control means from the whole study (10 spot-forming cells per million) were included in the analysis and presented values in spot-forming cells per million PBMCs.
Intracellular Cytokine T-Cell Assay.
Cryopreserved PBMCs were thawed and rested overnight, then stimulated with pooled peptides at a final concentration of 10 μg/mL per individual peptide for 1 h then 2 μg/mL for an additional 14–16 h in the present of monoclonal antibodies against human CD28 (BD Pharmingen), CD49d (BD Pharmingen) at a final concentration of 2 μg/mL and GolgiPlug (Brefeldin A; Sigma) at a final concentration of 10 μg/mL Dead cells were excluded from the analysis using dead cell stain kit (Invirogen). CD4+ T cells were stained with monoclonal antibodies against human CD3 (conjugated to APC-H7, clone SK7; BD Biosciences) and CD4 (conjugated to PerCP, clone RPA-T4; BioLegend). Memory T cells were stained with monoclonal antibody against human CD45RO (conjugated to PE-Cy7, clone UCHL1; BD Biosciences). The cytokine profiles of influenza specific CD4+ T cells were measured by the expression of IFN-γ (conjugated to R-phycoerythrin, clone B27; BD Pharmingen), TNF-α (conjugated to FITC, clone 6401.1111; BD Biosciences) and IL-2 (conjugated to APC, clone 5344.111; BD Biosciences). Negative controls with no peptide stimulation were run in parallel for each sample. Cytokine responses were background subtracted. Fluorescence minus one controls were used to distinguish positive and negative populations.
RNA Isolation and Microarray Experiments.
Frozen Paxgene blood RNA samples were thawed overnight at room temperature in BSL2+ room. Total RNA was extracted following the manufacturer’s instructions (PreAnalytiX, Qiagen). All RNA samples were checked for purity using a ND-1000 spectrophotometer (NanoDrop Technologies) and for integrity by electrophoresis on a 2100 BioAnalyzer (Agilent Technologies). Two-round in vitro transcription amplification and labeling was performed starting with 50 ng intact, total RNA per sample, following the Affymetrix protocol. After hybridization on Human U133 Plus 2.0 Arrays (using GeneTitan platform, Affymetrix, or individual cartridges) for 16 h at 45 °C and 60 rpm in a Hybridization Oven 640 (Affymetrix), slides were washed and stained with a Fluidics Station 450 (Affymetrix). Scanning was performed on a seventh-generation GeneChip Scanner 3000 (Affymetrix), and Affymetrix GCOS software was used to perform image analysis and generate raw intensity data. Initial data quality was assessed by background level, 3′ labeling bias, and pairwise correlation among samples. CEL files from outlier samples were excluded and the remaining CEL files of all of the samples belonging to the same influenza season trial were grouped, and the microarray intensity data of probe sets (hereafter referred to “genes”) were normalized by RMA, which includes global background adjustment and quantile normalization.
Microarray Probe Level Processing.
Probe-level data were subject to quality control using ArrayQualityMetric Bioconductor package (23), followed by RMA background adjustment with quantile normalization and log2 transformation. Probe sets were summarized by median polish. For significance assessment, expression differences between baseline and the day of interest were calculated for each subject, and difference of mean difference across all subjects from zero was assessed by one-sample Student t test.
GSEA.
GSEA (24, 25) on preranked gene lists was performed using BTMs (13) as gene sets. Probe sets were ranked based on fold-change relative to baseline or based on correlation between expression fold-change relative to baseline and HAI response. Probe sets representing the same gene were collapsed to an extreme value (for fold-change relative to baseline analyses) or by taking the probe set with smallest P value (for correlation analyses). GSEA was then run in preranked list mode with 1,000 permutations to generate normalized enrichment scores for the BTMs based on the distribution of member genes of each module in the ranked list.
Acknowledgments
We thank Dr. Angus Goodson, Elizabeth Davies, Hannah Robinson, and Richard Sewell for assisting with the clinical trial; Amber Thompson, Jaclyn Bowman, Susan Ndimah, Karlijn De Nie, and Rebecca Sie for assisting with laboratory evaluation; and the families who participated in this study. This study was supported in part by European Commission FP7 Grant “Advanced Immunisation Technologies”; the National Institute for Health Research Oxford Biomedical Research Centre; and the Medical Research Council (to the Human Immunology Unit). Work in B.P.’s laboratory was supported by National Institutes of Health Grants U19AI090023, R37AI48638, R37DK057665, U19AI057266, and AI100663-02. H.I.N. is the recipient of a CNPq research fellowship.
Footnotes
Conflict of interest statement: R.R. and G.D.G. are full-time employees at Glaxo-Smith-Kline Vaccines. C.-A.S. is a member of several advisory committees on vaccination and has received research grants from vaccine manufacturers for preclinical and clinical research, all unrelated to this work. A.J.P. chairs the United Kingdom Department of Health’s Joint Committee on Vaccination and Immunization and the European Medicines Agency scientific advisory group on vaccines. He has previously conducted clinical trials in behalf of Oxford University funded by vaccine manufacturers, including manufacturers of influenza vaccines, but no longer does so.
See Commentary on page 1689.
This article contains supporting information online at www.pnas.org/lookup/suppl/doi:10.1073/pnas.1519690113/-/DCSupplemental.
References
- 1.Wong KK, et al. Influenza-associated pediatric deaths in the United States, 2004–2012. Pediatrics. 2013;132(5):796–804. doi: 10.1542/peds.2013-1493. [DOI] [PMC free article] [PubMed] [Google Scholar]
- 2.Vesikari T, et al. Oil-in-water emulsion adjuvant with influenza vaccine in young children. N Engl J Med. 2011;365(15):1406–1416. doi: 10.1056/NEJMoa1010331. [DOI] [PubMed] [Google Scholar]
- 3.Jefferson T, Rivetti A, Harnden A, Di Pietrantonj C, Demicheli V. Vaccines for preventing influenza in healthy children. Cochrane Database Syst Rev. 2008;(2):CD004879. doi: 10.1002/14651858.CD004879.pub3. [DOI] [PubMed] [Google Scholar]
- 4.Ritzwoller DP, et al. Effectiveness of the 2003–2004 influenza vaccine among children 6 months to 8 years of age, with 1 vs 2 doses. Pediatrics. 2005;116(1):153–159. doi: 10.1542/peds.2005-0049. [DOI] [PubMed] [Google Scholar]
- 5.Esposito S, et al. Influenza A/H1N1 MF59-adjuvanted vaccine in preterm and term children aged 6 to 23 months. Pediatrics. 2011;127(5):e1161–e1168. doi: 10.1542/peds.2010-1920. [DOI] [PubMed] [Google Scholar]
- 6.Vesikari T, Groth N, Karvonen A, Borkowski A, Pellegrini M. MF59-adjuvanted influenza vaccine (FLUAD) in children: Safety and immunogenicity following a second year seasonal vaccination. Vaccine. 2009;27(45):6291–6295. doi: 10.1016/j.vaccine.2009.02.004. [DOI] [PubMed] [Google Scholar]
- 7.Zedda L, et al. Dissecting the immune response to MF59-adjuvanted and nonadjuvanted seasonal influenza vaccines in children less than three years of age. Pediatr Infect Dis J. 2015;34(1):73–78. doi: 10.1097/INF.0000000000000465. [DOI] [PubMed] [Google Scholar]
- 8.Calabro S, et al. Vaccine adjuvants alum and MF59 induce rapid recruitment of neutrophils and monocytes that participate in antigen transport to draining lymph nodes. Vaccine. 2011;29(9):1812–1823. doi: 10.1016/j.vaccine.2010.12.090. [DOI] [PubMed] [Google Scholar]
- 9.Galli G, et al. Adjuvanted H5N1 vaccine induces early CD4+ T cell response that predicts long-term persistence of protective antibody levels. Proc Natl Acad Sci USA. 2009;106(10):3877–3882. doi: 10.1073/pnas.0813390106. [DOI] [PMC free article] [PubMed] [Google Scholar]
- 10.Khurana S, et al. MF59 adjuvant enhances diversity and affinity of antibody-mediated immune response to pandemic influenza vaccines. Sci Transl Med. 2011;3(85):85ra48. doi: 10.1126/scitranslmed.3002336. [DOI] [PMC free article] [PubMed] [Google Scholar]
- 11.O’Hagan DT, Ott GS, Nest GV, Rappuoli R, Giudice GD. The history of MF59(®) adjuvant: A phoenix that arose from the ashes. Expert Rev Vaccines. 2013;12(1):13–30. doi: 10.1586/erv.12.140. [DOI] [PubMed] [Google Scholar]
- 12.Pulendran B, Li S, Nakaya HI. Systems vaccinology. Immunity. 2010;33(4):516–529. doi: 10.1016/j.immuni.2010.10.006. [DOI] [PMC free article] [PubMed] [Google Scholar]
- 13.Li S, et al. Molecular signatures of antibody responses derived from a systems biology study of five human vaccines. Nat Immunol. 2014;15(2):195–204. doi: 10.1038/ni.2789. [DOI] [PMC free article] [PubMed] [Google Scholar]
- 14.Querec TD, et al. Systems biology approach predicts immunogenicity of the yellow fever vaccine in humans. Nat Immunol. 2009;10(1):116–125. doi: 10.1038/ni.1688. [DOI] [PMC free article] [PubMed] [Google Scholar]
- 15.Nakaya HI, et al. Systems biology of vaccination for seasonal influenza in humans. Nat Immunol. 2011;12(8):786–795. doi: 10.1038/ni.2067. [DOI] [PMC free article] [PubMed] [Google Scholar]
- 16.Furman D, et al. Apoptosis and other immune biomarkers predict influenza vaccine responsiveness. Mol Syst Biol. 2013;9:659. doi: 10.1038/msb.2013.15. [DOI] [PMC free article] [PubMed] [Google Scholar]
- 17.Cao RG, et al. Differences in antibody responses between trivalent inactivated influenza vaccine and live attenuated influenza vaccine correlate with the kinetics and magnitude of interferon signaling in children. J Infect Dis. 2014;210(2):224–233. doi: 10.1093/infdis/jiu079. [DOI] [PMC free article] [PubMed] [Google Scholar]
- 18.Black S, et al. Hemagglutination inhibition antibody titers as a correlate of protection for inactivated influenza vaccines in children. Pediatr Infect Dis J. 2011;30(12):1081–1085. doi: 10.1097/INF.0b013e3182367662. [DOI] [PubMed] [Google Scholar]
- 19.Wrammert J, et al. Rapid cloning of high-affinity human monoclonal antibodies against influenza virus. Nature. 2008;453(7195):667–671. doi: 10.1038/nature06890. [DOI] [PMC free article] [PubMed] [Google Scholar]
- 20.Tan Y, et al. Gene signatures related to B-cell proliferation predict influenza vaccine-induced antibody response. Eur J Immunol. 2014;44(1):285–295. doi: 10.1002/eji.201343657. [DOI] [PMC free article] [PubMed] [Google Scholar]
- 21.Franco LM, et al. Integrative genomic analysis of the human immune response to influenza vaccination. eLife. 2013;2:e00299. doi: 10.7554/eLife.00299. [DOI] [PMC free article] [PubMed] [Google Scholar]
- 22.Kwissa M, Nakaya HI, Oluoch H, Pulendran B. Distinct TLR adjuvants differentially stimulate systemic and local innate immune responses in nonhuman primates. Blood. 2012;119(9):2044–2055. doi: 10.1182/blood-2011-10-388579. [DOI] [PMC free article] [PubMed] [Google Scholar]
- 23.Kauffmann A, Gentleman R, Huber W. arrayQualityMetrics—A bioconductor package for quality assessment of microarray data. Bioinformatics. 2009;25(3):415–416. doi: 10.1093/bioinformatics/btn647. [DOI] [PMC free article] [PubMed] [Google Scholar]
- 24.Subramanian A, Kuehn H, Gould J, Tamayo P, Mesirov JP. GSEA-P: A desktop application for Gene Set Enrichment Analysis. Bioinformatics. 2007;23(23):3251–3253. doi: 10.1093/bioinformatics/btm369. [DOI] [PubMed] [Google Scholar]
- 25.Subramanian A, et al. Gene set enrichment analysis: A knowledge-based approach for interpreting genome-wide expression profiles. Proc Natl Acad Sci USA. 2005;102(43):15545–15550. doi: 10.1073/pnas.0506580102. [DOI] [PMC free article] [PubMed] [Google Scholar]


