Significance
Using a computational method to analyze neuronal responses evoked by natural scene stimuli, we performed a comprehensive identification of secondary visual cortex (V2) neuronal receptive fields (RFs) and found several novel spatial structures of RFs. This approach imposes no assumption about the selectivity of the neurons, thus allowing a more objective search of RFs. Furthermore, by combining single-unit recording with optical imaging of intrinsic signals, we examined the spatial distribution of V2 neurons exhibiting different RFs, with respect to the V2 stripes defined previously by cytochrome oxidase staining. The identified V2 RFs could be explained by convergence of V1 neurons with well-known primary visual cortex RFs. This study illustrates that computational approach is useful for comprehensive RF identification in higher visual cortices.
Keywords: receptive field, V2, natural images, stripes
Abstract
Visual processing depends critically on the receptive field (RF) properties of visual neurons. However, comprehensive characterization of RFs beyond the primary visual cortex (V1) remains a challenge. Here we report fine RF structures in secondary visual cortex (V2) of awake macaque monkeys, identified through a projection pursuit regression analysis of neuronal responses to natural images. We found that V2 RFs could be broadly classified as V1-like (typical Gabor-shaped subunits), ultralong (subunits with high aspect ratios), or complex-shaped (subunits with multiple oriented components). Furthermore, single-unit recordings from functional domains identified by intrinsic optical imaging showed that neurons with ultralong RFs were primarily localized within pale stripes, whereas neurons with complex-shaped RFs were more concentrated in thin stripes. Thus, by combining single-unit recording with optical imaging and a computational approach, we identified RF subunits underlying spatial feature selectivity of V2 neurons and demonstrated the functional organization of these RF properties.
Visual perception depends on processing of the input signals through multiple stages of the visual pathway. At each stage of processing, neuronal representation of the input is governed by the receptive field (RF) properties of individual cells. Characterization of neuronal RFs is a crucial step for understanding the mechanism of visual processing.
Compared with the primary visual cortex (V1), neuronal RFs in the secondary visual cortex (V2) are much less understood. Previous studies have shown that in addition to orientation and direction selectivity (1, 2), similar to that found in V1, neurons in V2 also exhibit selectivity for more complex spatial features such as angle (3–5), illusory contour (6), complex shapes (7), texture (8), and segmentation of the scene (9, 10). Given the large number of potentially relevant visual features, traditional methods using stimulus sets with parametric variation of particular visual features are not efficient for comprehensive RF characterization.
An alternative approach is to fit the stimulus–response relationship of each neuron by a parametric model. The relationship is ideally probed with large ensembles of visual stimuli, and the resulting model can be used to predict the neuronal responses to other arbitrary stimuli (11, 12). Natural stimuli are well suited for this purpose, because the visual system has evolved to process natural scenes, which contain rich spatial features that are more effective than random stimuli in eliciting cortical responses (13). Such an approach imposes no prior assumption about which stimulus features are relevant to the cell and is thus well suited for unbiased RF characterization.
In the present study, we used large ensembles of natural images to probe the neuronal responses in awake macaque monkeys and a linear–nonlinear model (14, 15) to represent the RF of each V2 neuron. The subunits of the RF models were identified by a method adapted from projection pursuit regression (PPR) (16–18), which does not require stimuli with specific statistical properties and is thus well suited for analyzing the neuronal responses to natural stimuli. Compared with other optimization methods, a distinct feature of PPR is to optimize one subunit of the RF model at a time to reduce the dimensionality of the problem. Using this method, we revealed the spatial RF structures of many V2 neurons. Furthermore, we identified cytochrome oxidase stripes of V2 by optical imaging of intrinsic signals. Data from single-unit recording were used in combination with the latter information to determine the spatial organization of cells with different RF properties with respect to the stripes of V2.
Results
Analysis of RF Subunits and Performance of the RF Model.
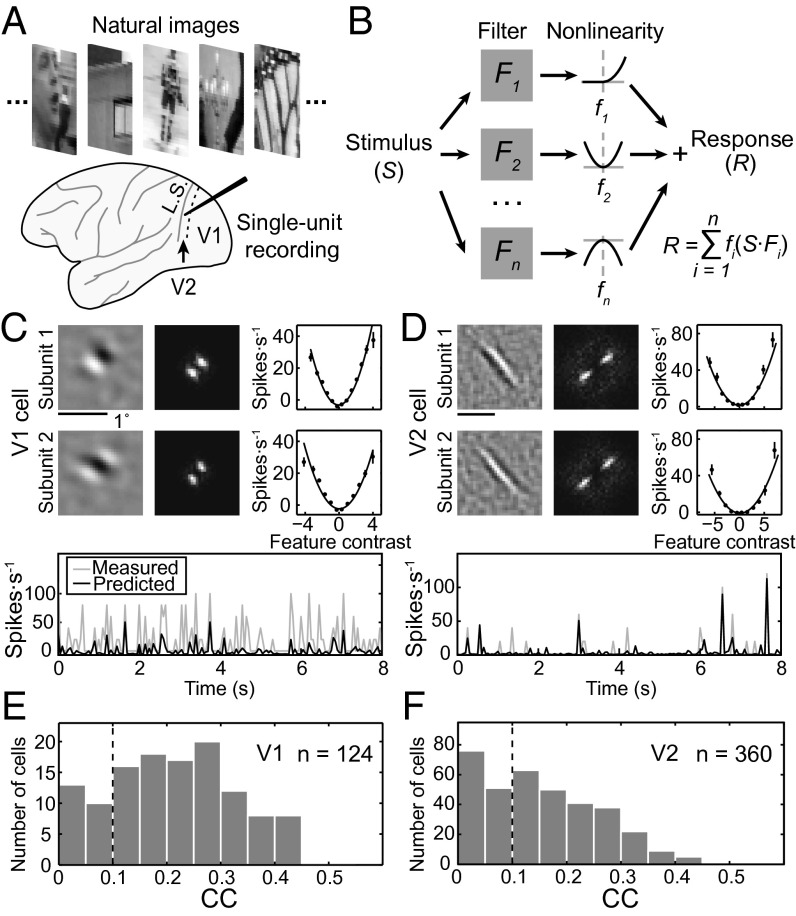
We recorded well-isolated single-unit responses of V2 (n = 360) and V1 (n = 124) neurons from four hemispheres of three macaque monkeys. The recording was made while the monkey was performing a simple fixation task, and a large ensemble of temporally random grayscale images drawn from a natural scene database (19) were presented in a region covering the RF of the recorded neuron at a rate of 20 images per second (Fig. 1A and Materials and Methods). We used a linear–nonlinear model for quantitative description of the RF for each neuron (Fig. 1B). In the RF model, the firing rate was determined by passing each image (S) through a set of linear filters (F, subunits), and the output of each filter was transformed through a static nonlinear function (f) before summation. The spatial structure of each subunit, its associated static nonlinear function, and the number of subunits were optimized by the PPR algorithm based on the recorded responses to natural images (Materials and Methods).
Fig. 1.
Analysis of RF subunits. (A) Random sequences of natural images were presented and single-unit recordings were made in either V1 or V2. L.S., lunate sulcus; dashed line, V1/V2 border. (B) Linear-nonlinear RF model. Each subunit is represented by a linear filter (Fi) depicting the spatial RF structure. S, stimulus. The response (xi = S·Fi) of each linear filter is passed through a second-order polynomial fi(xi) = ai + bixi + cixi2 before summation. n, number of subunits; i, the ith subunit; R, neuronal response. (C and D) Prediction of responses by RF models of example V1 (C) and V2 (D) cells. (Upper) Left, spatial RF; Center, spatial spectrum of RF; Right, static nonlinear function, with data points (mean ± SEM) depicting measured responses and curves representing polynomial fits of the data. (Lower) Gray, measured responses in test data set; black, model prediction. CC between measured (test data) and predicted responses was 0.38 in C and 0.37 in D. (E and F) Distribution of CCs for V1 and V2 cells. Black dashed line, threshold for all cells used for further RF analysis.
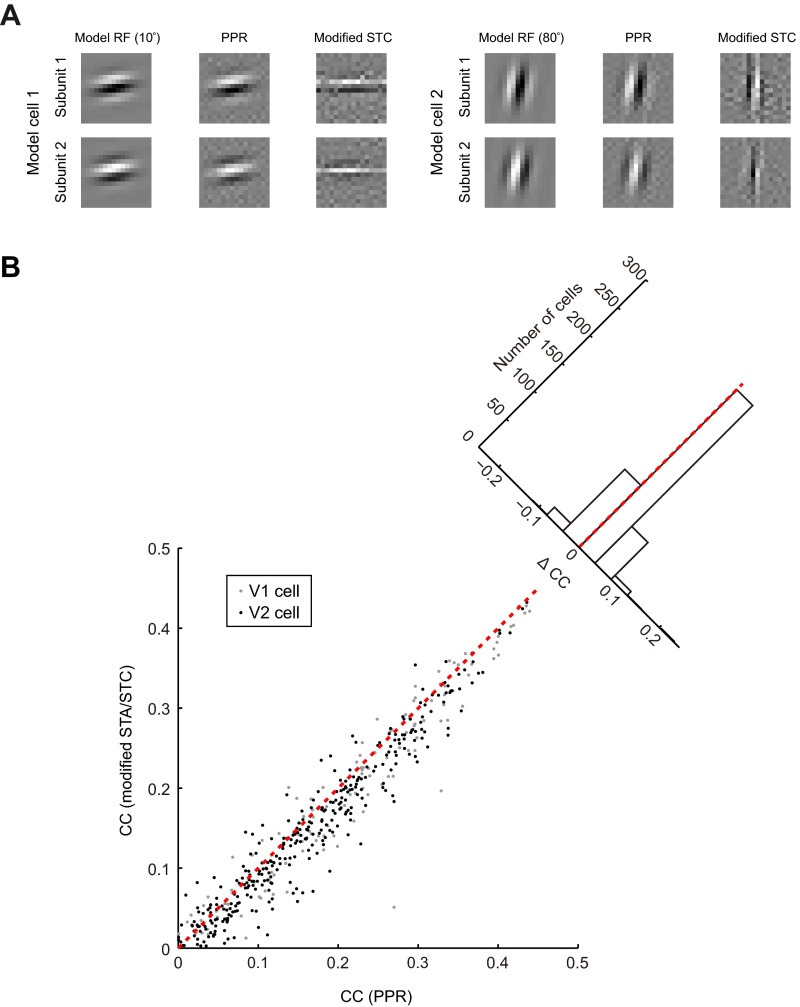
Examples of the RF models obtained by this analysis for V1 and V2 cells are shown in Fig. 1 C and D (Upper), including the subunits representing the spatial structure of the RF (Left), spatial spectrum of the subunits (Center), and the corresponding static nonlinear functions (Right). We then used the RF model of each cell to predict its responses in a test dataset obtained from the same recording session but not used for computing the RF model (Fig. 1 C and D, Lower). The performance of the model was measured by the correlation coefficient (CC) between the predicted and measured responses, and the distributions of CCs for both V1 and V2 neurons are shown in Fig. 1 E and F. The PPR method performed significantly better than the spike-triggered average/covariance analysis for natural stimuli in both simulation and experimental data (Fig. S1). For further analyses of the RF structure, only neurons with CC > 0.1 were included (223 V2 and 99 V1 cells).
Fig. S1.
Comparison of PPR with modified spike-triggered average or spike-triggered covariance (mSTA/STC) method. (A) For both model cells: (Left) RFs of model cells; (Center) RFs estimated by PPR; (Right) RFs estimated by modified STC. The distortion of RF by modified STC was most prominent when the orientation of model cell was near horizontal or vertical (e.g., orientation 10° or 80°). (B) Comparison of CCs for measured (test data) and predicted responses between RFs computed by mSTA/STC and PPR for both V1 (gray, n = 124) and V2 (black, n = 360) cells. Each dot represents one cell. Red dashed line, unit line. (Inset) Distribution of delta CC between PPR and mSTA/STC.
Spatial Structure of RF Subunits of V2 Cells.
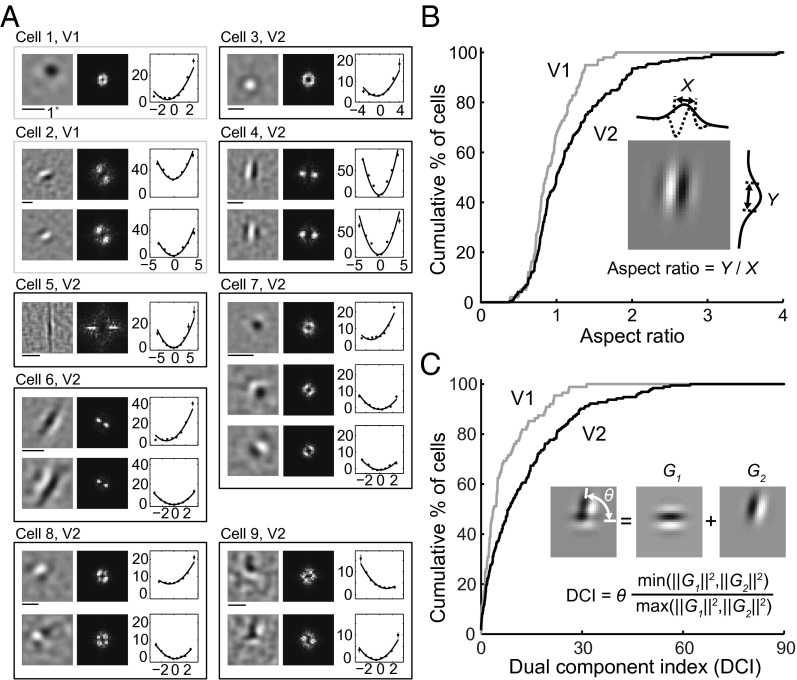
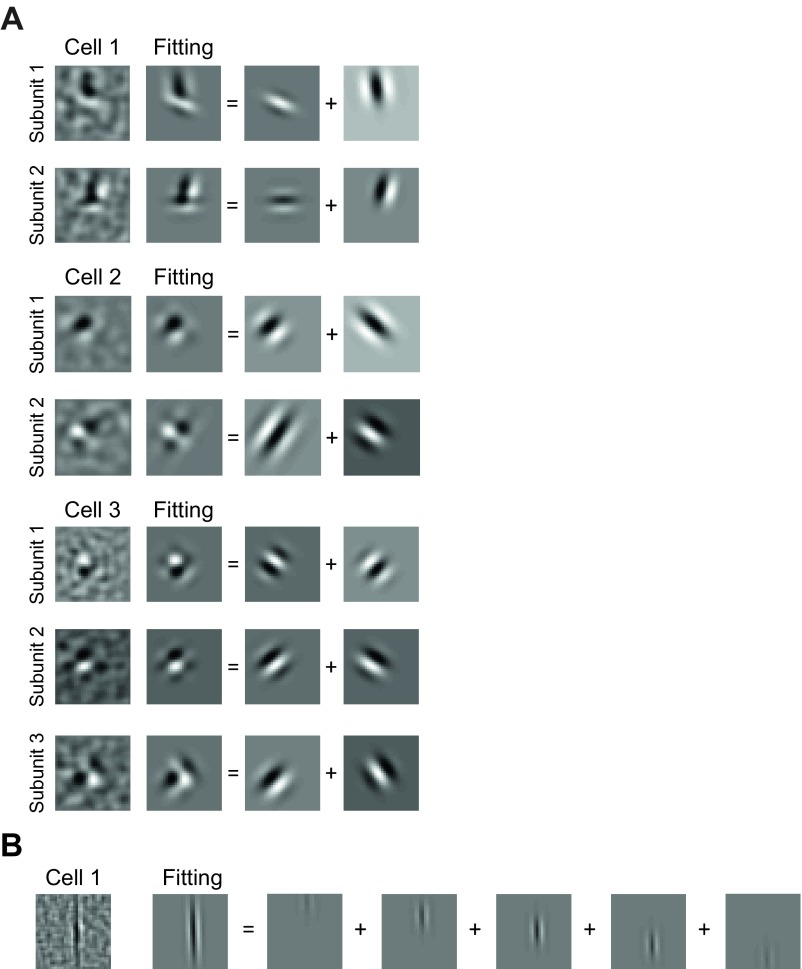
Various types of RF subunits found for V1 and V2 cells are shown in Fig. 2A, together with the spatial spectrum and associated nonlinear functions. Consistent with previous reports (20–22), we found that for most V1 neurons the RF contained multiple Gabor-like subunits of the same orientation (Fig. 2A, cell 2), whereas a small number of them were unoriented with a single center/surround subunit (cell 1), similar to that found for lateral geniculate nucleus (LGN) neurons. However, the RFs of V2 neurons were more diverse. Some of them were “V1-like,” with typical Gabor-shaped (cell 4) or unoriented (cell 3) subunits. For other neurons, although the RF subunits can also be modeled as Gabor functions, the ON/OFF subregions were much more elongated than those in typical V1 RFs (cells 5 and 6), and they were referred to as “ultralong” RFs. Furthermore, we found V2 neurons with “complex-shaped” RFs contained multiple preferred orientations (cells 7–9). Diverse complex-shaped RF structures were also reflected by the spatial spectrum of the subunits. As illustrated in Fig. S2A, these complex-shaped RF subunits could be decomposed into two Gabor functions with different orientations. These RF subunits may underlie the distinct RF properties previously reported for V2 cells, such as selectivity for combinations of orientations (3–5) and 2D translation invariance to spot stimulus (23, 24).
Fig. 2.
RF subunits identified by PPR. (A) Example V1 and V2 RFs. Each box contains subunits from one cell (gray, V1; black, V2). Cell 1, V1 cell with a center-surround subunit. Eccentricity (Ecc), 2.4°. (Left) Linear filter. (Center) RF spectrum. (Right) Nonlinear function (data points in spikes/s; error bars, SEM; curves, polynomial fits). Cell 2, V1 cell with two Gabor subunits. Ecc, 7.6°. Cell 3, V2 cell with a center-surround subunit. Ecc, 3.7°. Cell 4, V2 cell with two Gabor subunits. Ecc, 2.2°. Cells 5 and 6, V2 cells with ultralong subunits. Ecc, 2.2° and 2.1°. Cells 7–9, V2 cells with complex-shaped RF subunits. Ecc, 2°, 3°, and 3.8°. (B) Cumulative distributions of aspect ratio for V1 (n = 99) and V2 (n = 223) cells. (Inset) Gabor fit for subunit 1 of cell 4. X and Y, widths of Gaussian envelope (SD) orthogonal and parallel to the sine wave grating. AR of each cell was averaged from all excitatory subunits. (C) Cumulative distributions of DCI for V1 (n = 88) and V2 (n = 193) cells. (Inset) Fit of subunit 2 of cell 9 by sum of two Gabors (G1, G2). θ, angle between two Gabors; ‖G‖2, . The DCI of each cell was averaged from all excitatory subunits.
Fig. S2.
Illustration of decomposing V2 complex-shaped RFs and ultralong RFs into sum of Gabor functions. (A) Three example V2 cells with complex-shaped subunits, fitted by the sum of two Gabor functions. (B) An example V2 cell with ultralong RF, fitted by sum of five equal spaced Gabor functions with same size.
Quantitative Characterization of RF Structures.
To facilitate quantitative comparison between V1 and V2 neurons, we fitted their RF subunits with 2D Gabor functions. First, we fitted each subunit with a single Gabor and computed the aspect ratio (AR), defined as the ratio between the widths (SDs) of the Gaussian envelope along the axes parallel and orthogonal to the sine wave grating (Fig. 2B). The AR of each neuron was averaged for all excitatory subunits. We found that the AR distributions were significantly different between V1 and V2 neurons (Fig. 2B; P = 0.006, Kolmogorov–Smirnov test), with more V2 neurons exhibiting longer RFs (with high ARs).
Second, we fitted each subunit with the sum of two Gabor functions and quantified its complexity by a dual component index (DCI), defined as R•θ, where R is the energy ratio between the two Gabor functions (ranged from 0 to 1; Fig. 2C), and θ is the angle between the orientations of the two Gabors (ranged 0° to 90°; Fig. 2C). Large DCI indicates that the RF consists of at least two Gabors of different orientations but comparable amplitudes. Because center-surround (unoriented) subunits could also be well fitted by two orthogonal Gabor functions with similar amplitude, we identified them by fitting each subunit with a difference of Gaussians (DOG) function; a subunit was classified as center-surround if the goodness-of-fit was >4 (Materials and Methods) and excluded from the DCI analysis. The DCI of each neuron was averaged for all excitatory subunits. We found that V2 cells showed significantly higher DCI than V1 cells (Fig. 2C; P = 0.0004, Kolmogorov–Smirnov test), indicating a higher percentage of complex-shaped RFs.
Evaluation of RF Models.
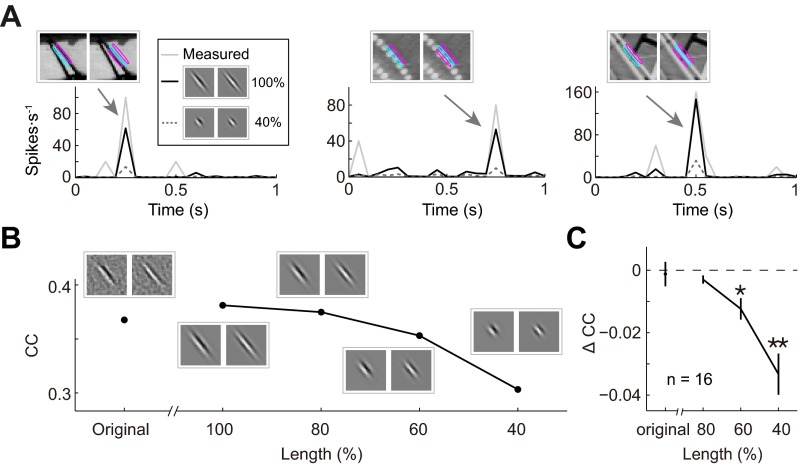
To test whether the ultralong and complex-shaped RFs obtained by PPR are functionally relevant, we tested the performance of the RF model in predicting the neuronal responses (in the test dataset) after manipulating various features of the RF subunits. For cells with ultralong RFs, we first showed that best-fit Gabor functions for the subunits well represented the RFs, with CC close to or slightly better than that of the measured RFs in predicting the neuronal responses (example in Fig. S3B and summary in Fig. S3C; P = 0.35, Wilcoxon signed-rank test). Furthermore, we found that shortening the length of this Gabor function by 60% worsened the prediction of the model, as shown by the increased deviation of the predicted from the measured responses (Fig. S3A), especially for natural image stimuli containing long edges aligned with the RF subunits (Fig. S3A, Insets). Progressive shortening of the Gabor function (from 100% to 40%) resulted in monotonic reduction of the model’s performance, as evaluated by CC (example in Fig. S3B). The summary of this analysis for all cells with AR >2 showed significant decrease of CC at 60% and 40% length (Fig. S3C; 80%, P = 0.06; 60%, P = 0.017; 40%, P = 0.0008; Wilcoxon signed-rank test). Thus, the ultralong RFs significantly contribute to the neuronal responses to natural stimuli.
Fig. S3.
Performance of RF models with ultralong subunits. (A) Prediction of responses by Gabor-fits of an ultralong RF (two subunits) and by shortened Gabors (40% of original). Arrows, example responses to the above stimuli, which was showed overlapping with RF contours. Note that all stimuli contained long edges aligned with the RF. (B) CCs between measured and predicted responses (of test dataset) by original RF subunits (computed from PPR), Gabor fits of the subunits, and progressively shortened Gabor. (C) Summary of analysis in B for all cells with AR > 2 (n = 16) by comparing the CC change with the best Gabor fits. The CC decrease is significant by shortening to 60% and 40%.
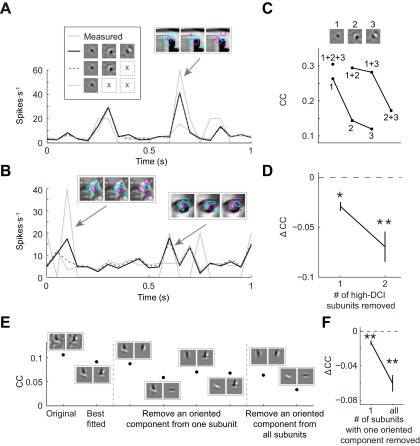
For cells with complex-shaped RF subunits, we first tested the necessity of each subunit. As shown by an example cell with three subunits in Fig. S4C, deleting any one (upper curve) or two (lower curve) of the subunits impaired the model’s performance as indicated by the decrease of CC. We also noted that the first subunit contributed much more than the second and third subunits (Fig. S4C), and the latter’s contribution was further assessed by comparing the measured responses with the predicted responses before and after their removal. We found increased deviation of the predicted from measured responses by removal of the second (Fig. S4 A, arrow, and B, right arrow) or third (Fig. S4B, left arrow) subunit, especially when the images contained spatial features that matched the complex-shaped subunits (Fig. S4 A and B, Insets). Removal of one or two high DCI subunits for high DCI cells (DCI > 30) also showed significant decrease of CC (Fig. S4D; one, P = 0.004; two, P = 0.00002, Wilcoxon signed-rank test).
Fig. S4.
Performance of RF models with complex-shaped subunits. (A–D) Prediction of responses before and after removal of subunits from cells with complex-shaped RF. (A and B) The example stimuli contained image features matched to one of the three subunits in the example V2 cell. Arrows, example responses to the above stimuli, which was showed overlapping with RF contours. (C) Three subunits of an example V2 cell are marked 1–3. Removal of the subunits reduced the CCs between measured (test data) and predicted responses. (D) Removal of one (n = 24) or two (n = 9) high DCI subunits from all high DCI cells (DCI > 30). (E and F) Prediction of responses before and after removing components of complex-shaped subunits. Removal of an oriented component from one subunit or from all subunits reduced the CCs between measured and predicted responses for an example cell (E) and all high DCI cells (F) (from one subunit, n1 = 48; from all subunits, nall = 30).
Furthermore, we tested whether each oriented component in the complex-shaped RF subunits was important. As shown in Fig. S4E, removal of an oriented component from one subunit or from all subunits of the example cell reduced the model’s performance measured by CC. Performing this analysis for all high DCI cells (DCI > 30) also showed a significant decrease of CC (Fig. S4F; P1 = 2 × 10⁻⁶, Pall = 9 × 10⁻⁶, Wilcoxon signed-rank test). Thus, the non–V1-like RF structures identified with PPR contribute significantly to V2 neuronal representation of natural images.
Organization of RFs in V2 Functional Domains.
A hallmark of neocortical circuits is the nonrandom spatial organization of neurons based on their functional properties. Previous studies on monkeys using cytochrome oxidase (CO) staining have delineated area V2 into alternating thin, pale, and thick stripes (25–27), in which color, orientation, and direction selective cells are preferentially located, respectively (1, 28–31). We next inquired whether cells with identified RF subunit structures are organized into different V2 stripes.
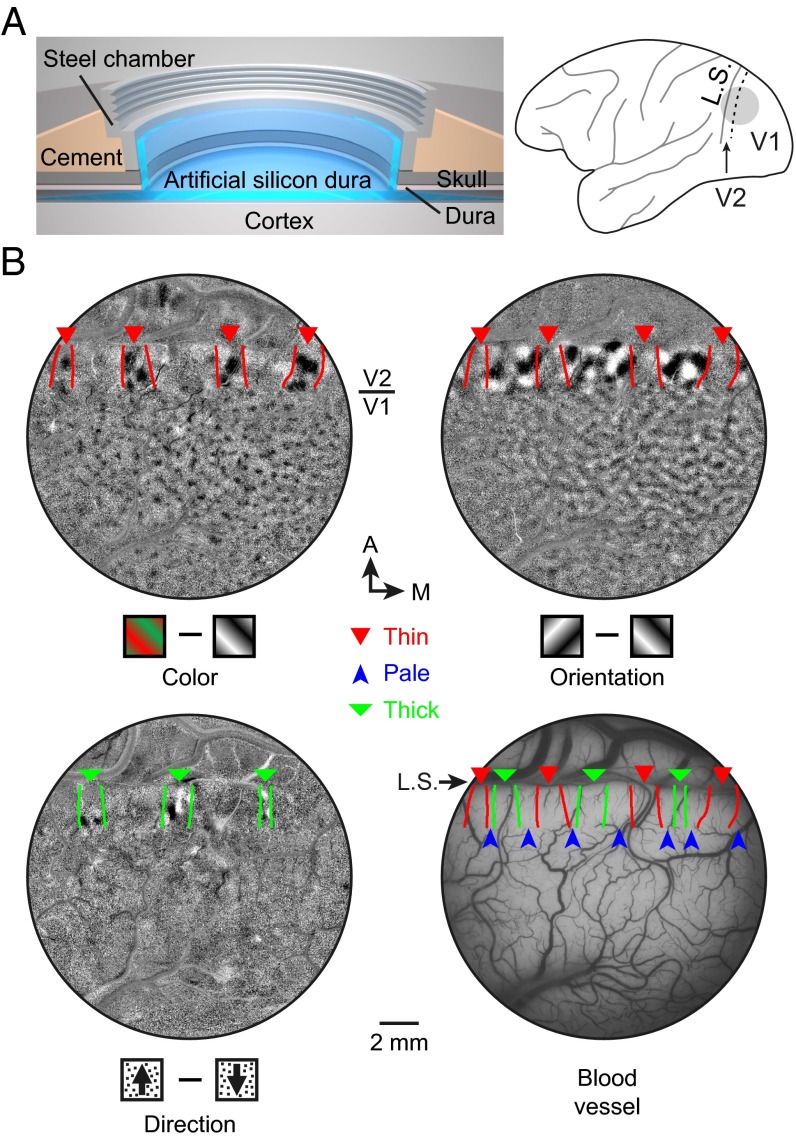
To target specific stripes for single-unit recording, we implanted a cranial chamber with penetrable artificial dura near the lunate sulcus (Fig. 3A), which allowed optical imaging of intrinsic signals and subsequent electrophysiological recordings from both V1 and V2 over a duration of 3–4 months. We measured four functional maps (color, orientation, direction, and ocular dominance) using intrinsic optical imaging under anesthesia (Fig. 3B and Fig. S5 C–F) and identified the thin (30), pale, and thick (31) stripes (Fig. 3B and Materials and Methods) that were previous identified on the basis of CO staining. The locations of 155 recorded V2 cells from three hemispheres of two monkeys were registered to the three types of stripes using blood vessels as landmarks (Materials and Methods).
Fig. 3.
Functional domains identified by optical imaging of intrinsic signals. (A) (Left) Cranial window for intrinsic optical imaging and single-unit recording. (Right) Gray circle, location of the window; dashed line, V1/V2 border; L.S., lunate sulcus. (B) Three functional maps (color, orientation, and direction) obtained by optical imaging of intrinsic signals and blood vessel pattern of the same cortical area, overlaid with expected stripe borders defined previously by cytochrome oxidase staining (Materials and Methods). Arrowheads, different stripes. A, anterior; M, medial.
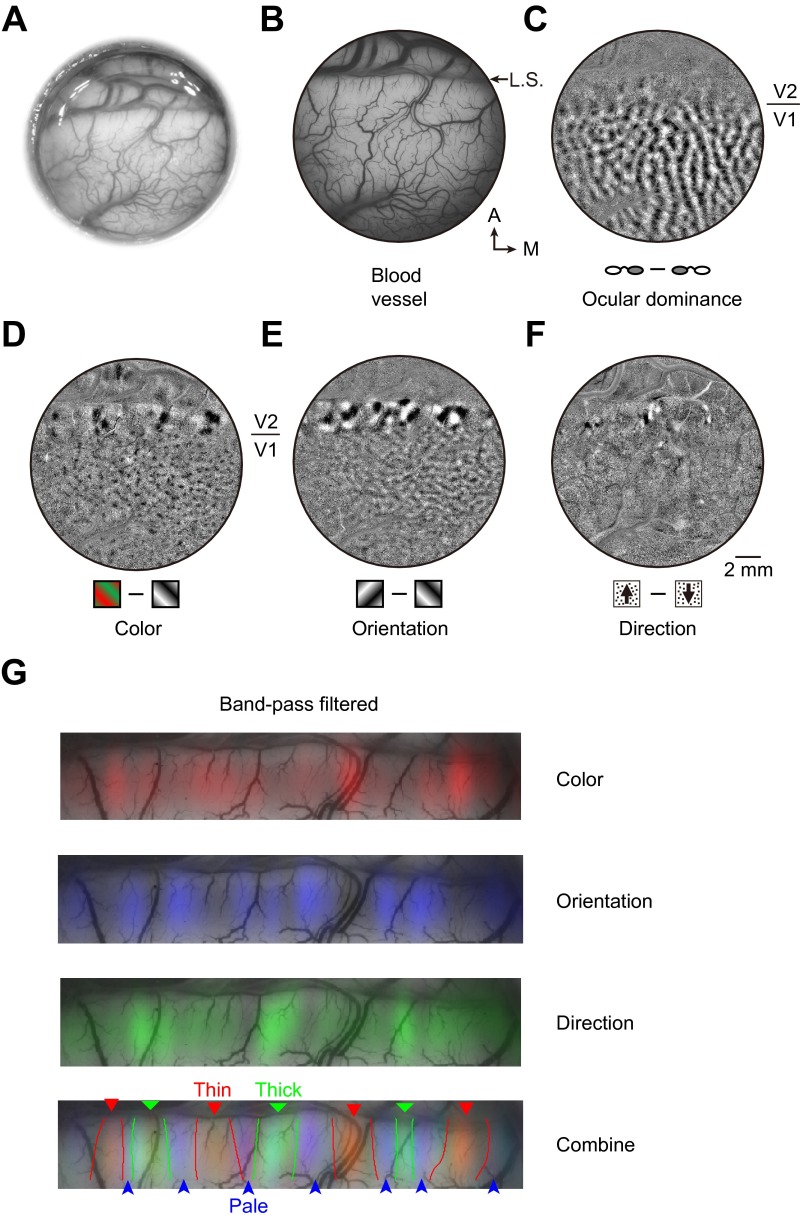
Fig. S5.
Identification of expected stripes in V2 from functional maps obtained by optical imaging of intrinsic signals. (A) Bright-field image of the cortex through the implanted window. (B) Green light image of the visual cortex showing the pattern of blood vessels. A, anterior; M, medial; L.S., lunate sulcus. (C) Ocular dominance map, which is clear in V1 but not in V2. (D) Color map shows the blobs in V1 and color preference domains within thin stripes of V2. (E) Orientation map showing orientation-selective domains in both V1 and V2. In V2, these domains are found in thick and pale stripes, complementary to the color preference domains. (F) Motion direction map, indicating direction-selective domains in thick stripes of V2. (Scale bar, 2 mm for B–F.) (G) Band-pass filtered color, orientation, and direction maps overlaid with blood vessels in V2. (Bottom) Three overlaid maps, together with estimated stripe borders (Materials and Methods).
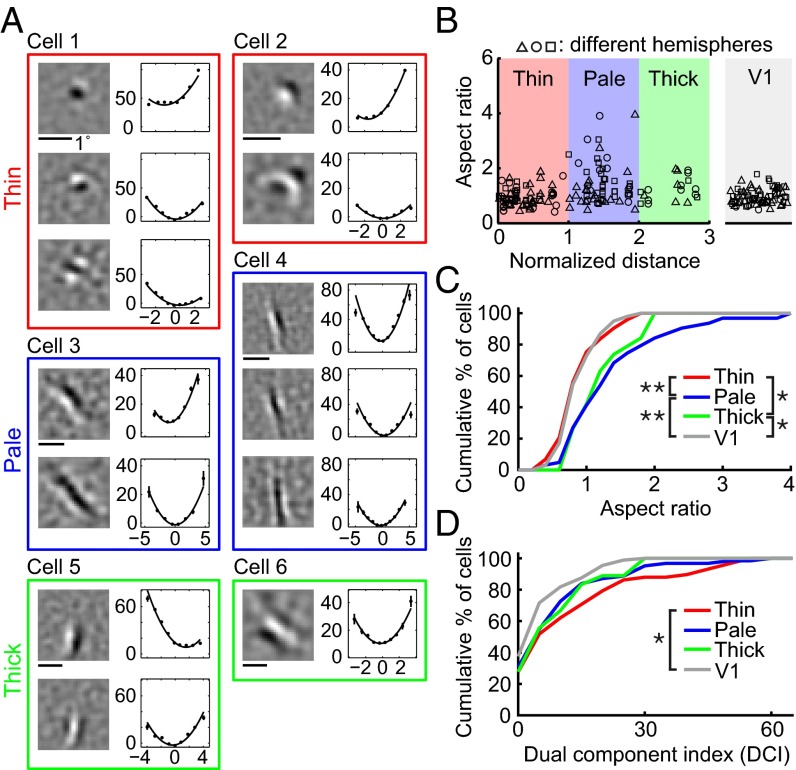
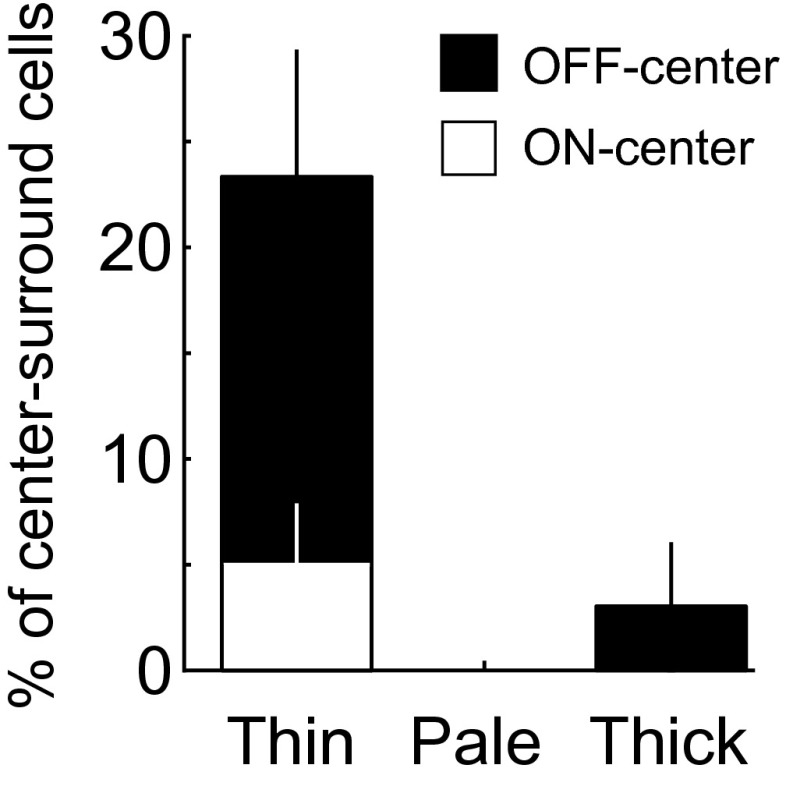
Using the same RF analysis procedures described above, we found that cells with ultralong RFs (AR > 2; Fig. 4A; cells 3 and 4) were primarily located in the pale stripes (Fig. 4B), although both pale and thick stripes contained more high AR cells than V1 as shown by the cumulative distribution of ARs (Fig. 4C; V1 vs. V2 pale stripes: P = 0.00002; V1 vs. V2 thick stripes: P = 0.03; V2 thin and pale stripes: P = 0.0001; V2 thin and thick stripes: P = 0.02; Kolmogorov–Smirnov test). On the other hand, cells with complex-shaped RFs (high DCIs, Fig. 4A; cells 1 and 2) were located preferentially in thin stripes, as shown by cumulative distribution of DCIs (Fig. 4D), and a significant difference was found between V1 and V2 thin stripes (P = 0.004, Kolmogorov–Smirnov test). Simple cells with center-surround RFs were also concentrated in thin stripes (Fig. S6). Most cells in thick stripes had V1-like RFs (Fig. 4A; cells 5 and 6), which were widely distributed in all stripes.
Fig. 4.
Organization of RF properties in V2 stripes. (A) Example RFs of six cells from thin (red), pale (blue), and thick (green) stripes. Eccentricity, 1.9°, 1.7°, 2.0°, 1.7°, 1.9°, and 0.9°. (B) (Left) Aspect ratio vs. normalized location across stripes (0, 1.5, and 3 represent center of thin, pale, and thick stripes, respectively). Data point with different symbol, aspect ratio of neuron from different hemispheres. (Right) Aspect ratios of V1 cells (randomly dispersed horizontally). (C) Cumulative distribution of aspect ratios of V1 (n = 99) and V2 cells in thin (n = 73), pale (n = 63), and thick (n = 19) stripes. Significant differences were found between V1 and V2 cells in pale or thick stripes and between V2 cells in thin and pale or thick stripes. (D) Cumulative distributions of DCI of V1 (n = 88) and V2 cells in thin (n = 58), pale (n = 62), and thick (n = 18) stripes. Significant difference was found between V1 and V2 cells in thin stripes.
Fig. S6.
Percentage of center-surround cells in different stripes. Most of these cells were located in thin stripes. Error bar, SEM (n = 3 hemispheres). Cells were defined as center-surround simple cell by two criteria: (i) containing only one subunit with half-wave-rectified nonlinear function; and (ii) the goodness-of-fit > 4 by fitting the RF with DOG function (Materials and Methods).
Discussion
Using natural stimuli and the PPR method, we found that two types of RFs are prominent in V2 of awake macaque monkeys. The ultralong RFs have eluded detection using traditional visual stimuli. The existence of such cells in the visual system has been suggested by the human psychophysical evidence that visual contrast sensitivity could be enhanced by elongating but not widening of the Gabor stimulus (32). The neurons with complex-shaped RFs presumably correspond to previously identified RFs showing preference for multiple orientations (3–5) and RFs with 2D translation invariance to spot stimulus, known as complex-unoriented (23) or spot cells (24).
The function of visual neurons could be inferred by their RF properties. Intuitively, the ultralong cells integrate stimuli over a larger area along the orientation axis and thus could facilitate the perception of illusory contours by V2 (6). From the perspective of information processing, V1 cells reduce redundancy in the coding of natural scenes by maximizing the independence of outputs across neurons (33). Independent component analysis performed on the modeled outputs of V1 to natural stimuli resulted in V2 RFs with optimal stimulus more elongated than V1 cells (34), suggesting ultralong cells found here in V2 may further improve the coding efficiency for natural images.
The complex-shaped cells may be well suited for the detection of corners or T-junctions and thus providing information for surface analysis (35) and object recognition. A previous neural network modeling study identified V2 RFs with structures similar to complex-shaped cells found here and suggested these cells provide sparse coding for natural images (36). These cells may also provide translation-invariant representation for natural images, because independent component analysis on translation-invariant representation of natural image patches resulted in double-Gabor filters (37) that are reminiscent of some of the complex-shaped cells found in this study.
In addition to the ultralong and complex-shaped RFs in V2, we also observed many V2 RFs similar to those found in LGN and V1, consistent with previous electrophysiological studies (1, 2). These V2 cells had larger RF sizes but conserved the spatial shapes that could be well represented by a wavelet function [Laplacian of Gaussian for center-surround RF (38), and Gabor for V1 RF (20)], thus functioning as part of the wavelet representation of the stimulus at a coarser scale. This suggests that RFs of such simple properties might also exist in higher cortical areas with larger RF sizes, such as V4 and IT.
As well as the RF properties described by the subunit structures, V2 neurons are also likely to exhibit other nonlinear properties that cannot be captured by the simple feedforward model, such as discrimination of border ownership (9), which may also rely on feedback signals from higher cortical areas.
To locate the V2 stripes, we used optical imaging of intrinsic signal in vivo. Further postmortem identification with CO staining was not performed because the monkeys are still alive. The colocalization of CO thin stripes and color domains of intrinsic signal was previously verified by CO staining (30), whereas other evidence from intrinsic signals suggests that direction domains fall within thick stripes (31). Based on these previous findings, our determination of thin stripes is likely to be accurate, but that of thick stripes may be an underestimate. Strictly speaking, our results reflect the preferential localization of cells with respect to functional stripes defined by intrinsic imaging rather than anatomical (CO) staining. Furthermore, the finding that different RFs are preferentially distributed in different stripes fits the idea that thin and pale stripes in V2 are part of the ventral pathway important for form processing and object recognition (39–45).
As exemplified by the findings in the early visual pathway, neurons in the retina and LGN mostly have RFs with center-surround ON/OFF regions (46), and V1 cells could integrate linearly aligned RFs of adjacent LGN neurons to form RFs with alternating on/off regions with a preferred orientation (47). Thus, characterization of the spatial structure of RFs in higher cortical areas will allow us to understand how input signals become integrated progressively through multiple stages to eventually achieve visual functions such as object recognition. Because the feedforward input of V2 originates primarily from V1 (48–51), we could infer the rule of the convergence from V1 to V2 cells from the RF properties of V2 cells. The finding that V2 RF subunits could be well fitted by the summation of multiple Gabor functions (Fig. S2) supports a simple convergence model (Fig. 5), in which each V2 neuron receives convergent inputs from several V1 cells with similar or different orientations, allowing V2 neurons to detect elongated edges, corners, and complex textures in natural scenes.
Fig. 5.
A convergence model for V2 RFs. (A) The model for V2 cells with ultralong RF subunits. Red and blue ellipse, on and off subregions. An ultralong cell may receive convergent projections from multiple V1 cells aligned along their preferred orientation. (B) The model for V2 cells with complex-shaped RF subunits. The cells may receive convergent inputs from V1 cells with different orientations at same or different center locations.
Materials and Methods
Surgical Preparation.
Three adult male macaque monkeys (Macaca mulatta) were used for this study. All procedures were in accordance with National Institutes of Health guidelines and approved by the Institutional Animal Care and Use Committee of Shanghai Institutes for Biological Sciences, Chinese Academy of Sciences. Surgery for chronic chamber installation (at lunate sulcus, ∼16 mm anterior to occipital bone ridge and ∼13 mm lateral from midline) were performed using standard sterile techniques under deep anesthesia maintained by artificial respiration of isoflurane (1–2.5%). For combined electrical and optical recording in monkeys B and C, we implanted transparent electrode-penetrable silicone “artificial dura” (inner diameter, 18 mm; Fig. 4A) (52, 53), which protected and stabilized the cortex and prevented dura regrowth for a period up to 3–4 months.
Electrophysiological Recording.
Single-unit recordings were made in both V1 and V2 of four hemispheres in three awake monkeys using glass-coated tungsten electrodes while the monkeys were doing a fixation task for a juice reward. Eye position was monitored with a remote infrared eye tracker (EYELINK II; sampling rate, 500 Hz; SR Research). Data recorded when the eye position was outside of an elliptical window (size: vertical 1.2°, horizontal 1°) were excluded. All single units presented with >12,000 images during fixation were included in the analysis (124 V1 and 360 V2 cells). The eccentricity of RFs ranges from 1° to 8°. Single units were isolated using cluster analysis of spike waveforms (Offline Sorter; Plexon) and confirmed by the refractory period in the histogram of interspike intervals.
Visual stimuli were generated with a windows-based PC, presented on a gamma-calibrated CRT monitor (Sony Multiscan G520; 30 × 40 cm, refresh rate, 100 Hz; maximum luminance, 80 cd/m2). Classical RF of each neuron was estimated using a drifting sinusoidal grating, with its spatial and temporal frequencies chosen to effectively drive the cell. Natural images (16 × 16 or 32 × 32 pixels) sampled randomly from the database of digitized movies (19) were displayed at a frame rate of 20 Hz. The mean luminance and global contrast were normalized for all selected images.
Cell Localization.
For monkey A, the identification of V1 and V2 areas was based on their retinotopic maps, and cells close to the V1/V2 border (with RF near the middle line of visual field) were excluded. The recordings from monkeys B and C were guided by optical imaging of intrinsic signals, and the precise location of the recording site was determined by injecting a small amount of dye (fast green) into the guide tube after each recording to mark the electrode location on the artificial dura. The mark was registered to the stripes identified from intrinsic imaging map, based on prominent blood vessel branch points.
Data Partitioning.
The recorded responses of each cell were randomly partitioned into training data (80%, for determining RF model) and test data (20%, for evaluating RF model obtained). Training data were further partitioned into four segments with alternating 3/4 for computing model parameters and 1/4 as validation data to determine the final RF model from multiple models derived by PPR (see below).
Linear–Nonlinear Model.
The linear–nonlinear model (14, 15, 54) used to represent the RF is
| [1] |
where R represents the stimulus-evoked firing rate of the neuron, S is the stimulus, represented by the luminance of pixels, Fi is the spatial filter of the ith subunit (with same dimension as S), and fi represents the static nonlinear function fi(xi) = ai + bi xi + ci xi2, with a, b, and c as free parameters. The parameters of the model for each cell were determined by the following least square optimization (17)
| [2] |
where r is the measured neuronal response, and R is the response predicted by the model (Eq. 1). To avoid overfitting, the second term was used to penalize the nonsmoothness of the spatial filter F, as measured by g(F) as follows:
| [3] |
where ∇2 represents a 3 × 3 Laplacian operator, and λ is a scalar parameter.
PPR.
The PPR method (16–18) used two steps to determine the RF model. In the forward step, it searched for one subunit at a time. The search started with a random filter as the first subunit by fitting the output of the subunit to the recorded response using gradient descent. Following identification of each subunit, it searched for the next subunit by fitting the residual neural responses (measured responses minus the output of all existing subunits). When the number of subunit reached the designated N (20 used in this study), the forward step was terminated. In the backward step, PPR simplified and refined the RF model. First, the subunits were sorted by their contribution to the model evaluated by their output variance. The subunits were then eliminated one at a time (starting by the one with least contribution), and the remaining subunits were refined after each elimination by fitting them with the residual neuronal response. The backward step was terminated when only one subunit was left. For each PPR computation we obtained N − 1 models from the backward step, with each model having 1 to N − 1 subunits. For each cell, we computed PPR at various λ values and two different time delays. Each model was then evaluated by CC between predicted and measured responses of 20 segments of validation data (random segmented with equal length). The final model was chosen as the one with the highest average CC, among models with the least number of subunits and CCs not significantly lower than the model with highest CCs of all models (P > 0.01, Wilcoxon signed-rank test).
Quantitative Analysis of RF Structures.
Before the analysis of the spatial RF structure, the final model for each cell was evaluated by CC between the predicted and measured responses of test data. The models with CC < 0.1 were excluded from the analysis. Further characterization of the RF subunits was done by evaluating the least square fit of all of the spatial filters of excitatory subunits with the following functions: DOG (38), 2DGabor, and sum of two 2D Gabors. The goodness-of-fit for DOG fitting was calculated as ||F||2/(||DOG − F||2) within the RF region (radius = 4 SD of the fitted DOG function), where F is the spatial RF of the cell.
Comparison of PPR Method with Other Methods.
We compared the performance of PPR method with other computational methods in characterizing V2 RFs. Our initial attempt of using maximally informative dimension (MID) method (55) yielded unsatisfactory results for RFs with multiple subunits, although its performance was good for those with a single subunit. We then turned to the modified spike-triggered average or spike-triggered covariance (mSTA/STC) method for comparison with PPR. The mSTA/STC analysis for natural stimuli have been described previously (21, 56–58). For comparison, we constructed the RF models by mSTA/STC with the same number of subunits as those from PPR for each cell. First, the filters were computed at various parameters of regularization α and two different time delays using mSTA/STC. To evaluate the importance of each filter, single-subunit models were constructed from these filters (the second-order polynomial function was estimated for each filter using training data). Then, for each α and time delay of a cell, we selected the best n filters, whose single-subunit model predicted better than others, to construct an n-subunit model, with n equal to the number of subunits of RF model resulting from PPR. The nonlinear functions were estimated again for the n-subunit model by linear regression on training data. Finally, the model for each cell was chosen as the one with the best prediction of validation data.
Optical Imaging.
The standard method (59) of optical imaging of intrinsic signals for anesthetized animal was performed on three hemispheres of two monkeys (B and C) in an 20 × 16.5- or 17 × 14-mm area of the cortex, with 654 × 540-pixel resolution. Visual stimuli were repeated for 30–50 blocks, and each block contained several sets of stimulus conditions (e.g., gratings with different orientations) and a blank screen of the same mean luminance (8 cd/m2, 8 s). Visual stimuli for optical imaging were created with ViSaGe (Cambridge Research Systems) and presented on a gamma-corrected CRT monitor (SONY CPD-G520). Full screen drifting gratings (spatial frequency, 1.5 cycle/°; temporal frequency, 8 Hz) were presented in a randomly interleaved manner in eight directions (0°, 45°,...315°) to obtain orientation and ocular dominance maps. Electromechanical shutters were used for monocular stimulation to measure ocular dominance maps. To obtain a color preference map, the stimuli comprised of red-green isoluminance sine-wave gratings and 100% contrast black-and-white gratings were presented in one of two orientations (45°, 135°) at random directions. Red Commision Internationale de L’Eclairage (CIE) values were 0.552 and 0.299; green CIE values were 0.268 and 0.530. The black-white gratings were set to have the same spatial frequency, temporal frequency, and average screen luminance as red-green gratings. Moving random white dots (0.04°) drifted at 8°/s in one of eight directions (0°, 45°,...315°) with a density of 10% of the monitor area were used to obtain direction maps.
For each stimulus condition, we first obtained single-condition maps, which represent percent changes in intrinsic signals relative to the prestimulus baseline as dR/R = (Ri − R1–3)/R1–3, where R1–3 is the average raw reflectance value of frames 1–3 (taken before stimulus onset and representative of the baseline activity), and Ri represents a single frame between frame 8 and 16. Then, these single-condition maps were used for calculating support vector machine (SVM) maps (60) (Fig. 3B and Fig. S5 C–F), which have higher signal-to-noise ratio than traditional subtraction maps. These SVM maps were band-pass filtered and normalized for determining the V2 stripe borders, defined as the contours of the cross-points between color/orientation and orientation/direction maps (Fig. S5G).
Acknowledgments
We thank Dr. Yunqing Wen, Dr. Hou Xu, Dr. Xiaodong Chen, Junjie Cai, Dr. Shude Zhu, Dr. Peichao Li, and Dr. Yu-Xi Fu for technical support and Dr. Haishan Yao and Dr. Wei Wang for comments. This work was supported by grants from Ministry of Science and Technology (973 Program, 2011CBA00400) and Chinese Academy of Sciences (Strategic Priority Research Program, XDB02020001).
Footnotes
The authors declare no conflict of interest.
This article contains supporting information online at www.pnas.org/lookup/suppl/doi:10.1073/pnas.1525505113/-/DCSupplemental.
References
- 1.Hubel DH, Livingstone MS. Segregation of form, color, and stereopsis in primate area 18. J Neurosci. 1987;7(11):3378–3415. doi: 10.1523/JNEUROSCI.07-11-03378.1987. [DOI] [PMC free article] [PubMed] [Google Scholar]
- 2.Levitt JB, Kiper DC, Movshon JA. Receptive fields and functional architecture of macaque V2. J Neurophysiol. 1994;71(6):2517–2542. doi: 10.1152/jn.1994.71.6.2517. [DOI] [PubMed] [Google Scholar]
- 3.Ito M, Komatsu H. Representation of angles embedded within contour stimuli in area V2 of macaque monkeys. J Neurosci. 2004;24(13):3313–3324. doi: 10.1523/JNEUROSCI.4364-03.2004. [DOI] [PMC free article] [PubMed] [Google Scholar]
- 4.Anzai A, Peng X, Van Essen DC. Neurons in monkey visual area V2 encode combinations of orientations. Nat Neurosci. 2007;10(10):1313–1321. doi: 10.1038/nn1975. [DOI] [PubMed] [Google Scholar]
- 5.Tao X, et al. Local sensitivity to stimulus orientation and spatial frequency within the receptive fields of neurons in visual area 2 of macaque monkeys. J Neurophysiol. 2012;107(4):1094–1110. doi: 10.1152/jn.00640.2011. [DOI] [PMC free article] [PubMed] [Google Scholar]
- 6.von der Heydt R, Peterhans E, Baumgartner G. Illusory contours and cortical neuron responses. Science. 1984;224(4654):1260–1262. doi: 10.1126/science.6539501. [DOI] [PubMed] [Google Scholar]
- 7.Hegdé J, Van Essen DC. Selectivity for complex shapes in primate visual area V2. J Neurosci. 2000;20(5):RC61. doi: 10.1523/JNEUROSCI.20-05-j0001.2000. [DOI] [PMC free article] [PubMed] [Google Scholar]
- 8.Freeman J, Ziemba CM, Heeger DJ, Simoncelli EP, Movshon JA. A functional and perceptual signature of the second visual area in primates. Nat Neurosci. 2013;16(7):974–981. doi: 10.1038/nn.3402. [DOI] [PMC free article] [PubMed] [Google Scholar]
- 9.Zhou H, Friedman HS, von der Heydt R. Coding of border ownership in monkey visual cortex. J Neurosci. 2000;20(17):6594–6611. doi: 10.1523/JNEUROSCI.20-17-06594.2000. [DOI] [PMC free article] [PubMed] [Google Scholar]
- 10.Marcus DS, Van Essen DC. Scene segmentation and attention in primate cortical areas V1 and V2. J Neurophysiol. 2002;88(5):2648–2658. doi: 10.1152/jn.00916.2001. [DOI] [PubMed] [Google Scholar]
- 11.Sharpee TO. Computational identification of receptive fields. Annu Rev Neurosci. 2013;36:103–120. doi: 10.1146/annurev-neuro-062012-170253. [DOI] [PMC free article] [PubMed] [Google Scholar]
- 12.Wu MC-K, David SV, Gallant JL. Complete functional characterization of sensory neurons by system identification. Annu Rev Neurosci. 2006;29:477–505. doi: 10.1146/annurev.neuro.29.051605.113024. [DOI] [PubMed] [Google Scholar]
- 13.Felsen G, Touryan J, Han F, Dan Y. Cortical sensitivity to visual features in natural scenes. PLoS Biol. 2005;3(10):e342. doi: 10.1371/journal.pbio.0030342. [DOI] [PMC free article] [PubMed] [Google Scholar]
- 14.de Boer R, Kuyper P. Triggered correlation. IEEE Trans Biomed Eng. 1968;15(3):169–179. doi: 10.1109/tbme.1968.4502561. [DOI] [PubMed] [Google Scholar]
- 15.Carandini M, et al. Do we know what the early visual system does? J Neurosci. 2005;25(46):10577–10597. doi: 10.1523/JNEUROSCI.3726-05.2005. [DOI] [PMC free article] [PubMed] [Google Scholar]
- 16.Friedman JH, Stuetzle W. Projection pursuit regression. J Am Stat Assoc. 1981;76(376):817–823. [Google Scholar]
- 17.Rapela J, Felsen G, Touryan J, Mendel JM, Grzywacz NM. ePPR: A new strategy for the characterization of sensory cells from input/output data. Network. 2010;21(1-2):35–90. doi: 10.3109/0954898X.2010.488714. [DOI] [PubMed] [Google Scholar]
- 18.Rapela J, Mendel JM, Grzywacz NM. Estimating nonlinear receptive fields from natural images. J Vis. 2006;6(4):441–474. doi: 10.1167/6.4.11. [DOI] [PubMed] [Google Scholar]
- 19.van Hateren JH, van der Schaaf A. Independent component filters of natural images compared with simple cells in primary visual cortex. Proc Biol Sci. 1998;265(1394):359–366. doi: 10.1098/rspb.1998.0303. [DOI] [PMC free article] [PubMed] [Google Scholar]
- 20.Jones JP, Palmer LA. An evaluation of the two-dimensional Gabor filter model of simple receptive fields in cat striate cortex. J Neurophysiol. 1987;58(6):1233–1258. doi: 10.1152/jn.1987.58.6.1233. [DOI] [PubMed] [Google Scholar]
- 21.Touryan J, Felsen G, Dan Y. Spatial structure of complex cell receptive fields measured with natural images. Neuron. 2005;45(5):781–791. doi: 10.1016/j.neuron.2005.01.029. [DOI] [PubMed] [Google Scholar]
- 22.Chen X, Han F, Poo M-M, Dan Y. Excitatory and suppressive receptive field subunits in awake monkey primary visual cortex (V1) Proc Natl Acad Sci USA. 2007;104(48):19120–19125. doi: 10.1073/pnas.0706938104. [DOI] [PMC free article] [PubMed] [Google Scholar]
- 23.Hubel DH, Livingstone MS. Complex-unoriented cells in a subregion of primate area 18. Nature. 1985;315(6017):325–327. doi: 10.1038/315325a0. [DOI] [PubMed] [Google Scholar]
- 24.Baizer JS, Robinson DL, Dow BM. Visual responses of area 18 neurons in awake, behaving monkey. J Neurophysiol. 1977;40(5):1024–1037. doi: 10.1152/jn.1977.40.5.1024. [DOI] [PubMed] [Google Scholar]
- 25.Livingstone MS, Hubel DH. Thalamic inputs to cytochrome oxidase-rich regions in monkey visual cortex. Proc Natl Acad Sci USA. 1982;79(19):6098–6101. doi: 10.1073/pnas.79.19.6098. [DOI] [PMC free article] [PubMed] [Google Scholar]
- 26.Tootell RB, Silverman MS, De Valois RL, Jacobs GH. Functional organization of the second cortical visual area in primates. Science. 1983;220(4598):737–739. doi: 10.1126/science.6301017. [DOI] [PubMed] [Google Scholar]
- 27.Horton JC. Cytochrome oxidase patches: A new cytoarchitectonic feature of monkey visual cortex. Philos Trans R Soc Lond B Biol Sci. 1984;304(1119):199–253. doi: 10.1098/rstb.1984.0021. [DOI] [PubMed] [Google Scholar]
- 28.Gegenfurtner KR, Kiper DC, Fenstemaker SB. Processing of color, form, and motion in macaque area V2. Vis Neurosci. 1996;13(1):161–172. doi: 10.1017/s0952523800007203. [DOI] [PubMed] [Google Scholar]
- 29.Shipp S, Zeki S. The functional organization of area V2, I: Specialization across stripes and layers. Vis Neurosci. 2002;19(2):187–210. doi: 10.1017/s0952523802191164. [DOI] [PubMed] [Google Scholar]
- 30.Lu HD, Roe AW. Functional organization of color domains in V1 and V2 of macaque monkey revealed by optical imaging. Cereb Cortex. 2008;18(3):516–533. doi: 10.1093/cercor/bhm081. [DOI] [PMC free article] [PubMed] [Google Scholar]
- 31.Lu HD, Chen G, Tanigawa H, Roe AW. A motion direction map in macaque V2. Neuron. 2010;68(5):1002–1013. doi: 10.1016/j.neuron.2010.11.020. [DOI] [PMC free article] [PubMed] [Google Scholar]
- 32.Polat U, Tyler CW. What pattern the eye sees best. Vision Res. 1999;39(5):887–895. doi: 10.1016/s0042-6989(98)00245-4. [DOI] [PubMed] [Google Scholar]
- 33.Bell AJ, Sejnowski TJ. The “independent components” of natural scenes are edge filters. Vision Res. 1997;37(23):3327–3338. doi: 10.1016/s0042-6989(97)00121-1. [DOI] [PMC free article] [PubMed] [Google Scholar]
- 34.Hyvärinen A, Gutmann M, Hoyer PO. Statistical model of natural stimuli predicts edge-like pooling of spatial frequency channels in V2. BMC Neurosci. 2005;6:12. doi: 10.1186/1471-2202-6-12. [DOI] [PMC free article] [PubMed] [Google Scholar]
- 35.Rubin N. The role of junctions in surface completion and contour matching. Perception. 2001;30(3):339–366. doi: 10.1068/p3173. [DOI] [PubMed] [Google Scholar]
- 36.Lee H, Ekanadham C, Ng AY. 2008. Sparse deep belief net model for visual area V2, eds Platt JC, Koller D, Singer Y, Roweis ST, Advances in Neural Information Processing Systems (Curran Associates, Red Hook, NY), Vol 20, pp 873–880. [Google Scholar]
- 37.Saremi S, Sejnowski TJ, Sharpee TO. Double-gabor filters are independent components of small translation-invariant image patches. Neural Comput. 2013;25(4):922–939. doi: 10.1162/NECO_a_00418. [DOI] [PMC free article] [PubMed] [Google Scholar]
- 38.Rodieck RW. Quantitative analysis of cat retinal ganglion cell response to visual stimuli. Vision Res. 1965;5(11):583–601. doi: 10.1016/0042-6989(65)90033-7. [DOI] [PubMed] [Google Scholar]
- 39.Ungerleider LG, Mishkin M. Two cortical visual systems. In: Ingle DJ, Goodale MA, Mansfield RJW, editors. Analysis of Visual Behavior. MIT Press; Cambridge, MA: 1982. pp. 549–586. [Google Scholar]
- 40.DeYoe EA, Felleman DJ, Van Essen DC, McClendon E. Multiple processing streams in occipitotemporal visual cortex. Nature. 1994;371(6493):151–154. doi: 10.1038/371151a0. [DOI] [PubMed] [Google Scholar]
- 41.Connor CE, Brincat SL, Pasupathy A. Transformation of shape information in the ventral pathway. Curr Opin Neurobiol. 2007;17(2):140–147. doi: 10.1016/j.conb.2007.03.002. [DOI] [PubMed] [Google Scholar]
- 42.Logothetis NK, Sheinberg DL. Visual object recognition. Annu Rev Neurosci. 1996;19:577–621. doi: 10.1146/annurev.ne.19.030196.003045. [DOI] [PubMed] [Google Scholar]
- 43.Tsao DY, Livingstone MS. Mechanisms of face perception. Annu Rev Neurosci. 2008;31:411–437. doi: 10.1146/annurev.neuro.30.051606.094238. [DOI] [PMC free article] [PubMed] [Google Scholar]
- 44.DiCarlo JJ, Zoccolan D, Rust NC. How does the brain solve visual object recognition? Neuron. 2012;73(3):415–434. doi: 10.1016/j.neuron.2012.01.010. [DOI] [PMC free article] [PubMed] [Google Scholar]
- 45.DeYoe EA, Van Essen DC. Segregation of efferent connections and receptive field properties in visual area V2 of the macaque. Nature. 1985;317(6032):58–61. doi: 10.1038/317058a0. [DOI] [PubMed] [Google Scholar]
- 46.Kuffler SW. Discharge patterns and functional organization of mammalian retina. J Neurophysiol. 1953;16(1):37–68. doi: 10.1152/jn.1953.16.1.37. [DOI] [PubMed] [Google Scholar]
- 47.Hubel DH, Wiesel TN. Receptive fields, binocular interaction and functional architecture in the cat’s visual cortex. J Physiol. 1962;160:106–154. doi: 10.1113/jphysiol.1962.sp006837. [DOI] [PMC free article] [PubMed] [Google Scholar]
- 48.Kuypers HGJM, Szwarcbart MK, Mishkin M, Rosvold HE. Occipitotemporal corticocortical connections in the rhesus monkey. Exp Neurol. 1965;11(2):245–262. doi: 10.1016/0014-4886(65)90016-6. [DOI] [PubMed] [Google Scholar]
- 49.Van Essen DC, Newsome WT, Maunsell JH, Bixby JL. The projections from striate cortex (V1) to areas V2 and V3 in the macaque monkey: Asymmetries, areal boundaries, and patchy connections. J Comp Neurol. 1986;244(4):451–480. doi: 10.1002/cne.902440405. [DOI] [PubMed] [Google Scholar]
- 50.Schiller PH, Malpeli JG. The effect of striate cortex cooling on area 18 cells in the monkey. Brain Res. 1977;126(2):366–369. doi: 10.1016/0006-8993(77)90734-x. [DOI] [PubMed] [Google Scholar]
- 51.Girard P, Bullier J. Visual activity in area V2 during reversible inactivation of area 17 in the macaque monkey. J Neurophysiol. 1989;62(6):1287–1302. doi: 10.1152/jn.1989.62.6.1287. [DOI] [PubMed] [Google Scholar]
- 52.Chen LM, et al. A chamber and artificial dura method for long-term optical imaging in the monkey. J Neurosci Methods. 2002;113(1):41–49. doi: 10.1016/s0165-0270(01)00475-7. [DOI] [PubMed] [Google Scholar]
- 53.Arieli A, Grinvald A, Slovin H. Dural substitute for long-term imaging of cortical activity in behaving monkeys and its clinical implications. J Neurosci Methods. 2002;114(2):119–133. doi: 10.1016/s0165-0270(01)00507-6. [DOI] [PubMed] [Google Scholar]
- 54.Marmarelis VZ. 2004. Nonlinear Dynamic Modeling of Physiological Systems (John Wiley & Sons, Inc., Hoboken, NJ)
- 55.Sharpee T, Rust NC, Bialek W. Analyzing neural responses to natural signals: Maximally informative dimensions. Neural Comput. 2004;16(2):223–250. doi: 10.1162/089976604322742010. [DOI] [PubMed] [Google Scholar]
- 56.Smyth D, Willmore B, Baker GE, Thompson ID, Tolhurst DJ. The receptive-field organization of simple cells in primary visual cortex of ferrets under natural scene stimulation. J Neurosci. 2003;23(11):4746–4759. doi: 10.1523/JNEUROSCI.23-11-04746.2003. [DOI] [PMC free article] [PubMed] [Google Scholar]
- 57.Woolley SMN, Gill PR, Theunissen FE. Stimulus-dependent auditory tuning results in synchronous population coding of vocalizations in the songbird midbrain. J Neurosci. 2006;26(9):2499–2512. doi: 10.1523/JNEUROSCI.3731-05.2006. [DOI] [PMC free article] [PubMed] [Google Scholar]
- 58.Sharpee TO, Miller KD, Stryker MP. On the importance of static nonlinearity in estimating spatiotemporal neural filters with natural stimuli. J Neurophysiol. 2008;99(5):2496–2509. doi: 10.1152/jn.01397.2007. [DOI] [PMC free article] [PubMed] [Google Scholar]
- 59.Li P, et al. A motion direction preference map in monkey V4. Neuron. 2013;78(2):376–388. doi: 10.1016/j.neuron.2013.02.024. [DOI] [PubMed] [Google Scholar]
- 60.Xiao Y, Rao R, Cecchi G, Kaplan E. Improved mapping of information distribution across the cortical surface with the support vector machine. Neural Netw. 2008;21(2-3):341–348. doi: 10.1016/j.neunet.2007.12.022. [DOI] [PMC free article] [PubMed] [Google Scholar]


