Significance
Cells have to spatially organize their interior to fulfill important functions. In fission yeast, this includes the concentration of polarity factors at cell ends. The molecular network that is responsible for organizing polarity factors consists of a large number of components, including proteins that travel at the ends of microtubules. In an attempt to reduce the complexity of this network, we engineered an artificial chimera protein that interacts both with microtubule ends and the membrane. As predicted by numerical simulations, this simple molecule is able to concentrate at cell ends, but the established polarity is less robust than for natural polarity factors. This finding may lead to a better understanding of the molecular mechanisms that lead to natural polarity patterns.
Keywords: cell polarity, fission yeast, microtubules, tip tracking, membrane diffusion
Abstract
Cell polarity refers to a functional spatial organization of proteins that is crucial for the control of essential cellular processes such as growth and division. To establish polarity, cells rely on elaborate regulation networks that control the distribution of proteins at the cell membrane. In fission yeast cells, a microtubule-dependent network has been identified that polarizes the distribution of signaling proteins that restricts growth to cell ends and targets the cytokinetic machinery to the middle of the cell. Although many molecular components have been shown to play a role in this network, it remains unknown which molecular functionalities are minimally required to establish a polarized protein distribution in this system. Here we show that a membrane-binding protein fragment, which distributes homogeneously in wild-type fission yeast cells, can be made to concentrate at cell ends by attaching it to a cytoplasmic microtubule end-binding protein. This concentration results in a polarized pattern of chimera proteins with a spatial extension that is very reminiscent of natural polarity patterns in fission yeast. However, chimera levels fluctuate in response to microtubule dynamics, and disruption of microtubules leads to disappearance of the pattern. Numerical simulations confirm that the combined functionality of membrane anchoring and microtubule tip affinity is in principle sufficient to create polarized patterns. Our chimera protein may thus represent a simple molecular functionality that is able to polarize the membrane, onto which additional layers of molecular complexity may be built to provide the temporal robustness that is typical of natural polarity patterns.
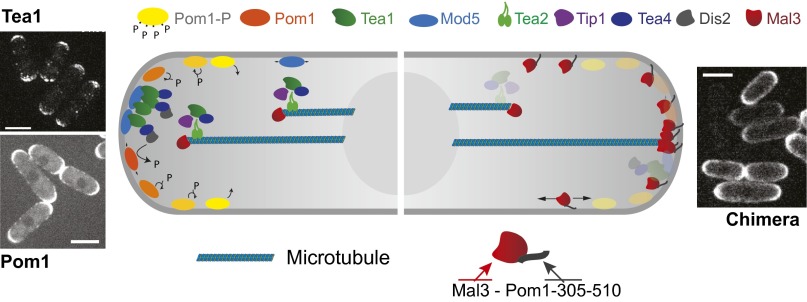
The establishment of polarity involves the accumulation of signaling proteins at specific locations at the cell periphery (1–3). In fission yeast, the establishment of polarity patterns that control cell growth and division requires, in addition to the presence of microtubules (4), an elaborate regulation network with a large number of molecular components (5, 6) (Fig. 1, Left). In these cells, microtubules are organized into three to four antiparallel bundles that are mechanically aligned along the long axis of the cells, thereby targeting growing microtubule tips to the cell poles (7). Microtubule plus-end–tracking proteins (+TIPs), such as the end-binding (EB) protein Mal3, mediate the active transport of polarity factors toward cell ends: the polarity factors Tea1 and Tea4, which control cell growth (6, 8, 9), interact with Mal3, the microtubule regulator Tip1 (homolog of CLIP-170), and the kinesin-7 Tea2 (10) at microtubule tips and are thus targeted to the cell poles. At the cell poles, Tea1 and Tea4 interact with the membrane-bound anchoring protein Mod5 (11), whose localization at cell poles is itself Tea1 dependent. Tea1 polarization thus appears to be the result of the intricate interplay between cytoskeletal transport, organization of the microtubule cytoskeleton, and Mod5-mediated interaction with the membrane. The relatively stable Tea1/Tea4 mark at the membrane is subsequently used as the source of a diffusive membrane–protein gradient (Fig. 1, Left): the DYRK-family member kinase Pom1, which links cell length to mitotic commitment, displays a polar cortical gradient (12, 13). Local long-lived Tea1–Tea4 complexes trigger the association of Pom1 with the plasma membrane by recruiting the protein phosphatase 1 (PP1) Dis2, which dephosphorylates Pom1, thereby locally increasing Pom1 affinity for the membrane (14). Diffusion on the membrane of dephosphorylated Pom1, followed by autophosphorylation and detachment from the membrane, then establishes a cortical gradient (14).
Fig. 1.
Protein polarization networks in fission yeast (schematic). (Left) The polarity factors Tea1 (upper left picture) and Tea4 are transported at microtubule tips toward the cell pole. The membrane-bound protein Mod5 mediates the recruitment of Tea1/Tea4 aggregates at cell poles. Tea1–Tea4 complexes recruit Pom1 to the plasma membrane via local dephosphorylation by Dis2. Diffusion of Pom1 followed by autophosphorylation and subsequent unbinding leads to a concentration gradient at the membrane (lower left picture). Yellow-to-orange color code indicates Pom1 phosphorylation state. Adapted from ref. 14 with permission from Elsevier; www.sciencedirect.com/science/journal/00928674. (Right) The chimera protein Mal3-Pom1-305–510 diffuses in the plasma membrane and interacts with microtubule tips that are in contact with the cortex. The prolonged contact time of microtubule tips with the cortex at cell poles leads to a polarized distribution of the chimera protein (right picture). Note that in these experiments all polarity factors shown on the left are also present in the background. (Scale bars, 4 μm.)
The elaborate network of polarity factors described above provides a robust signaling network that is able to perform a number of cellular functions simultaneously in a reliable way. Its dynamic properties are such that new polarization zones can be defined with the help of microtubules when needed (15), whereas existing polarization zones are robust against the temporary disappearance of microtubules (16). How the spatiotemporal properties emerge from the design of the network remains, however, largely unknown. Specifically, it is not clear which molecular interactions are essential for spatially defining a polarization zone in the membrane and which interactions are essential for its specific dynamic properties. Due to the large number of network components and the largely unknown (nonlinear) feedback mechanisms between them, it is nontrivial to establish a quantitative model-based understanding that on the one hand captures the complexity of the system, and, on the other hand, allows for simple insights in the basic requirements for polarization. Here we adopt a reductionist experimental approach (17, 18) by first looking for a simple molecular mechanism that is able to spatially define microtubule-dependent polarization patterns in the membrane. With this approach, we aim to reveal basic molecular mechanisms underlying polarization networks in fission yeast cells, which can then help to understand the mechanistic role of additional layers of molecular complexity in this system.
Results
A Chimera Protein That Combines Membrane Binding with Microtubule Tip Affinity.
We hypothesized that a combination of microtubule tip affinity and the ability to associate with, and diffuse in, the membrane provides a basic mechanistic core of the complex polarization scheme presented in Fig. 1 (Left). It is known that most membrane-bound components depicted in Fig. 1 (Left) are able to physically interact with components associated with microtubule tips (4), effectively leading to an interaction between these membrane components and microtubule tips. We thus decided to express an artificial chimera protein that combines these two basic properties in wild-type (WT) cells (Fig. 1, Right). Our first idea was to use the end-binding protein dependent microtubule tip-targeting activity of the so-called SxIP motif (19), even though we were unaware of any reports of +TIPs that use this motif in fission yeast cells. Unfortunately, we did not succeed in expressing a simple +TIP that was functional based on this motif. We therefore chose to use the microtubule tip-tracking activity of Mal3 itself, because it is well established that Mal3 is an autonomous microtubule tip tracker (20). GFP-tagged Mal3 is furthermore able to successfully interact with microtubules tips in a background of WT Mal3 in fission yeast cells (21, 22) (Fig. 2E). We also chose Mal3 because GFP-tagged Mal3 is never observed to associate with the membrane in WT cells (Movie S1), despite the cortical presence of proteins such as Tea1 and Tip1 with whom Mal3 colocalizes at growing microtubule tips (10, 16, 22). We therefore did not expect Mal3 to interact with WT polarity factors at the membrane independently of microtubules.
Fig. 2.
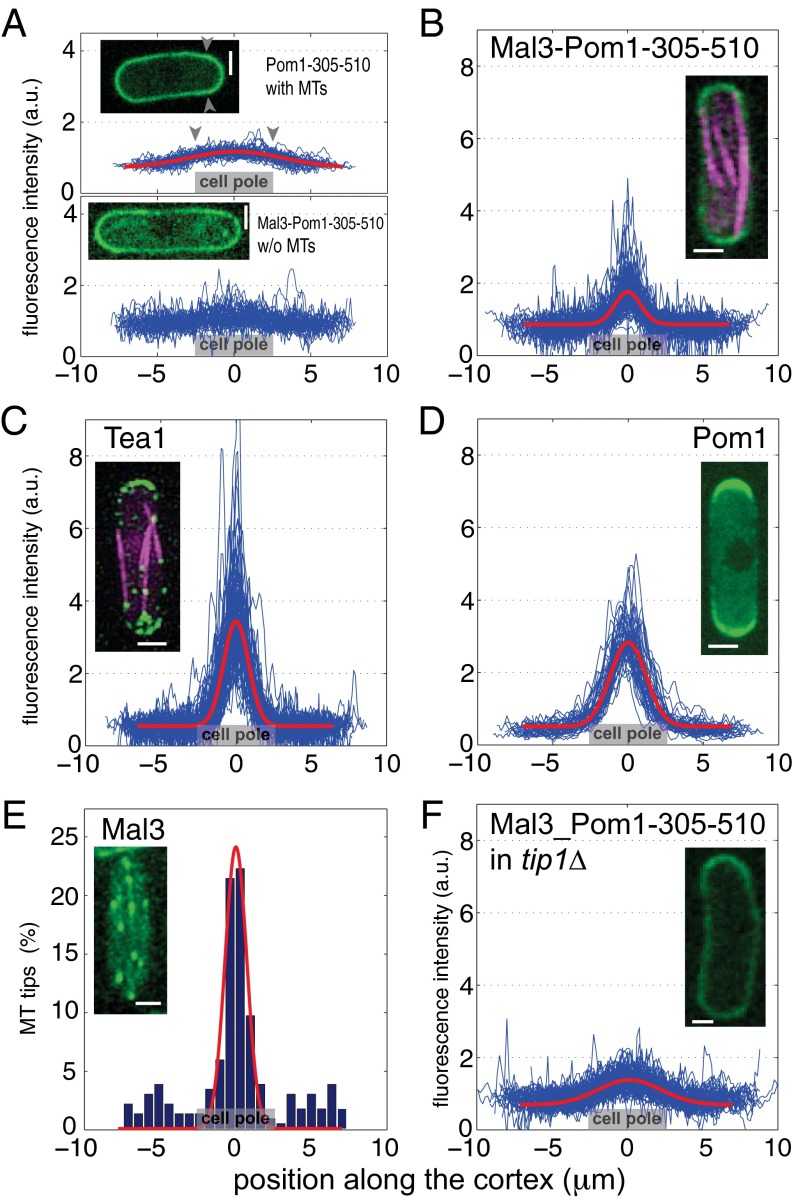
The chimera protein Mal3-Pom1-305–510 polarizes in WT fission yeast. (A, Upper) Cortical localization of the GFP-tagged membrane binding fragment Pom1-305–510 (number of cells analyzed, n = 49). The gray arrowheads point to the edges of the cell pole region, indicated also by a gray box in the profile plots. Here, as well as in B–D, the normalized cortical fluorescence intensities as a function of distance to the cell poles are plotted in blue for individual cells. In red, a Gaussian fit to the averaged intensity over all cells is shown, providing a measure w = 8.7 μm for the width of the profile. (Lower) Chimera protein Mal3-Pom1-305–510 in the absence of microtubules (MTs) (n = 67), showing a nearly flat distribution. (B) In the presence of microtubules, the chimera protein Mal3-Pom1-305–510 is enriched in a region that extends over a narrow distance w = 2.4 μm around the cell poles (n = 105). (C) The polarity factor Tea1 exhibits a similarly polarized distribution (w = 2.3 μm) around cell poles (n = 73). (D) The full-length Pom1 protein exhibits a cortical concentration gradient that extends over a distance w = 3.4 μm. Images courtesy of Sergio Rincon (n = 47). (E) Occurrence of microtubule tips (located by GFP-Mal3 comets) in contact with the cortex as a function of the distance to the cell poles. In red, a Gaussian fit to tip occurrence at the cell poles is shown. Tip density is significantly increased in a region of w = 1.4 μm around the cell poles (n = 100). (F) In tip1Δ cells, the chimera protein distribution is broadened. The typical width of the polarization profile is w = 5.9 μm compared with 2.4 μm for WT cells (n = 101). (Scale bars, 2 μm.)
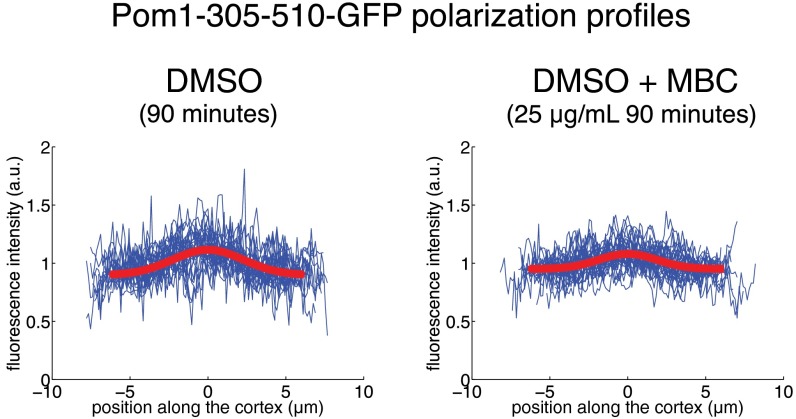
For the ability to associate with the membrane, we chose the membrane binding fragment of Pom1, Pom1-305–510, which cannot be phosphorylated and does not polarize significantly on its own, even in the presence of full-length Pom1 (14). To assess the distribution of this membrane-binding fragment in the absence of any Mal3-mediated interaction with microtubules, we analyzed the cortical distribution of the GFP-tagged Pom1-305–510 fragment in otherwise WT cells. The fluorescence signal along the cortex was measured with a confocal spinning disk microscope in the central 1-µm-high section of several tens of cells (Methods). After background subtraction, we normalized the fluorescence signal for each cell with the average measured intensity along the cortex to be able to compare profile shapes in cells with different expression levels, as well as cells imaged under different conditions. When averaged over all cells, this analysis (Fig. 2A, Upper, blue) revealed a slightly higher concentration of the Pom1-305–510 fragment at the poles than at the cell sides, consistent with previous reports (14), and likely due to interactions of the fragment with heterogeneously distributed phospholipids in the plasma membrane (14, 23). This increased concentration of the fragment was, however, broadly spread over the cell cortex. A Gaussian fit to the average intensity provides a measure for the width of the profile: w = 8.7 µm (Fig. 2A and Methods). Because this width is much larger than the perimeter of the medial cell pole (5.1 ± 0.4 μm; see gray arrowheads in Fig. 2A), we do not refer to this distribution as polarized [again consistent with previous reports (14)]. Importantly, this Pom1-305–510 fragment distribution was not sensitive to the presence of microtubules because it was not altered by microtubule depolymerization with methyl benzimidazol-2yl carbamate (MBC) (Fig. S1).
Fig. S1.
Effect of microtubule destabilization on pom1-305–510-GFP localization. Fission yeast cells expressing the membrane-binding domain of Pom1 coupled with GFP were treated with the microtubule-destabilizing drug MBC. After 90 min of incubation (Right), the cortical distribution of Pom1-305–510 was undistinguishable from cells not treated with MBC (Left).
The Cortical Distribution of the Chimera Protein Is Polarized.
When we connected the Pom1 fragment to full-length Mal3, we observed that, in the absence of microtubules, the chimera protein exhibited a cortical distribution similar to Pom1-305–510 alone (Fig. 2A, Lower). This result shows that association of the Pom1 fragment with the membrane is not affected by the connection to Mal3. However, in the presence of microtubules, the intensity was clearly higher at the cell poles than at the cell sides (Fig. 2B). In the averaged profile, the fluorescence intensity was increased in a 2.4-μm-wide region around the cell poles, with a ratio of average intensity at the cell pole to that at the cell side of 1.9. The polarized chimera distribution we observed in the presence of microtubules combined with the observation that GFP-tagged Mal3 did not associate with cortical factors (Movie S1) suggests that the Mal3 fragment is able to interact directly with microtubule tips while anchored to the membrane by the Pom1-305–510 fragment. Note that we could not detect any chimera proteins associated with the tips of microtubules in the cytoplasm, as is the case for GFP-Mal3 alone (Fig. 2E). A plausible explanation is that, due to the strong interaction with the membrane, there is very little chimera protein available for microtubule tip tracking in the cytoplasm.
The width of the chimera profile in the presence of microtubules was similar to that of GFP-tagged Tea1 (Figs. 1, Upper Left, and 2C), for which we found a width of 2.3 μm. The intensity ratio for Tea1 was, however, 6.3, showing that the total amount of chimera protein that becomes polarized was lower than for Tea1. We also compared with the WT Pom1 profile: here we found a slightly broader profile width of 3.4 μm and an intensity ratio of 5.6 (Fig. 2D). These results demonstrate that the chimera protein Mal3-Pom1-305–510 displays a polarized distribution whose spatial extension is similar to that of WT Tea1, even though it appears to retain no other functionalities than the ability to interact with the membrane and growing microtubule tips. This polarized distribution is lost when Mal3 is removed from the chimera (see above), even in the background of WT cells, where natural polarity factors such as Tea1 are polarized.
The Cortical Distribution of the Chimera Protein Reflects the Distribution of Microtubule Contact Points.
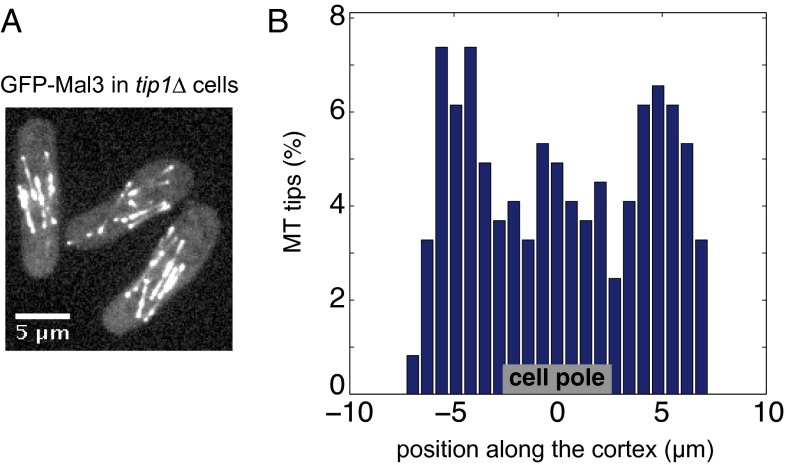
To further establish the relation between the distribution of the chimera protein and the presence of microtubule tips, we measured the fluorescence signal at the cell cortex in cells expressing GFP-Mal3 and confirmed that microtubule tips were inhomogeneously distributed along the cortex. Their density was significantly increased in a 1.4-µm-wide region around the cell ends (Fig. 2E), where microtubules are known to stall for about 60–100 s before undergoing a catastrophe (24, 25). We next examined the distribution of GFP-tagged Mal3-Pom1-305–510 in the background of a tip1 deletion (10). In tip1Δ cells, microtubules are shorter, and most of their tips fail to reach the cell pole region (Fig. S2). As anticipated, the distribution of cortical Mal3-Pom1-305–510 was broadened in these cells (Fig. 2F): the profile width was 5.9 µm (with an intensity ratio of 1.9). These experiments show that polarization of the chimera protein directly depends on the cortical distribution of microtubule tips in the cell. It is important to note that in tip1Δ cells, most microtubule-dependent polarity factors including Tea1 fail to accumulate at cell ends (10). The fact that Mal3-Pom1-305–510 still polarizes to some extent in these cells further supports the idea that a direct interaction with microtubule tips is responsible for the ability of the chimera to polarize in WT cells.
Fig. S2.
Microtubule tips in tip1Δ cells. (A) GFP-Mal3 signal in tip1Δ cells. In cells lacking the microtubule regulator Tip1, microtubules appear shorter than in WT cells, and most of their tips fail to reach cell ends. (B) Cortical distribution of microtubule tips in tip1Δ cells (number of cells analyzed = 127). Contrary to WT cells, microtubule tips do not appear significantly enriched at cell poles, although a slight increase is visible. GFP-Mal3 spots are detected as described in the main text. Note that the tip density appears higher in the middle of the cells because of the detection of false tips that are due to microtubules that grow parallel to the cortex.
The Cortical Chimera Distribution Is Sensitive to Microtubule Depolymerization.
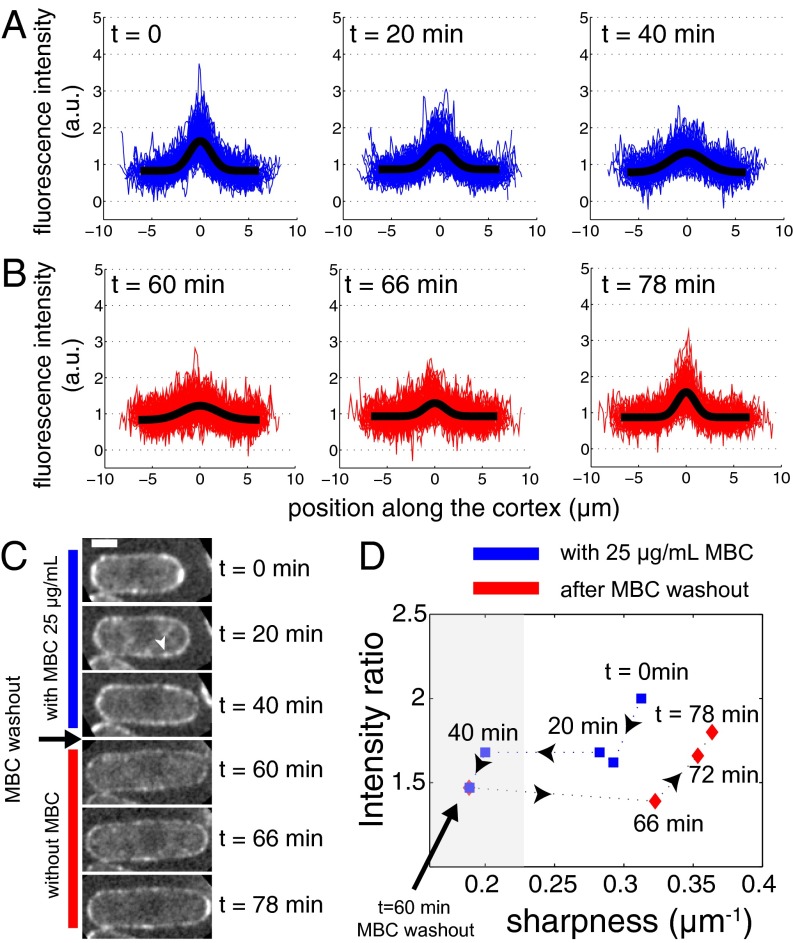
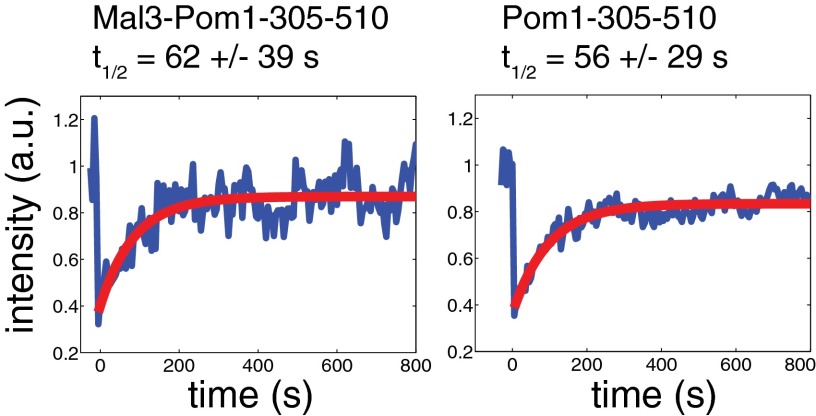
Treatment of fission yeast cells with MBC leads to microtubule depolymerization in less than a minute. Although MBC treatment did not induce any change in the cortical distribution of Pom1-305–510 (Fig. S1), we observed a gradual disappearance of the polarization of the chimera protein on addition of MBC (Fig. 3A). Interestingly, there was a fast decrease in the height of the polarization profile at short timescales (within 10 min), with the profile width remaining approximately constant, whereas over longer timescales, we observed a broadening of the profile combined with a further decrease in the height. This observation suggests the existence of two different species: a fast diffusing one that spreads over the cell cortex rapidly after microtubule depolymerization, and a slow diffusing species that loses its polarized distribution over a timescale of tens of minutes (Fig. 3 C and D). The coexistence of slow and fast diffusing species was previously also reported for full-length Pom1 based on fluorescence correlation spectroscopy (FCS) measurements (26). In fact, experiments performed on both the chimera protein and Pom1-305–510 (Fig. S3) gave very similar recovery times to those obtained for full-length Pom1 (26). Possibly, this reflects an intrinsic clustering ability of Pom1 proteins/fragments. After 60 min, we washed out the drug and followed the reappearance of the polarized cortical profile over time (Fig. 3B). Dynamic microtubules reappeared within 2 min (observed by coimaging cells expressing GFP-tubulin). Six minutes after drug washout, we could observe sharpening of the cortical profile, from 5.3 to 3.1 μm (Fig. 3 B and C). Eighteen minutes after drug washout, a fully polarized chimera distribution was restored (Fig. 3D). This recovery of the polarization is consistent with the diffusing chimera interacting with reappearing microtubules (see below).
Fig. 3.
Mal3-Pom1-305–510 polarization is sensitive to the presence of microtubules. (A) From Left to Right, time evolution of the chimera protein distribution after injection of 25 μg/mL of the microtubule-depolymerizing drug MBC at time t = 0 min. The intensity of Mal3-Pom1-305–510-GFP in a medial slice as a function of the distance to cell pole is plotted (in blue) for n = 71 cells. In black, a Gaussian fit to the averaged fluorescence intensity over all cells is shown. Microtubule depolymerization induces the gradual disappearance of the polarized pattern. The chimera concentration profile broadens from an initial value of w = 3.1 μm to w = 3.6 μm after 20 min and w = 5.1 μm after 40 min. At the same time, the intensity ratio decreases from 2.0 to 1.7. (B) After 1 h of incubation with MBC, the drug is washed out of the flow chamber. After 6 min (t = 66 min), the width of the profile is 3.1 μm compared with the initial 5.3 μm. After 18 min, this is further reduced to 2.7 μm. (C) Snapshots of the time evolution of the chimera distribution for a single cell in its central slice. Arrowheads point to apparent protein clusters. (Scale bar, 2 μm.) (D) Time evolution of cortical profile parameters during MBC treatment (blue) and after MBC washout (red). Sharpness is defined as the inverse of the profile width. Low values for sharpness correspond to absence of polarity (gray area).
Fig. S3.
FRAP analysis of the membrane bound proteins Mal3-Pom1-305–510-GFP and Pom1-305–510-GFP. Mal3-Pom1-305–510-GFP and Pom1-305–510-GFP signals were selectively bleached at cell poles and fluorescence recovery was measured in this region. We observed similar behaviors for these two constructs: an incomplete recovery with a typical timescale around 60 s. The two constructs are presumably no longer able to autophosphorylate to promote dissociation from the membrane (14), and we therefore imagine FRAP recovery to be the result of diffusion in the membrane rather than exchange with the cytoplasm, as was proposed for full length Pom1 (26). Given the incomplete fluorescence recovery, it is possible that these FRAP results reflect the diffusive dynamics of a fast diffusing (monomeric?) species and do not report on the dynamics of a slowly diffusing species that limits the diffusive disappearance of the cortical profile in our experiments.
Possible Requirement for Other Polarity Factors.
It is important to note that most natural polarity factors are sensitive to microtubule depolymerization as well. Therefore, one possible way to explain our results would be to assume that the Mal3 fragment of the chimera protein polarizes via interactions with other polarity factors in the membrane, and not (only) via interactions with microtubule tips. Loss of the polarized chimera distribution on microtubule depolymerization would then be the result of the loss of a polarized distribution of these other polarity factors. As explained above, several observations argue against this explanation: (i) GFP-Mal3 is never observed to associate with polarity factors in the membrane in WT cells, even though it quickly exchanges between growing microtubule tips and a cytoplasmic pool (Movie S1 and Fig. 2E); (ii) the Pom1 fragment is not able to polarize in WT cells even though polarized full-length Pom1 is present in the background; (iii) partial chimera polarization is established in the complete absence of Tip1, a condition under which other polarity factors such as Tea1 fail to associate with microtubule tips or cell ends (10); and (iv) the spatiotemporal dynamics of the polarity loss of the chimera on microtubule depolymerization is very different from that of proteins such as Tea1 (5).
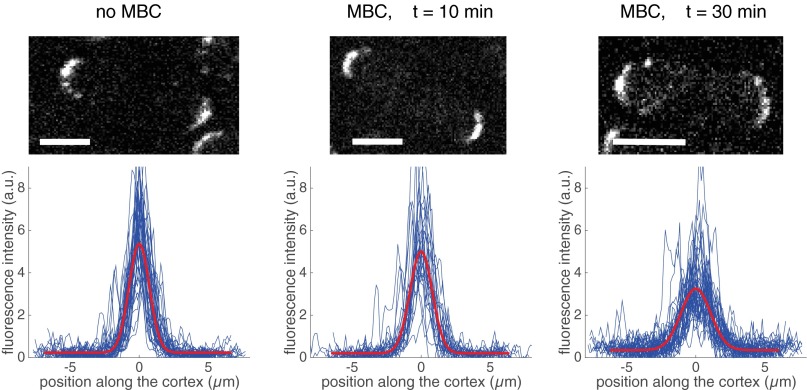
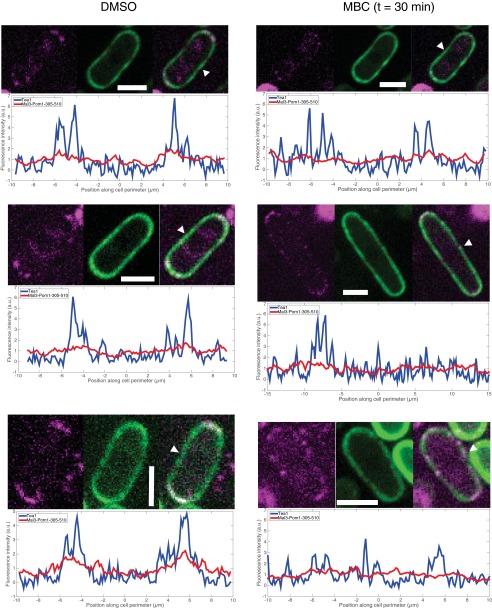
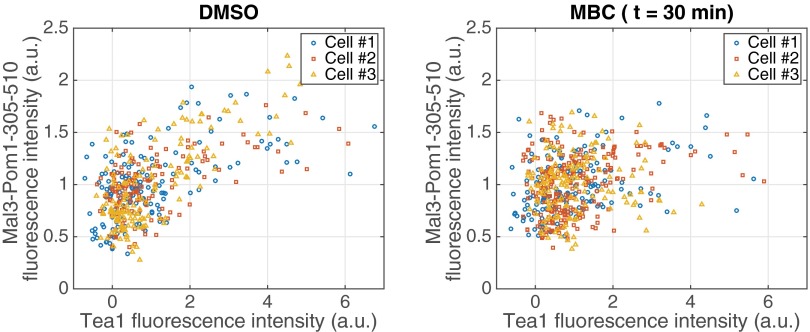
To reconfirm this last point, we measured intensity profiles in cells expressing Tea1-tdTomato, in the absence of WT Tea1 (5) (Fig. S4). After 10 min of MBC treatment, almost no change in Tea1 polarization was observed. After 30 min of MBC treatment, the average Tea1 signal at the cell ends was reduced and broadened, but very stable “hot spots” of Tea1 signal remained both at the cell ends and elsewhere along the cortex (Fig. S4) (5). To confirm the difference in response to MBC treatment under the exact same conditions, we further performed experiments in cells coexpressing Tea1-tdTomato and GFP-tagged chimera in the background of a tea1 deletion. In these cells, the expression level of Tea1-tdTomato was generally lower than in cells expressing only tdTomato-tagged Tea1. Nevertheless, individual cells expressing both proteins showed normalized intensity profiles for both Tea1 and the chimera that were similar to the corresponding profiles measured for individual cells expressing only one of these proteins, both before and after MBC treatment (compare Fig. S5 with Figs. 2 and 3 and Fig. S4). In the presence of microtubules, there was a weak spatial correlation between the two signals (Fig. S6) related to the fact that both proteins were polarized. This correlation was, however, lost on treatment with MBC: whereas the chimera became fully depolarized, clear hot spots again remained in the Tea1 signal that no longer corresponded to elevated chimera signals.
Fig. S4.
Effect of microtubule depolymerization on Tea1 distribution. (Upper) Examples of cells expressing Tea1-tdTomato before injection of 25 µg/mL MBC (Left, n = 44), 10 min after injection (Center, n = 36), and 30 min after injection (Right, n = 42). (Lower) Cortical distribution of Tea1 in these cells at respective times.
Fig. S5.
Effect of microtubule depolymerization on Mal3-Pom1-305–510 and Tea1. (Left) Three examples of cells expressing Mal3-Pom1-305–510-GFP and Tea1-tdTomato. For each cell Tea1 (in blue) and Mal3-Pom1-305–510 (in red), intensity profiles are given. White arrows indicate respective reference positions. (Right) Three examples of cells expressing Mal3-Pom1-305–510-GFP and Tea1-tdTomato after 30 min of treatment with the microtubule depolymerizing drug MBC (25 µg/mL). For each cell Tea1 (in blue) and Mal3-Pom1-305–510 (in red), intensity profiles are given. White arrows indicate respective reference positions. (Scale bar, 4 µm.)
Fig. S6.
Correlation between Tea1 and Chimera signals. (Left) Chimera fluorescence intensities along the cortex of the three cells presented in Fig. S5 (Left) are plotted as a function of their respective Tea1 fluorescence intensities. This analysis reveals a correlation between Tea1 and chimera signals when microtubules are present. (Right) Same analysis for the three cells treated with MBC during 30 min (Fig. S5, Right). In the absence of microtubules, the correlation between Tea1 and Mal3-Pom1-305–510 fluorescence intensities disappears.
These findings support the idea that the polarization of the chimera is the result of direct interactions with microtubule tips rather than the result of interactions with membrane-bound proteins such as Tip1, Tea1, or Pom1 at cell ends. We cannot exclude that in the chimera, the interaction between Mal3 and microtubule tips needs to be reinforced by weak interactions with other polarity factors. However, it is well known that Mal3 can autonomously interact with microtubule tips unlike other tip-tracking proteins in yeast (20). We therefore tentatively conclude that direct interactions with microtubule tips at cell ends are primarily responsible for polarizing the chimera protein.
A Model for Polarization Based on Membrane Binding and Microtubule Tip Affinity.
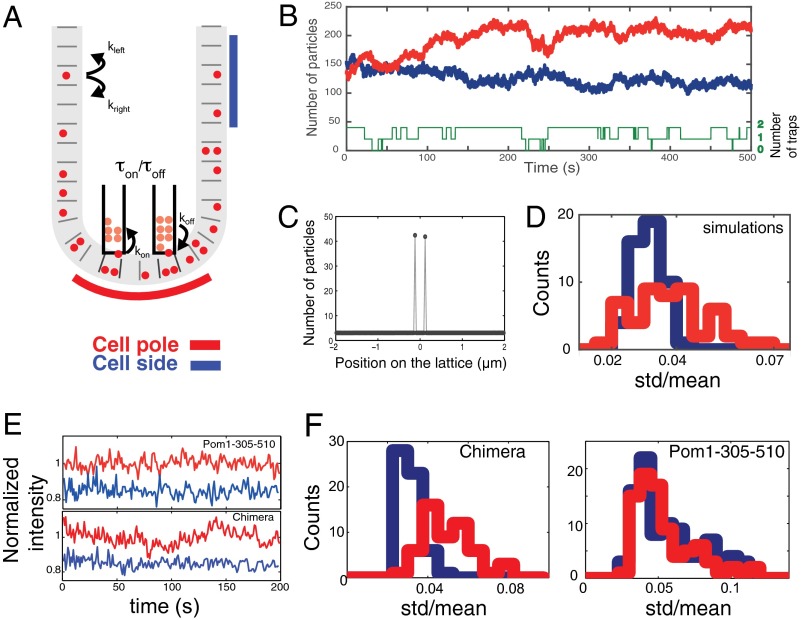
To verify the feasibility of our proposed mechanism, we developed a simple computational model and used it to ask whether a diffusible membrane component with microtubule tip affinity is able to establish a polarized protein profile. The interaction of Mal3 with microtubules is very dynamic: the dwell time at microtubule tips is estimated to be below 0.3 s (20). Thus, a microtubule tip in contact with the cell pole represents a static binding site or “trap” to which membrane-bound Mal3 can bind/unbind multiple times before the microtubule (or trap) disappears due to catastrophe. We performed numerical simulations to confirm that this simple scheme can qualitatively reproduce the main features of the experimentally observed cortical protein pattern. We considered a discrete 1D lattice on which particles diffuse (D = 0.01 µm2/s). Although remaining associated with the lattice, these particles can transiently bind to (an arbitrarily chosen number of) two localized traps that appear and disappear on a time scale of tens of seconds, consistent with microtubule dynamics (Fig. 4A). We chose not to consider an additional cytoplasmic pool of particles because we observed a very low cytoplasmic chimera signal in our experiments. A Monte-Carlo algorithm was used to simulate the dynamic behavior of 1,000 particles. Our simulations show that the average number of particles in a small region encompassing the dynamic traps (corresponding to 1.2 μm) is higher than that in a region of the same size far from the traps (Fig. 4B). This observation can be explained by the fact that diffusing particles can accumulate at the sites of the traps. This result (qualitatively) shows that the combination of membrane diffusion and interaction with microtubule tips is sufficient to accumulate proteins at the cell poles where the microtubule tip density is higher.
Fig. 4.
A simple computational model for microtubule-dependent membrane polarity. (A) Schematic representation of the numerical simulations. Particles diffuse on a discrete 1D lattice and bind to localized dynamic traps, representing microtubule tips that appear and disappear. (B) Simulated time evolution of the number of particles in a region encompassing microtubule tips (red, corresponding to red segment in A) and in a distal region of the same size (1.2 μm) (blue, corresponding to blue segment in A). The number of particles is notably higher in the region around the microtubules tips. The number of microtubule tips available for binding is shown in green (0, 1, or 2). (C) Average number of particles at each lattice site. The average number is homogeneous, except at the trap positions. (D) The temporal fluctuations in particle number (represented by the SD relative to the mean) are larger in a 1.2-µm-wide region including the traps (red) than in a region of the same size far from the traps (blue). Shown are the distributions of SD/mean ratios for 50 simulations, each lasting 200 s. (E) Normalized Pom1-305–510-GFP (Upper) and Mal3-Pom1-305–510-GFP (Lower) fluorescence intensities over time at the cell pole (in red) and at the cell side (in blue) for two cells. Blue curves are shifted downward for clarity. (F) Equivalent of D for experimental data, showing larger temporal fluctuations at cell poles for the chimera protein Mal3-Pom1-305–510, which interacts with microtubule tips (Left, npole = 55, nside = 58) but not for Pom1-305–510 (Right, npole = 86, nside = 96).
Interestingly, we observed that the number of particles in the simulations fluctuated significantly more near the dynamic traps than far away from the traps. We measured these temporal fluctuations as the ratio between the SD and the mean of the particle number over a 200-s time period for 1.2-µm regions at the cell pole and at the cell side. At the pole, this ratio was found to be on average 0.036 ± 0.002 (mean ± SEM), whereas at the cell side, this ratio was 0.029 ± 0.001 (50 simulations). The histograms of these ratios are presented in Fig. 4D (pole in red, side in blue). A canonical two-sample Kolmogorov–Smirnov test (KS test; see KS Test) confirmed that the two distributions are statistically significantly different. In particular, one can observe at the cell pole large-fluctuation events that are not observed at the cell side. Such events corresponded to the appearance/disappearance of traps followed by a diffusive response of the profile, as can for example be seen in the simulation in Fig. 4B when a trap disappears at t = 220 s. We then asked whether this behavior is also observed experimentally and quantified the temporal fluctuations of the chimera protein fluorescence intensity using the same ratio. Again, the ratio was on average larger at cell poles (0.047 ± 0.002) than at cell sides (0.028 ± 0.001; Fig. 4 E, Lower, and F, Left), and the complete distributions were again significantly different (KS test). By contrast, the intensity fluctuations of the membrane-bound Pom1 fragment, which does not interact with microtubules, were experimentally found to be similar at the cell poles and at the cell sides (Fig. 4E, Upper, and F, Right), further supporting the idea of a Mal3-mediated direct interaction of the chimera protein with microtubule tips.
In our simulations, the average steady-state concentration of cortical proteins is spatially constant except at the actual location of the traps (Fig. 4C), where it is higher. In other words, no diffusive gradient is present beyond the actual location of the traps. This result is expected from steady-state arguments about diffusive processes in the absence of a constant input (source) of proteins. Note, however, that the measured profile width for the chimera protein is slightly broader than the measured distribution of microtubule tips near the cell pole (Fig. 2E). A possible explanation is provided by the observation that the chimera proteins appear (partly) clustered in the membrane (Fig. 3C), as do many natural polarity factors in fission yeast (27). If this clustering, and subsequent slow diffusion, is in some way promoted by the increase in protein concentration near or at microtubule tips, then this may lead to a diffusive concentration gradient extending beyond the region of microtubule tip–cortex contacts, assuming that the locally created slow diffusing species eventually converts back to a fast diffusing species (see also the discussion of Fig. 3D above). Note that the profile for full-length Pom1 is also slightly broader than that of its “source,” the Tea1/Tea4 profile (14) (Fig. 2D). This diffusive gradient has however been suggested to result from the localized association of Pom1 with the membrane, followed by diffusion, autophosphorylation, and membrane dissociation (14).
Discussion
Our combined experimental and numerical results suggest that a single molecular component that combines the ability to diffuse in the membrane with microtubule tip affinity may be sufficient to establish a polarized cortical distribution in elongated cells such as fission yeast, where microtubules naturally align along the long cell axis. It is tempting to speculate that this simple polarization scheme provides a molecular basis for natural, more sophisticated polarization systems as well. A simple physical link between microtubule tips and diffusive membrane proteins may be sufficient for basic spatial polarization of the membrane. Additional layers of complexity such as the strong clustering and (related) static membrane association of Tea1/Tea4, as well as the possible fine-tuning by the phosphorylation/dephosphorylation cycle of Pom1, may then serve to buffer against fluctuations due to microtubule dynamics, protect against (temporary) disappearance of microtubules during for example mitosis, or reinforce the concentration contrast between cell ends and cell sides.
In this context it may also be interesting to rethink the previously proposed mechanisms for the polarization of Mod5 and Pom1. Both these molecules can form indirect physical links to microtubule tips via intermediate molecules (Fig. 1). Possibly, this is sufficient for their basic polarization. One might for example hypothesize that the initial localization of membrane-bound Mod5 at the cell pole (in absence of prepolarized Tea1) is due to a physical interaction with microtubule tips, mediated by the polarity factor Tea1 itself. The subsequent clustering of Tea1 at the cell poles may then recruit additional Mod5.
In the future, it will be interesting to build on our simple chimera system by adding other functionalities to determine what additional molecular properties may lead to the observed robust dynamic properties of natural polarity patterns. It will also be essential to further challenge our conclusion that no other factors are required for the observed polarization of the chimera protein in fission yeast cells. As with any in vivo experiment, it is inherently impossible to completely exclude a role for other molecular components that are naturally present in WT cells. The only remedy here will be to reconstitute the establishment of polarity patterns bottom-up in an in vitro experiment. To reach this goal, we are currently working on experiments where dynamic microtubules and the chimera protein are incorporated in cylindrical emulsion droplets with the size and shape of fission yeast cells.
Methods
Schizosaccharomyces pombe Cell Preparation.
Standard methods for Schizosaccharomyces pombe growth and genetics were used. A list of strains used in this study can be found in Table S1. Before imaging, cells were grown for 16 h at 30 °C in synthetic Edinburgh minimal medium (EMM) with appropriate supplements lacking thiamine. For Fig. 2A (Lower), cells were treated with MBC (25 μg/mL) in liquid culture for 90 min at 30 °C; 2% (wt/vol) agarose pads were used for imaging. For drug injection/washout experiments, cells were mounted in a lectin-coated microchannel made of parafilm sandwiched between two glass slides. MBC (Sigma) was prepared fresh in DMSO at a concentration of 2.5 mg/mL. MBC was then diluted 100× in the appropriate buffer before injection into the flow cell.
Table S1.
List of strains
| Strain | Genotype | Source |
| MD000 | h− ade6-M216 leu1-32 ura4-D18 | Laboratory stock |
| DB427 | h− tip1∆::kanR ade6-M216 leu1-32 ura4-D18 | (22) |
| KS3138 | h− tea1-tdTomato:natMX6 ade6-210 leu1-32 ura4-D18 | (5) |
| MD010 | h− ade6-M216 leu1-32 ura4-D18 [pREP41-pom1-305–510-GFP] | This study |
| MD011 | h− ade6-M216 leu1-32 ura4-D18 p[ura4+::nmt41-mal3-pom1-305–510-GFP] | This study |
| MD012 | h− tip1∆::kanR ade6-M216 leu1-32 ura4-D18 p[ura4+::nmt41-mal3-pom1-305–510-GFP] | This study |
| MD013 | h+ aur1::mCherry:atb2 ade6-m216 leu1-32 ura4-D18 p[ura4+::nmt41-mal3-pom1-305–510-GFP] | This study |
| MD015 | h− tea1-tdTomato:natMX6 ade6-210 leu1-32 ura4-D18 p[ura4+::nmt41-mal3-pom1-305–510-GFP] | This study |
| DB614 | h? nmt1-GFP-mal3::kanR | (22) |
Microscopy and Image Analysis.
Cells were imaged with confocal spinning disk microscope at room temperature. Images were acquired with 0.3-μm spacing in the z direction. The medial slices (1-μm-high section) of each cell were sum-projected with ImageJ software (National Institutes of Health), and the fluorescence signal was measured along the cortex (0.5-μm-wide region) after background subtraction. The subsequent treatment of the data was performed with custom-made Matlab (The MathWorks) algorithms. Intensity traces were aligned relative to the cell poles. To compare cells with different expression levels, we normalized individual intensity traces with their respective average intensity values. Finally, we performed a Gaussian fit to the fluorescence intensity profile averaged over all cells to quantify its width w (defined as twice the SD of the Gaussian fit). Note that this method of image analysis also allowed us to compare profile shapes acquired under different imaging conditions (exposure times and/or microscopes). In GFP-Mal3 experiments, the bright fluorescence signal close to the cortex was automatically detected with a homemade Matlab algorithm to detect the cortical location of microtubule tips.
Monte-Carlo Simulations.
The cell cortex was modeled as a discretized 1D lattice of 300 sites (separated by 0.03 μm; total length, 9 μm) on which 1,000 particles diffused. Two microtubule tips were simulated as two traps at fixed sites of the lattice separated by 240 nm on the lattice. Trap lifetimes were stochastically set according to timescales typical for microtubule dynamics (on average, τon ∼ 50 s and τoff ∼ 15 s). It is estimated that, in vivo, up to 200 cytoplasmic Mal3 proteins can bind to a single microtubule tip (28). However, we set a lower maximum to the number of membrane-bound particles that can interact with a simulated microtubule tip in a normal-incidence geometry: we impose that each trap can bind at most 50 membrane-bound particles. Reaction rates are chosen to approximate known Mal3 kinetics: koff = 5 s−1. The on-rate is diffusion limited. The particle diffusion constant is set to 0.01 μm2/s (26) and the time increment to 10−3 s. Diffusion equations were solved with Matlab (The MathWorks).
KS Test
The two-sample KS test is a canonical nonparametric test used to compare two probability distributions. The test quantifies the distance (maximal absolute difference) between cumulative distribution functions. The null hypothesis that the two recorded empirical distributions are equal is rejected with significance level when
where N and are the number of points in the datasets.
To test whether the distributions of SD divided by the mean for cell side (N data points) and cell pole ( data points) are significantly different, we performed KS tests on the three underlying datasets (measured data for the chimera protein, measured data for Pom1-305–510, and numerical simulations). The results of the KS tests are presented here.
| Dataset | Is the null hypothesis valid? | ||||
| Simulations | 50 | 50 | 0.39 | 0.44 | No |
| Chimera | 58 | 55 | 0.37 | 0.77 | No |
| Pom1-305–510 | 96 | 86 | 0.29 | 0.13 | Yes |
We thus conclude that, for the chimera protein and for the simulated data, the distributions for the side and pole are significantly different, whereas the opposite is true for the Pom1-305–510 fragment.
Supplementary Material
Acknowledgments
We thank Sophie Martin, Ken Sawin, Stephen Huisman, and Damian Brunner for strains; Julianne Teapal, Marcel Janson, Sergio Rincon, and Phong Tran for technical assistance; Andrew Mugler and Bela Mulder for discussions; and Sander Tans, Phong Tran, and Anne Paoletti for critical reading of the manuscript. This work is part of the research program of the “Stichting voor Fundamenteel Onderzoek de Materie,” which is financially supported by the “Nederlandse organisatie voor Wetenschappelijk Onderzoek (NWO).”
Footnotes
The authors declare no conflict of interest.
This article is a PNAS Direct Submission.
This article contains supporting information online at www.pnas.org/lookup/suppl/doi:10.1073/pnas.1419248113/-/DCSupplemental.
References
- 1.Drubin DG, Nelson WJ. Origins of cell polarity. Cell. 1996;84(3):335–344. doi: 10.1016/s0092-8674(00)81278-7. [DOI] [PubMed] [Google Scholar]
- 2.Mellman I, Nelson WJ. Coordinated protein sorting, targeting and distribution in polarized cells. Nat Rev Mol Cell Biol. 2008;9(11):833–845. doi: 10.1038/nrm2525. [DOI] [PMC free article] [PubMed] [Google Scholar]
- 3.Swaney KF, Huang CH, Devreotes PN. Eukaryotic chemotaxis: A network of signaling pathways controls motility, directional sensing, and polarity. Annu Rev Biophys. 2010;39:265–289. doi: 10.1146/annurev.biophys.093008.131228. [DOI] [PMC free article] [PubMed] [Google Scholar]
- 4.Huisman SM, Brunner D. Cell polarity in fission yeast: A matter of confining, positioning, and switching growth zones. Semin Cell Dev Biol. 2011;22(8):799–805. doi: 10.1016/j.semcdb.2011.07.013. [DOI] [PubMed] [Google Scholar]
- 5.Bicho CC, Kelly DA, Snaith HA, Goryachev AB, Sawin KE. A catalytic role for Mod5 in the formation of the Tea1 cell polarity landmark. Curr Biol. 2010;20(19):1752–1757. doi: 10.1016/j.cub.2010.08.035. [DOI] [PMC free article] [PubMed] [Google Scholar]
- 6.Mata J, Nurse P. tea1 and the microtubular cytoskeleton are important for generating global spatial order within the fission yeast cell. Cell. 1997;89(6):939–949. doi: 10.1016/s0092-8674(00)80279-2. [DOI] [PubMed] [Google Scholar]
- 7.Hagan IM. The fission yeast microtubule cytoskeleton. J Cell Sci. 1998;111(Pt 1):1603–1612. doi: 10.1242/jcs.111.12.1603. [DOI] [PubMed] [Google Scholar]
- 8.Tatebe H, Shimada K, Uzawa S, Morigasaki S, Shiozaki K. Wsh3/Tea4 is a novel cell-end factor essential for bipolar distribution of Tea1 and protects cell polarity under environmental stress in S. pombe. Curr Biol. 2005;15(11):1006–1015. doi: 10.1016/j.cub.2005.04.061. [DOI] [PubMed] [Google Scholar]
- 9.Martin SG, McDonald WH, Yates JR, 3rd, Chang F. Tea4p links microtubule plus ends with the formin for3p in the establishment of cell polarity. Dev Cell. 2005;8(4):479–491. doi: 10.1016/j.devcel.2005.02.008. [DOI] [PubMed] [Google Scholar]
- 10.Brunner D, Nurse P. CLIP170-like tip1p spatially organizes microtubular dynamics in fission yeast. Cell. 2000;102(5):695–704. doi: 10.1016/s0092-8674(00)00091-x. [DOI] [PubMed] [Google Scholar]
- 11.Snaith HA, Sawin KE. Fission yeast mod5p regulates polarized growth through anchoring of tea1p at cell tips. Nature. 2003;423(6940):647–651. doi: 10.1038/nature01672. [DOI] [PubMed] [Google Scholar]
- 12.Moseley JB, Mayeux A, Paoletti A, Nurse P. A spatial gradient coordinates cell size and mitotic entry in fission yeast. Nature. 2009;459(7248):857–860. doi: 10.1038/nature08074. [DOI] [PubMed] [Google Scholar]
- 13.Bähler J, Pringle JR. Pom1p, a fission yeast protein kinase that provides positional information for both polarized growth and cytokinesis. Genes Dev. 1998;12(9):1356–1370. doi: 10.1101/gad.12.9.1356. [DOI] [PMC free article] [PubMed] [Google Scholar]
- 14.Hachet O, et al. A phosphorylation cycle shapes gradients of the DYRK family kinase Pom1 at the plasma membrane. Cell. 2011;145(7):1116–1128. doi: 10.1016/j.cell.2011.05.014. [DOI] [PubMed] [Google Scholar]
- 15.Minc N, Bratman SV, Basu R, Chang F. Establishing new sites of polarization by microtubules. Curr Biol. 2009;19(2):83–94. doi: 10.1016/j.cub.2008.12.008. [DOI] [PMC free article] [PubMed] [Google Scholar]
- 16.Chang F, Martin SG. Shaping fission yeast with microtubules. Cold Spring Harb Perspect Biol. 2009;1(1):a001347. doi: 10.1101/cshperspect.a001347. [DOI] [PMC free article] [PubMed] [Google Scholar]
- 17.Altschuler SJ, Angenent SB, Wang Y, Wu LF. On the spontaneous emergence of cell polarity. Nature. 2008;454(7206):886–889. doi: 10.1038/nature07119. [DOI] [PMC free article] [PubMed] [Google Scholar]
- 18.Chau AH, Walter JM, Gerardin J, Tang C, Lim WA. Designing synthetic regulatory networks capable of self-organizing cell polarization. Cell. 2012;151(2):320–332. doi: 10.1016/j.cell.2012.08.040. [DOI] [PMC free article] [PubMed] [Google Scholar]
- 19.Honnappa S, et al. An EB1-binding motif acts as a microtubule tip localization signal. Cell. 2009;138(2):366–376. doi: 10.1016/j.cell.2009.04.065. [DOI] [PubMed] [Google Scholar]
- 20.Bieling P, et al. Reconstitution of a microtubule plus-end tracking system in vitro. Nature. 2007;450(7172):1100–1105. doi: 10.1038/nature06386. [DOI] [PubMed] [Google Scholar]
- 21.Beinhauer JD, Hagan IM, Hegemann JH, Fleig U. Mal3, the fission yeast homologue of the human APC-interacting protein EB-1 is required for microtubule integrity and the maintenance of cell form. J Cell Biol. 1997;139(3):717–728. doi: 10.1083/jcb.139.3.717. [DOI] [PMC free article] [PubMed] [Google Scholar]
- 22.Busch KE, Brunner D. The microtubule plus end-tracking proteins mal3p and tip1p cooperate for cell-end targeting of interphase microtubules. Curr Biol. 2004;14(7):548–559. doi: 10.1016/j.cub.2004.03.029. [DOI] [PubMed] [Google Scholar]
- 23.Wachtler V, Rajagopalan S, Balasubramanian MK. Sterol-rich plasma membrane domains in the fission yeast Schizosaccharomyces pombe. J Cell Sci. 2003;116(Pt 5):867–874. doi: 10.1242/jcs.00299. [DOI] [PubMed] [Google Scholar]
- 24.Foethke D, Makushok T, Brunner D, Nédélec F. Force- and length-dependent catastrophe activities explain interphase microtubule organization in fission yeast. Mol Syst Biol. 2009;5:241. doi: 10.1038/msb.2008.76. [DOI] [PMC free article] [PubMed] [Google Scholar]
- 25.Tischer C, Brunner D, Dogterom M. Force- and kinesin-8-dependent effects in the spatial regulation of fission yeast microtubule dynamics. Mol Syst Biol. 2009;5:250. doi: 10.1038/msb.2009.5. [DOI] [PMC free article] [PubMed] [Google Scholar]
- 26.Saunders TE, et al. Noise reduction in the intracellular pom1p gradient by a dynamic clustering mechanism. Dev Cell. 2012;22(3):558–572. doi: 10.1016/j.devcel.2012.01.001. [DOI] [PMC free article] [PubMed] [Google Scholar]
- 27.Dodgson J, et al. Spatial segregation of polarity factors into distinct cortical clusters is required for cell polarity control. Nat Commun. 2013;4:1834. doi: 10.1038/ncomms2813. [DOI] [PMC free article] [PubMed] [Google Scholar]
- 28.Seetapun D, Castle BT, McIntyre AJ, Tran PT, Odde DJ. Estimating the microtubule GTP cap size in vivo. Curr Biol. 2012;22(18):1681–1687. doi: 10.1016/j.cub.2012.06.068. [DOI] [PMC free article] [PubMed] [Google Scholar]
Associated Data
This section collects any data citations, data availability statements, or supplementary materials included in this article.


