Abstract
A sulfonate-silica hybrid strong cation exchange monolith microreactor was synthesized and coupled to a linear polyacrylamide coated capillary for online sample preparation and capillary zone electrophoresis-tandem mass spectrometry (CZE-MS/MS) bottom-up proteomic analysis. The protein sample was loaded onto the microreactor in an acidic buffer. After online reduction, alkylation, and digestion with trypsin, the digests were eluted with 200 mM ammonium bicarbonate at pH 8.2 for CZE-MS/MS analysis using 1 M acetic acid as the background electrolyte. This combination of basic elution and acidic background electrolytes results in both sample stacking and formation of a dynamic pH junction. 369 protein groups and 1,274 peptides were identified from 50 ng of Xenopus laevis zygote homogenate, which is comparable with an offline sample preparation method, but the time required for sample preparation was decreased from over 24 h to less than 40 min. Dramatically improved performance was produced by coupling the reactor to a longer separation capillary (~100 cm) and a Q Exactive HF mass spectrometer. 975 protein groups and 3,749 peptides were identified from 50 ng Xenopus protein using the online sample preparation method.
Graphical Abstract
Online digestion using enzymatic reactors have been developed for bottom-up proteomic analysis.1–6 These reactors can dramatically simplify sample handling in proteomics research and reduce sample loss compared with manual manipulations, and they provide a route to automated sample preparation.
The reactor systems can be divided into two groups. The first type immobilizes proteolytic enzymes onto solid adsorbents. Proteins are introduced to the reactor, where they are digested.1–3 Because the protein sample isn’t retained on the enzymatic reactor, reduction and alkylation steps are usually completed offline before introduced to the reactor. In this case, a solid phase extraction column (e.g. C18) is usually required to trap the peptides for desalting before analysis by mass spectrometry. However, it is not convenient to couple the reactor and solid phase extraction column together in capillary zone electrophoresis (CZE). Therefore, the reduction and alkylation steps are usually eliminated, which leads to limitations for analysis of highly structured proteins with many disulfide bonds.3 Moreover, the sample volume loaded onto the device is limited to the reactor volume or the injection volume.
A second type of enzymatic reactor is constructed by non-covalent capture of target proteins onto a solid phase, followed by online digestion with an enzyme solution.4 We note that relatively large volumes of dilute sample can be concentrated on the reactor before further processing. The captured proteins may be conveniently reduced and alkylated using standard chemistry. A monolithic column is an interesting choice for the supporting adsorbent due to its porous structure, high rigidity, fast mass transfer rate, and high surface area. Both reversed phase and strong cationic exchange (SCX) adsorbents have been used to form the second type of the enzymatic reactor integrated with liquid chromatography-tandem mass spectrometry (MS/MS).5–6
CZE-MS/MS has received attention for proteomic analysis due to its fast and high-resolution separations, and its outstanding performance for analysis of nanogram and smaller samples.7–10 In this report, we employ a SCX hybrid monolith based microreactor and couple it to a linear polyacrylamide (LPA) coated capillary for online reduction, alkylation, and digestion of a protein sample followed by CZE-MS/MS analysis. The protein digest was eluted using a lower concentration buffer with higher pH value than that of the CZE separation buffer. This combination of buffers results in sample stacking and formation of a dynamic pH junction to improve the separation performance.
EXPERIMENTAL SECTION
Reagents and Chemicals
Urea, acetic acid (HAc), ammonium bicarbonate (NH4HCO3), bovine pancreas TPCK-treated trypsin, dithiothreitol (DTT), poly(ethylene glycol) (PEG, MW=10 000), iodoacetamide (IAA), vinyltrimethoxysilane (VTMS), tetramethoxysilane (TMOS), 3-sulfopropyl methacrylate potassium salt, 2,2’-azobis(2-isobutyronitrile) (AIBN), were purchased from Sigma-Aldrich (St. Louis, MO). Formic acid (FA) and acetonitrile (ACN) were purchased from Fisher Scientific (Pittsburgh, PA). Methanol was purchased from Honeywell Burdick & Jackson (Wicklow, Ireland). A Nano Pure system from Thermo Scientific (Marietta, OH) Water was used to generate deionized water. Both uncoated and linear poly(acrylamide) (LPA) coated fused-silica capillaries were purchased from Polymicro Technologies (Phoenix, AZ).
Preparation of the sulfonate-silica hybrid SCX-SPE monolith
Preparation of the sulfonate SCX hybrid monolithic column was similar to a published method, and is described in supporting information.11–13
Xenopus laevis fertilized eggs protein sample preparation
The procedure for Xenopus laevis egg collection and fertilization was the same as reported earlier and is described in detail in supporting information.14,15 All animal procedures were performed according to protocols approved by the University of Notre Dame Institutional Animal Care and Use Committee.
Online sample preparation
The SCX monolith based microreactor was preconditioned with 1 M HAc. The protein sample was dissolved in 100 mM FA and loaded onto the SCX microreactor by pressure followed by flushing with 1 M HAc. For protein reduction, 10 mM DTT dissolved in 5 mM NH4HCO3 (pH 7.8) was injected into the SCX microreactor and incubated for 30 min at room temperature. For alkylation, 20 mM IAA dissolved in 5 mM NH4HCO3 (pH 7.8) was injected into the microreactor and incubated for another 30 min at room temperature. Then, 0.5 mg/mL trypsin dissolved in 5 mM NH4HCO3 (pH 7.8) was injected for digestion at room temperature. Finally, 1 M HAc was hydrodynamically injected to terminate the digestion reaction and remove unretained components from the microreactor. In some cases noted below, the alkylation step was eliminated from the procedure.
Recovery and loading ability
To determine the recovery of the method, the SCX microreactor was connected to the LPA coated capillary and inserted into the CZE-MS interface before starting the online sample preparation experiment. After the online digestion was completed, 1 M HAc was continuously injected into the reactor by pressure while applying 1.5 kV spray voltage to detect any lost sample by MS/MS. After the microreactor was thoroughly flushed by 1 M HAc, the trapped peptides were eluted with 100 nL 200 mM NH4HCO3 (pH 8.2) for CZE-MS/MS analysis. An additional elution step with 200 mM NH4HCO3 (pH 8.2) was performed to minimize the carry-over between runs.
Offline sample preparation
A 300 µg aliquot of lysate was dissolved in 290 µL of denaturing buffer containing 8 M urea and 50 mM NH4HCO3. After addition of 2.4 µL of 1 M DTT in 50 mM NH4HCO3, the mixture was incubated at 37 °C for 1 h to reduce disulfide bonds. Subsequently, 6 µL of 1 M IAA in 50 mM NH4HCO3 was added to the mixture and incubated in the dark at room temperature for 45 min. Then, the mixture was diluted 10 fold with 50 mM NH4HCO3 buffer and digested with trypsin at a 1:25 (w/w) enzyme:substrate ratio at 37 °C for 24 h. After digestion, the solution was adjusted to pH 2.7 by 10% trifluoroacetic acid. The digest was treated with a C18 SepPak column (Waters, Milford, MA), followed by lyophilisation with a vacuum concentrator (Thermo Fisher Scientific, Marietta, OH). The dried protein digest was redissolved to make the concentration of 1 mg/mL before direct CZE -MS/MS analysis.
Direct CZE-MS/MS analysis
The capillary electrophoresis system consists of two high-voltage power supplies (Spellman CZE 1000R) and an electrokinetically pumped nanospray interface that coupled the CZE separation capillary to a LTQ-Orbitrap Velos mass spectrometer (Thermo Fisher Scientific). Electrospray ionization employed an electrokinetically-pumped nanospray emitter.16 The electrospray emitter was A borosilicate glass capillary (1.0 mm o.d. × 0.75 mm i.d., 10 cm long) pulled with a Sutter instrument P-1000 flaming/brown micropipette puller; the emitter inner diameter was 10–13 μm. The electrospray sheath flow buffer was 10% (v/v) methanol with 0.5% aqueous FA. An LPA-coated fused silica capillary (50 μm i.d.×150 μm o.d., 60 cm long) was used for the CZE separation. The separation buffer was 1 M HAc in water. The sample was loaded by pressure. 19.5 kV was applied at the injection end of the capillary for separation and 1.5 kV on the sheath flow reservoir for electrospray. Voltage programming was controlled by LabView software.
Online SCX-microreactor-CZE-MS/MS analysis
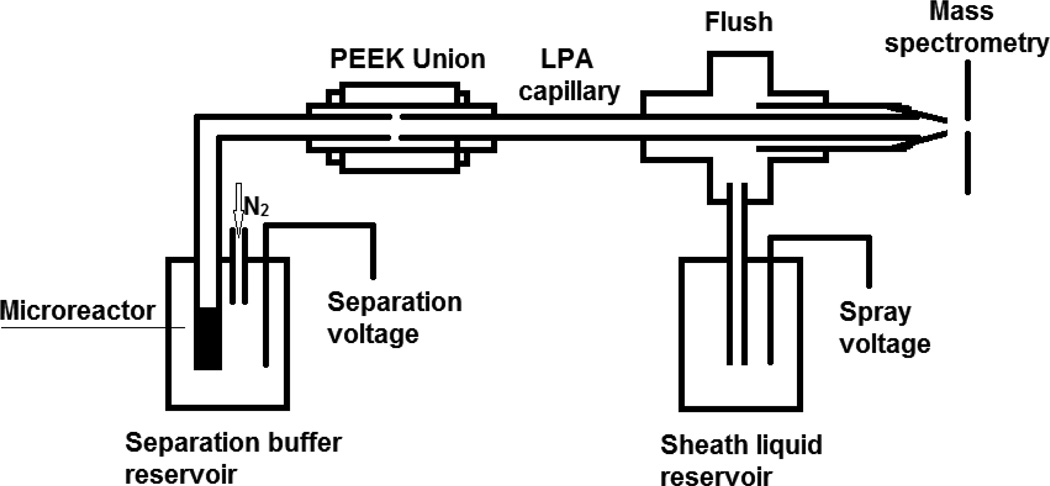
A schematic diagram of the SCX-microreactor-CZE-MS/MS system is shown in Figure 1. The injection end of the capillary was held in a block that allowed application of either nitrogen gas to pump fluids or voltage to drive electrophoresis.17 After the sample was online reduced, alkylated, and digested, the trapped peptides on the SCX microreactor were eluted by 100 nL of 200 mM NH4HCO3 (pH 8.2). After the elution buffer was transferred into the separation capillary, the electrolyte was changed back to 1 M HAc and normal CZE-MS/MS analysis was carried out under the same conditions as direct CZE-MS/MS.
Figure 1.
The schematic diagram of the SCX-microreactor-CZE-MS/MS system.
UPLC-ESI-MS/MS analysis
A nanoACQUITY UltraPerformance LCH (UPLCH) system (Waters, Milford, MA, USA) with a UPLC BEH 130 C18 column (Waters, 100 μm × 100 mm, 1.7 μm) was coupled to an LTQ Orbitrap Velos mass spectrometer (Thermo Fisher Scientific) for peptide separation and identification. Buffer A (0.1%FA in water) and buffer B (0.1% FA in ACN) were used as mobile phases for gradient separation. Peptides were automatically loaded onto a commercial C18 reversed phase column (Waters, 100 µm ×100 mm, 1.7 µm particle, BEH130C18, column temperature 40°C) and flushed with 2% buffer B for 10 min at a flow rate of 0.7 µL/min, then followed by gradient: 10−11 min, 2−8% B, 0.7 µL/min; 11−71 min, 8−30% B, 0.6 µL/min; 71−72 min, 30−80% B, 0.7 µL/min; 72−77 min, 80% B, 0.7 µL/min; 77−78 min, 80−2% B, 0.7 µL/min; 78−90 min, 2% B, 0.7 µL/min. The eluted peptides from the C18 column were pumped through a capillary tip for electrospray with the electrospray voltage of 1.8 kV, and the MS parameters were the same as that used for CE-ESI-MS/MS analysis.
Mass spectrometer operating parameters
An LTQ-Orbitrap Velos mass spectrometer (Thermo Fisher Scientific) was used for preliminary experiments. The ion transfer tube temperature was held at 300 °C. The S-Lens RF level was 50.00. The mass spectrometer was programmed in data-dependent mode. A top 20 method was used. Full MS scans were acquired with the Orbitrap mass analyzer over m/z 380–1,800 range with resolution of 70,000 (m/z 200) and the number of microscans set to 1. The target value was 1.00E+06, and maximum injection time was 250 ms. For MS/MS scans, the twenty most intense peaks with charge state ≥2 were sequentially isolated and further fragmented in the collision-induced dissociation (CID) mode following one full MS scan. The normalized collision energy was set at 30.
In a second experiment, a Q Exactive HF instrument (Thermo Scientific) was used with a 1-m long separation capillary. The mass spectrometer was programmed in data-dependent mode. A top 20 method was used. The S-lens RF level was set at 50, and heated capillary at 275 °C. Full scan resolution was set to 60,000 at m/z 200. Full scan target was 3.00E+06 with a maximum fill time of 30 ms. Mass range was set to 350–1,500. Target value for fragment scans was set at 1.00E+05, and intensity threshold was kept at 1.00E+05. Isolation width was set at 1.4 Th. A fixed first mass of 100 was used. Normalized collision energy was set at 28.
Database searching
Database searching of the raw files was performed in Proteome Discoverer 1.4 with MASCOT 2.2.4. The UniProt Xenopus reference protein database (48 523 protein sequences) was used for database searching. The corresponding reversed database was also used for database searching in order to evaluate the false discovery rates (FDRs). The database searching parameters included full tryptic digestion and allowed up to two missed cleavages, the precursor mass tolerance was set at 20 ppm, and fragment mass tolerance was 1 Da for the data obtained on the LTQ-Orbitrap Velos mass spectrometer and 0.05 Da for the data obtained on the Q Exactive HF instrument. Carbamidomethylation (C) was set as fixed modifications for the sample treated by alkylation. Oxidation (M) and deamidated (NQ) were set as variable modifications. On the peptide level, peptide confidence value as high was used to filter the peptide identification, and the corresponding FDR at the peptide level was less than 1%. On the protein level, protein grouping was enabled.
RESULTS AND DISCUSSION
Effect of alkylation
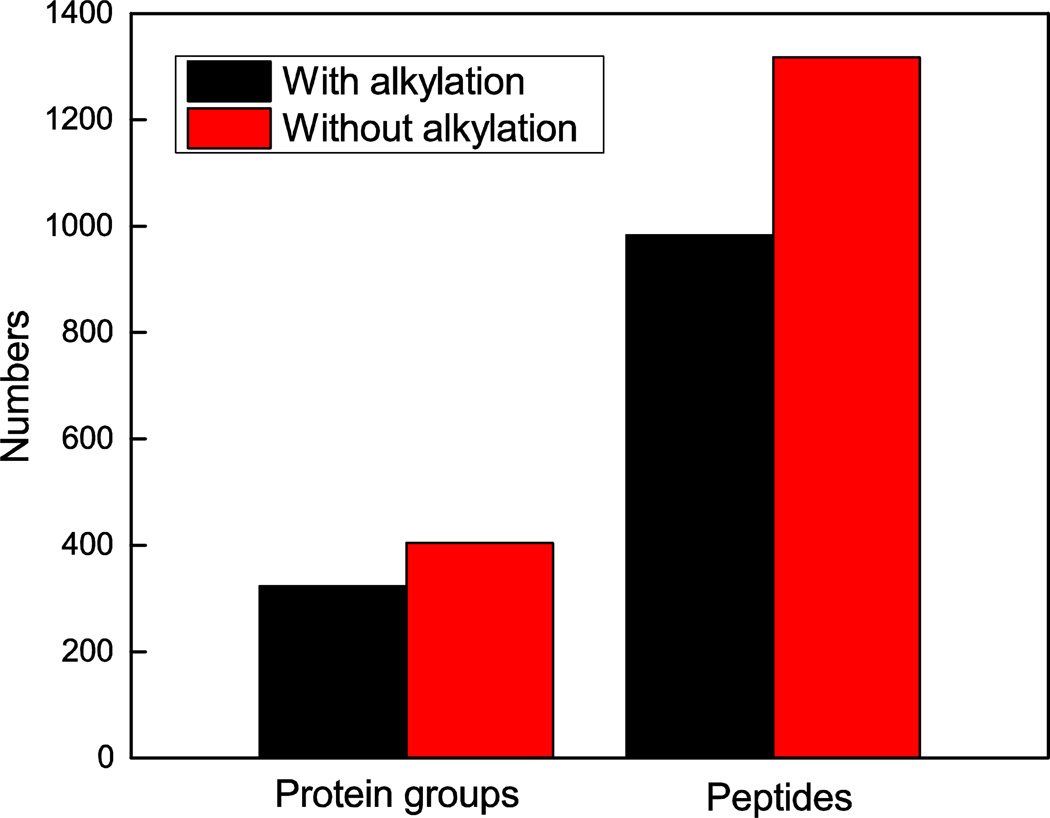
The effect of alkylation on the number of peptide and protein identifications was investigated. In the first experiment, the lysate was loaded onto the SCX microreactor and followed by reduction, alkylation, and digestion. For comparison, 50 ng of Xenopus protein was loaded onto the SCX microreactor and digested after reduction without an alkylation step, Figure 2. 323 protein groups and 983 peptides were identified with the reduction and alkylation pretreatment. In contrast, 404 protein groups and 1,317 peptides were identified without the alkylation step.
Figure 2.
The effects of alkylation on the number of protein and peptide identifications. Experimental conditions: 50 μm i.d. × 150 μm o.d. × 1.5 cm SCX microreactor; 50 μm i.d. × 150 μm o.d. × 60 cm long LPA coated capillary as separation capillary; 50 ng Xenopus protein; 2 h digestion time; 100 nL of 200 mM NH4HCO3(pH8.2) elution buffer; 1 M HAc separation buffer; 19.5 kV separation voltage; and 1.5 kV spray voltage.
The larger number of identifications without alkylation was unexpected, and may be due to the large volume of ammonium bicarbonate buffer (5 mM, pH 7.8) that was used for alkylation. In our experiment, 90 nL of 10 mM DTT in the ammonium bicarbonate buffer (5 mM, pH 7.8) was injected in the microreactor to ensure complete reduction of disulfide bond in the proteins, followed by 90 nL of 20 mM IAA in the ammonium bicarbonate buffer (5 mM, pH 7.8) was injected for alkylation. Because the microreactor was based on a SCX monolithic column, injection of more basic buffer into the microreactor could lead to the loss of peptides with low pI values. Therefore, it is important to decrease the injected volume of ammonium bicarbonate buffer (5 mM, pH 7.8) to not compromise the number of identifications. The results showed that the alkylation step does not improve the identification numbers of protein but instead results in sample loss. Moreover, because the protein reduction was carried out in the microreactor, which is a non-oxidizing environment, and because of the relatively short time used for online digestion, the alkylation step was not necessary here. Therefore, the alkylation step was eliminated in subsequent experiments.
Effect of digestion time
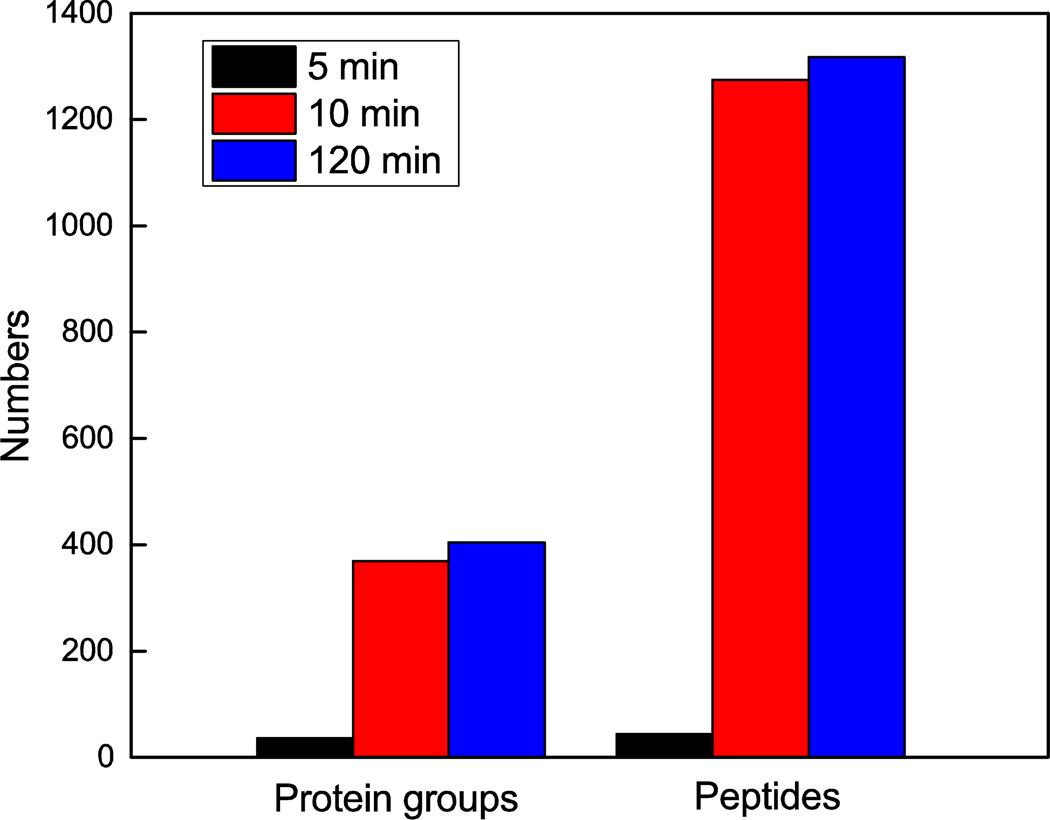
The effect of the digestion time was investigated. A trypsin solution was added to the reduced protein captured on the SCX reactor. The reduced protein was digested for 5 min, 10 min, and 2 h, and the corresponding numbers of identified protein groups and peptides are shown in Figure 3. Only 36 protein groups and 44 peptides were identified when the digestion time was 5 min, reflecting incomplete digestion. However, when the digestion time was increased to 10 min, 369 protein groups and 1,274 peptides were identified. A further increased in the digestion time to 120 min resulted in identification of 404 protein groups and 1,317 peptides. The results indicated that most proteins were completely digested after 10 min. The fast digestion may be due to the high concentration of the trypsin used for online digestion and the highly porous structure of the microreactor, which facilitates interaction of the captured proteins with trypsin. Therefore, 10 min digestion time was used in the remaining experiments.
Figure 3.
Effect of digestion time on peptide and protein identifications using the SCX hybrid monolith based microreactor. Experimental conditions are same as in Figure 2.
Column capacity of the SCX microreactor
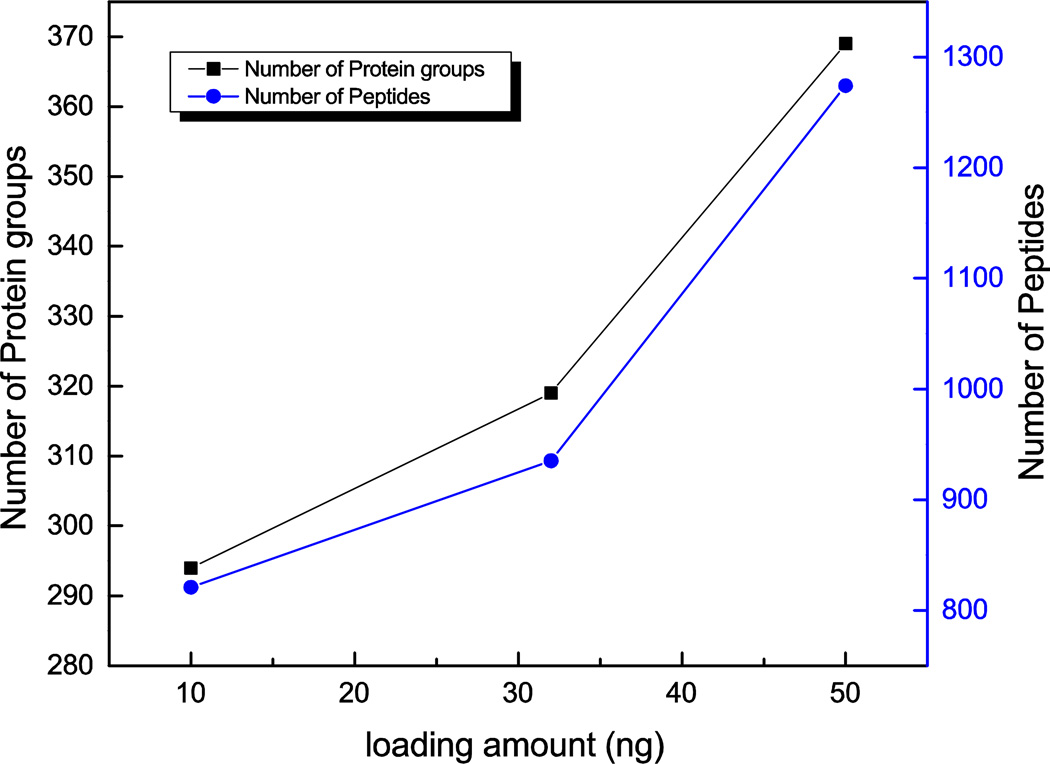
Different amounts of proteins were loaded onto the SCX microreactor. After online sample preparation, 294 protein groups and 811 peptides were identified from 10 ng of loaded protein. However, when the loading amount was further increased from 32 ng to 50 ng, the numbers of identified protein groups increased from 319 to 369, and the number of identified peptides increased from 935 to 1,275, Figure 4.
Figure 4.
Column capacity of the SCX microreactor. Experimental conditions: 10 min digestion; other conditions are same as in Figure 2.
Recovery
Because the online sample pretreatment platform was directly coupled with a mass spectrometer, any loss of the sample during the experiment could be monitored by collecting MS/MS data during the flushing step. After reduction and digestion of 50 ng proteins, the microreactor was flushed with 1 M HAc by pressure; 26 protein groups and 45 peptides were identified in the flow-through solution. In contrast, 369 protein groups and 1,275 peptides were identified following elution with 100 nL of 200 mM NH4HCO3 (pH 8.2). Therefore, the recovery was 97% based on the number of identified peptides in the flushing step and eluting step. The pI distribution of the peptides identified during the flushing step is shown in S-Figure 2 in the Supporting information. We found that 78% of the peptides had pI value less than 5. This result is not surprising because sample pretreatment was carried out with 5 mM ammonium bicarbonate at pH 7.8. Peptides with lower pI values would be easily lost during the flushing step. However, the vast majority of the peptides were retained on the microreactor after flushing with 1 M HAc.
Repeatability
The repeatability of the reactor system was investigated by successive loading of 50 ng protein. A representative electropherogram is shown in S-Figure 1 in Supporting Information. Based on triplicate analysis, 709 protein groups and 2,538 peptides were identified. 661 protein groups and 2,113 peptides were identified in two runs; another 425 peptides and 48 proteins were detected in one run. The relative standard deviation of the number of identified protein groups and peptides are 17% (n=3) and 16% (n=3), respectively.
Comparison with the offline sample preparation method
A sample prepared using offline manipulations was also analyzed by CZE-MS/MS. A representative electropherogram is shown in S-Figure 3 in the Supporting Information. 347 protein groups and 923 peptides were identified from 50 ng of sample. The numbers of identifications were comparable to the results obtained by the online sample preparation method with the microreactor. However, the time required for sample preparation was greatly decreased by using microreactor, which required less than 40 min compared with more than 24 hours for the offline sample preparation method.
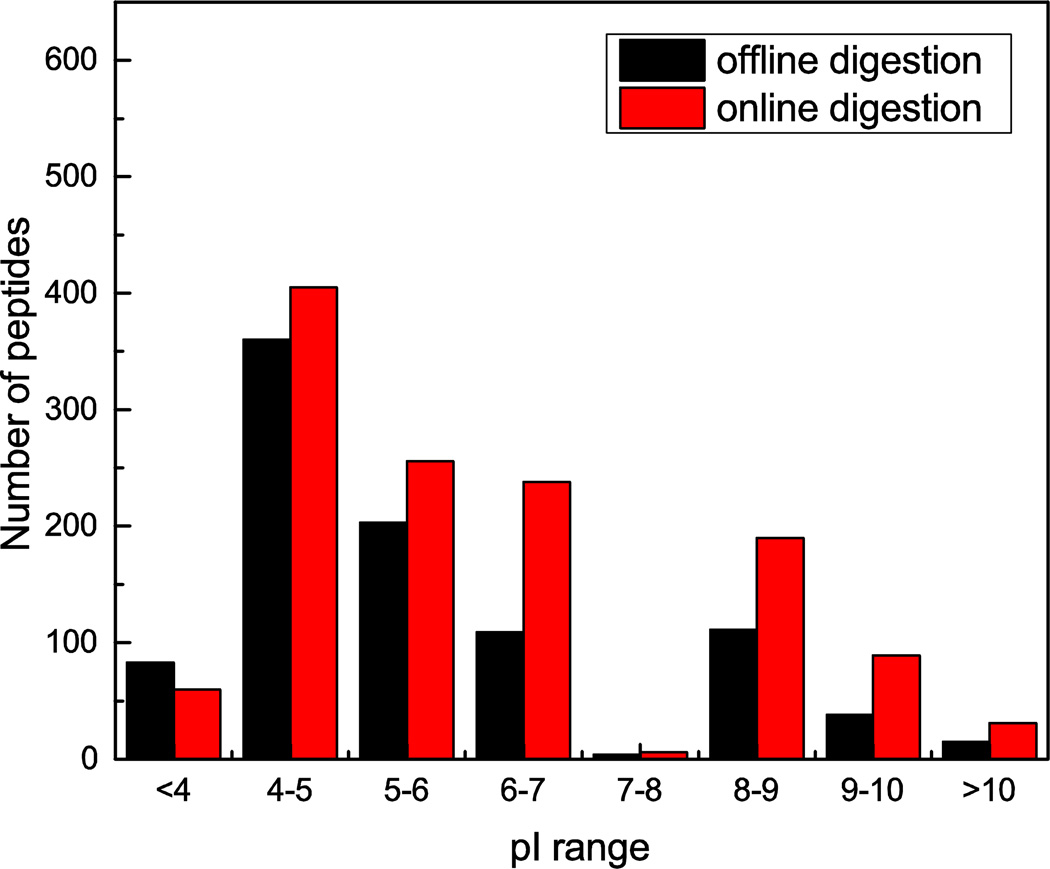
The distributions of pI values of the identified peptides by both sample preparation methods are compared in Figure 5. While the offline digestion method generated slightly more IDs of acidic peptides with pI<4, the online digestion generated more identifications for peptides with pI>4. The overlaps of protein groups and peptides between two methods are shown in S-Figure 4 in the Supporting Information.
Figure 5.
Comparison of pI distribution of the identified peptides by online and offline sample preparation methods.
Comparison with UPLC-MS/MS analysis
A sample prepared using offline manipulations was also analyzed by a UPLC-MS/MS method. 10 ng, 32 ng, and 50 ng of sample were analyzed and the identification results were compared with the online SCX-microreactor-CZE-MS/MS method. The overlap of peptides and protein groups from online SCX-microreactor-CZE-MS/MS method and UPLC−MS/MS method are shown in S-Figure 5 in the Supporting Information. 99 protein groups and 161 peptides were identified from 10 ng sample by UPLC-MS/MS method while 294 protein groups and 811 peptides were identified by online SCX-microreactor-CZE-MS/MS method. 48 protein groups and 47 peptides were identified by both methods. When the sample amount was increased to 32 ng, 274 protein groups and 465 peptides were identified by UPLC-MS/MS method while 319 protein groups and 935 peptides were identified by online SCX-microreactor-CZE-MS/MS method. Among them, 109 protein groups and 75 peptides were identified by both method. However, 612 protein groups and 1302 peptides were identified from 50 ng sample by UPLC-MS/MS method in contrast to 369 protein groups and 1275 peptides by online SCX-microreactor-CZE-MS/MS method. The reason may be due to the limited loading capacity of CZE compared to UPLC. However, the digestion used for UPLC analysis was prepared by offline method that the starting proteins were much higher amount than online sample preparation method (300 µg vs 50 ng). Of course, it is challenging to process 50 ng of lysate by an offline method. Moreover, the identification results were greatly improved when analysis of mass limited sample (<50 ng) by CZE-MS/MS method compared to UPLC-MS/MS method. This conclusion was in consistent with our previous results.20
On-column digestion using a longer separation capillary coupled to a Q Exactive HF mass spectrometer
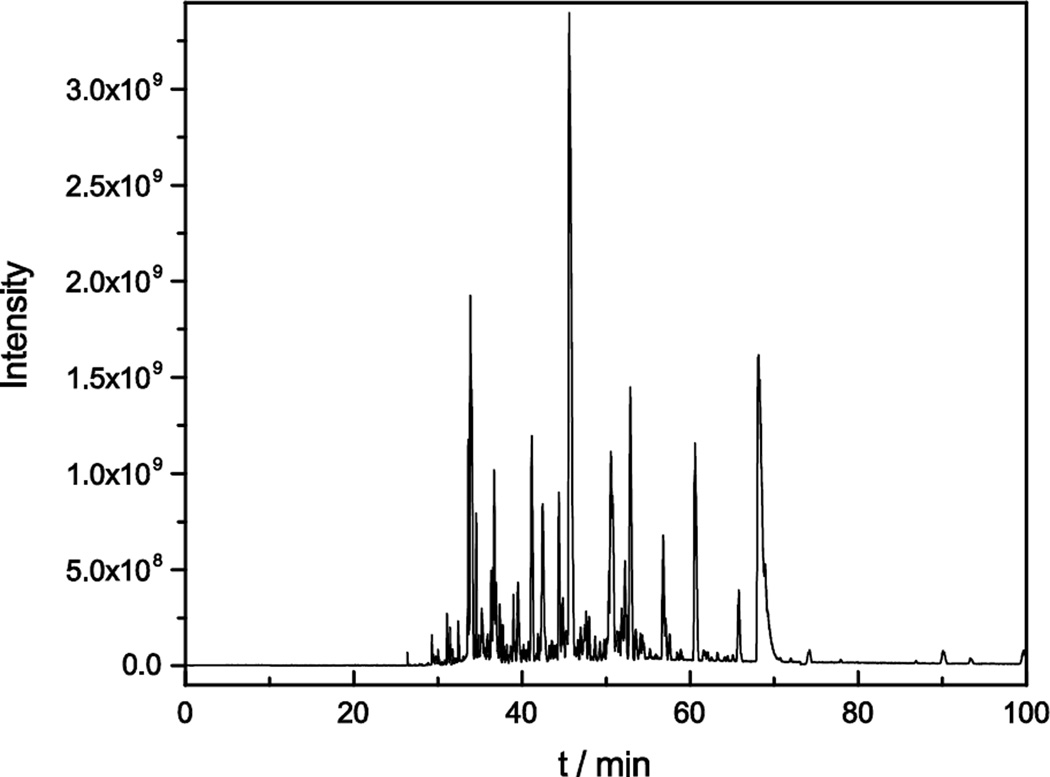
To further improve the identification result of the online sample preparation method, the microreactor was coupled to a longer separation capillary (~100 cm) and a Q Exactive HF mass spectrometer. A representative base-peak electropherogram is shown in Figure 6. 975 protein groups and 3,749 peptides were identified from 50 ng of Xenopus protein after online sample digestion with the microreactor. The separation window was increased from 45 min to 70 min by increasing the length of the separation capillary from 60 cm to 100 cm. More importantly, the faster speed of the Q Exactive HF mass spectrometer produced more tandem mass spectra during the separation.18–19
Figure 6.
Representative CZE-MS/MS analysis of the Xenopus protein digests by using a SCX monolith based microreactor coupled with a 100 cm long separation capillary. Experimental conditions: Q Exactive HF mass spectrometer; 50 μm i.d. × 150 μm o.d. × 100 cm long LPA coated separation capillary; 10 min digestion; 21.5 kV separation voltage; and 1.5 kV spray voltage. Other conditions are same as Figure 2.
The separation efficiency in this system was quite good. The data of Figure 6 generated 35,074 tandem spectra. We combined the parent ion m/z values in 0.01 Da wide bins. Selected ion electropherograms were generated for the resulting 6 172 parent ion m/z values. We then used an unsupervised least-square routine to fit Gaussian functions to the 100 most intense selected ion electropherograms; the algorithm used the maximum value as the initial guess for the peak amplitude, the time of the maximum value as the initial guess for the peak center, and 10 seconds as the initial guess for the peak width. The median peak width produced by the fitting algorithm was 5.6 s and the median number of theoretical plates was 240,000.
The signal-to-noise ratio for these peptides was outstanding. We estimated the noise in the background as the standard deviation between 3.3 and 19.7 minutes for the 100 most intense selected ion electropherograms, corresponding to 5,000 data points. The signal-to-noise ratio was estimated as the peak height from the Gaussian fit divided by the standard deviation between 3.3 and 19.7 min. The median signal-to-noise ratio was 80,000 for the 100 most intense electropherograms.
CONCLUSIONS
In this work, a SCX hybrid monolith based microreactor was couple to a LPA coated capillary for online reduction, alkylation, and digestion of the protein sample followed by direct CZE-MS/MS analysis. The alkylation step could be omitted without compromising the number of identifications. The time required for sample preparation was greatly decreased (~40 min) compared to a solution-based digestion method (~24 h). The online SCX-microreactor-CZE-MS/MS method showed much better performance than UPLC-MS/MS when the sample loading amount was less than 50 ng. Meanwhile, the CZE separation performance and the identification results were greatly improved by using long a LPA coated capillary and Q Exactive HF mass spectrometer. 975 protein groups and 3,749 peptides were identified from 50 ng of Xenopus protein after online sample digestion with the microreactor. Moreover, due to the negligible sample lost during sample preparation and the superior performance of CZE for analysis of mass limited sample, this on-column sample processing platform has great potential for high through-put analysis of low level samples, e.g. in generating the proteome of a single cell.14
Supplementary Material
Acknowledgments
We thank Dr. William Boggess in the Notre Dame Mass Spectrometry and Proteomics Facility for his help with this project. This work was funded by the National Institutes of Health (Grants R01GM096767 and R01HD084399).
Footnotes
ASSOCIATED CONTENT
Additional information as noted in text. This material is available free of charge via the Internet at http://pubs.acs.org.
REFERENCES
- 1.Ma J, Liu J, Sun L, Gao L, Liang Z, Zhang L, Zhang Y. Anal. Chem. 2009;81:6534–6540. doi: 10.1021/ac900971w. [DOI] [PubMed] [Google Scholar]
- 2.Ma J, Hou C, Sun L, Tao D, Zhang Y, Shan Y, Liang Z, Zhang L, Yang L, Zhang Y. Anal. Chem. 2010;82:9622–9625. doi: 10.1021/ac1023099. [DOI] [PubMed] [Google Scholar]
- 3.Sun L, Zhu G, Dovichi NJ. Anal. Chem. 2013;85:4187–4194. doi: 10.1021/ac400523x. [DOI] [PMC free article] [PubMed] [Google Scholar]
- 4.Zhou H, Elisma F, Denis NJ, Wright TG, Tian R, Zhou H, Hou W, Zou H, Figeys D. J. Proteome Res. 2010;9:1279–1288. doi: 10.1021/pr900767j. [DOI] [PubMed] [Google Scholar]
- 5.Liu J, Wang F, Lin H, Zhu J, Bian Y, Cheng K, Zou H. Anal. Chem. 2013;85:2847–2852. doi: 10.1021/ac400315n. [DOI] [PubMed] [Google Scholar]
- 6.Tian R, Wang S, Elisma F, Li L, Zhou H, Wang L, Figeys D. Mol. Cell. Proteomics. 2011;10:M110.000679. doi: 10.1074/mcp.M110.000679. [DOI] [PMC free article] [PubMed] [Google Scholar]
- 7.Li YH, Champion MM, Sun LL, Champion PAD, Wojcik R, Dovichi NJ. Anal. Chem. 2012;84:1617–1622. doi: 10.1021/ac202899p. [DOI] [PMC free article] [PubMed] [Google Scholar]
- 8.Sun L, Hebert AS, Yan X, Zhao Y, Westphall MS, Rush MJP, Zhu G, Champion MM, Coon JJ, Dovichi NJ. Angew. Chem. Int. Ed. Engl. 2014;53:13931–13933. doi: 10.1002/anie.201409075. [DOI] [PMC free article] [PubMed] [Google Scholar]
- 9.Wang Y, Fonslow BR, Wong CCL, Nakorchevsky A, Yates JR. Anal. Chem. 2012;84:8505–8513. doi: 10.1021/ac301091m. [DOI] [PMC free article] [PubMed] [Google Scholar]
- 10.Zhao SS, Zhong X, Tie C, Chen DDY. Proteomics. 2012;12:2991–3012. doi: 10.1002/pmic.201200221. [DOI] [PubMed] [Google Scholar]
- 11.Zhang Z, Wang F, Xu B, Qin H, Ye M, Zou H. J. Chromatogr. A. 2012;1256:136–143. doi: 10.1016/j.chroma.2012.07.071. [DOI] [PubMed] [Google Scholar]
- 12.Zhang Z, Sun L, Zhu G, Yan X, Dovichi NJ. Talanta. 2015;138:117–122. doi: 10.1016/j.talanta.2015.01.040. [DOI] [PMC free article] [PubMed] [Google Scholar]
- 13.Zhang Z, Yan X, Sun L, Zhu G, Dovichi NJ. Anal. Chem. 2015;87:4572–4577. doi: 10.1021/acs.analchem.5b00789. [DOI] [PMC free article] [PubMed] [Google Scholar]
- 14.Sun L, Bertke MM, Champion MM, Zhu G, Huber PW, Dovichi NJ. Sci. Rep. 2014;4:4365. doi: 10.1038/srep04365. [DOI] [PMC free article] [PubMed] [Google Scholar]
- 15.Smith PK, Krohn RI, Hermanson GT, Mallia AK, Gartner FH, Provenzano MD, Fujimoto EK, Goeke NM, Olson BJ, Klenk DC. Anal. Biochem. 1985;150:76–85. doi: 10.1016/0003-2697(85)90442-7. [DOI] [PubMed] [Google Scholar]
- 16.Wojcik R, Dada OO, Sadilek M, Dovichi NJ. Rapid Commun. Mass Spectrom. 2010;24:2554–2560. doi: 10.1002/rcm.4672. [DOI] [PubMed] [Google Scholar]
- 17.Krylov SN, Starke DA, Arriaga EA, Zhang Z, Chan NW, Palcic MM, Dovichi NJ. Anal. Chem. 2000;72:872–877. doi: 10.1021/ac991096m. [DOI] [PubMed] [Google Scholar]
- 18.Scheltema RA, Hauschild JP, Lange O, Hornburg D, Denisov E, Damoc E, Kuehn A, Makarov A, Mann M. Mol. Cell. Proteomics. 2014;13:3698–3708. doi: 10.1074/mcp.M114.043489. [DOI] [PMC free article] [PubMed] [Google Scholar]
- 19.Kelstrup CD, Jersie-Christensen RR, Batth TS, Arrey TN, Kuehn A, Kellmann M, Olsen JV. J. Proteome Res. 2014;13:6187–6195. doi: 10.1021/pr500985w. [DOI] [PubMed] [Google Scholar]
- 20.Zhu G, Sun L, Yan X, Dovichi NJ. Anal. Chem. 2013;85:2569–2573. doi: 10.1021/ac303750g. [DOI] [PMC free article] [PubMed] [Google Scholar]
Associated Data
This section collects any data citations, data availability statements, or supplementary materials included in this article.


