

Abstract
Most dynamic imaging protocols require long scan times that are beyond the range of what can be supported in a routine clinical environment and suffer from various difficulties related to step and shoot imaging techniques. In this short communication, we describe continuous bed motion (CBM) imaging techniques to create clinically relevant 15 min whole-body dynamic PET imaging protocols. We also present initial data that suggest that these CBM methods may be sufficient for quantitative analysis of uptake rates and rates of glucose metabolism. Multipass CBM PET was used in conjunction with a population-based input function to perform Patlak modeling of normal tissue. Net uptake rates were estimated and metabolic rates of glucose were calculated. Estimations of k3 (Ki/Vd) were calculated along with modeling of liver regions of interest to assess model stability. Calculated values of metabolic rates of glucose were well within normal ranges found in the previous literature. CBM techniques can potentially be used clinically to obtain reliable, quantitative multipass whole-body dynamic PET data. Values calculated for normal brain were shown to be within previously published values for normal brain glucose metabolism.
Keywords: continuous bed motion, dynamic PET, glucose metabolism, kinetic modeling, molecular imaging, PET, whole-body imaging
Introduction
The ability to obtain more robust quantitative information than that provided by the use of standardized uptake values from PET images has been a goal of many studies 1,2. Although techniques have been proposed to mitigate some of the challenges associated with clinical dynamic imaging protocols, such as dual time point imaging 3 and recently funded work by Li 4, these techniques require long delays between imaging points with minimal temporal sampling or necessitate the use of complex models or robust computing systems to calculate the parameter values. Thus, these methods are not commonly used in routine clinical practice.
Recent studies have shown the use of step and shoot techniques in whole-body dynamic studies, although the usage of step and shoot techniques requires substantial manual intervention to acquire and process the data 5–7. These techniques also suffer from issues specific to step and shoot imaging, such as overlapping bed positions. More recently, we have shown the possible utility of continuous bed motion (CBM) PET techniques in acquiring whole-body dynamic data that results in a simpler workflow and eliminates overlap and overscan issues associated with step and shoot techniques 8.
Here, we describe methodologies and results for whole-body dynamic PET. Most importantly, we demonstrate a 15 min whole-body dynamic imaging protocol with quantitative modeling results compared with standard dynamic imaging techniques and previously published results. The 15 min protocol is a promising method that may enable adoption of routine clinical use of whole-body kinetics and ultimately provide clinicians with greater information on assessment of patient disease by enabling simultaneous reporting of standardized uptake value and more quantitative information such as metabolic rates of glucose (MRGlu) or uptake rates (Ki). This work is timely with the recent release of a commercial CBM PET imaging platform and the increased interest in recent years in more robust whole-body dynamic imaging.
Methods
Overview
Two new CBM acquisition methods were developed and tested for the purposes of acquiring and testing whole-body dynamic PET data using CBM techniques. The first method was created specifically to test the use of CBM PET for whole-body dynamic imaging using common dynamic imaging frameworks to assess the quantitative accuracy of CBM dynamic techniques. The second method focused on techniques that enabled a 15 min whole-body dynamic acquisition protocol that could be used to quantify uptake rates and MRGlu.
Patients
Patients for this study were recruited from our institution’s outpatient PET population. All patients were older than 18 years of age and provided signed consent to participate in a University of Tennessee Graduate School of Medicine Institutional Review Board (IRB)-approved protocol (#3732). Standard 1 h dynamic PET imaging was performed on three patients, whereas six patients were imaged using the proposed 15 min multipass dynamic CMB method.
All patients underwent dynamic PET/CT imaging with fluorine-18 fluorodeoxyglucose (18F-FDG). Blood glucose was measured for each patient before their exam and determined to be within normal ranges before beginning their imaging study with an average reading of 105 mg/dl. Each patient was administered ∼10 mCi of 18F-FDG either in the injection room or on the PET/CT imaging table.
Acquisition methods
Method 1: 1 h CBM PET whole-body imaging
Whole-body dynamic imaging was performed using a common 1 h scan protocol. Patients were injected with 18F-FDG on the imaging table with the PET data acquisition beginning ∼5 s before injection. An initial single-bed list-mode acquisition of 60–180 s was acquired over the heart to capture image-derived input function data similar to the methods described by Sayre et al. 9. Immediately following the static acquisition, a 60 min multipass CBM PET acquisition was started with 11–15 passes per scan. Each pass was completed over an axial range beginning at the mid-brain extending to the thigh. Computed tomographic (CT) data were acquired with a pitch of 1 and a slice thickness of 5 mm using X-ray tube settings of 120 kVp with automatic current modulation. Static PET/CT imaging was acquired at 60 min postinjection.
Method 2: 15 min CBM acquisition with population-based input functions
The second method used a 15 min multipass CBM PET acquisition sequence along with the population-based input function, often referred to as the Feng Input Function 10. Patients were injected with 18F-FDG in the injection room and then kept in a holding area for ∼40 min before PET/CT imaging. The dynamic PET acquisition consisted of a 15 min multibed pass dynamic acquisition beginning at 45 min after injection. The axial range extended from the mid-brain to thigh with six bed passes completed during the 15 min acquisition time. CT data acquired for method 2 were identical to the protocol used for method 1. Static PET/CT imaging was acquired at 60 min postinjection.
Data analysis
Standard list-mode acquisitions were histogrammed with time frames of: 10×3, 4×5, 1×90, and 10×278 s whereas the multipass CBM data are limited to approximately equal time frames over the course of the acquisition (six frames over 15 min). All data were reconstructed using point spread function and time-of-flight algorithms (UltraHD PET; Siemens Medical Solutions USA Inc., Malvern, Pennsylvania, USA) into a 200×200 image matrix (4.07 mm voxel size) and 5 mm slice thickness. A 3 mm Gaussian filter was applied to the data during reconstruction and CT-based scatter and attenuation correction was performed. CT data were reconstructed into a 512×512 image matrix with 5 mm axial slices.
Regions of interest (ROIs) were drawn in the aorta, brain, and livers of patients. Regions in the aorta were drawn using a 10×10×10 mm cylinder placed ∼2 cm below the aortic arch and were used as image-derived input functions (IDIFs) or for scaling of the population-based input function. The region in the aorta was chosen instead of a region in the left ventricle as it has been shown that partial volume effects are reduced for IDIFs drawn in the aorta versus the left ventricle 11. Brain regions were drawn by first segmenting the entire brain and then setting a lower threshold of 40% of the maximum activity concentration as measured by a rectangular ROI covering the entire brain (selection of primarily white matter). Regions in the liver were drawn using a spherical ROI of at least a 3 cm radius drawn in the lower right lobe. Time activity curves were generated for each ROI using the Inveon Research Workplace software, version 4.2 (Siemens Healthcare, Knoxville, Tennessee, USA).
Kinetic modeling was performed using Patlak analysis given by the standard equation 12:
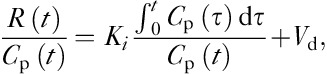 |
where Ki is determined by calculating the slope of the two ratios plotted against each other. MRGlu was then calculated as follows:
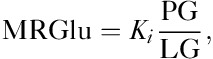 |
where PG is the plasma glucose of the individual patient measured before imaging and LC is the lumped constant that, for our analysis, was assumed to be ∼0.89 13. For method 1, the regions drawn on the aorta were used as an IDIF for Patlak modeling whereas method 2 used fitting to the well-known Feng input function scaled by the mean activity concentration values determined by the aorta ROIs for model parameter estimation. For the 1 h dynamic protocol, time activity curves generated from the initial list-mode acquisition over the heart were combined with those measured during the remaining multibed pass imaging to create the complete IDIF.
Uptake rate and MRGlu values along with 95% confidence intervals (CIs) were calculated for ROIs in white matter for comparison with previous literature and across methods 14,15. Values were also calculated for a region in the liver for assessment of stability of the modeling approach used. The ratio of Ki and Vd was calculated as an estimate of k3 and coefficients of variation (CV) of this parameter calculated for further assessment of model stability as this value should be fairly stable across all patients imaged in this population 16. Student’s t-test was used to compare the means for each calculated value across each method.
Results
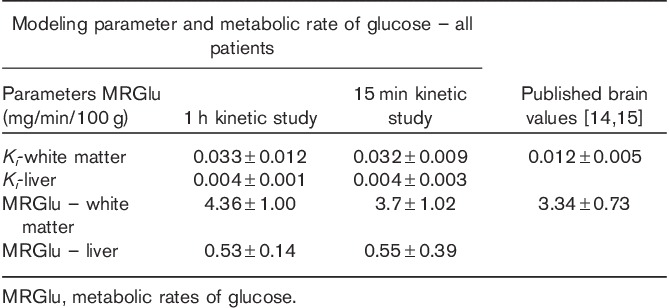
The first method of acquisition using CBM PET with an initial list-mode acquisition over the heart resulted in typical values for uptake rate and MRGlu found in the literature 14,15. Patlak modeling resulted in Ki values for the brain of 0.033±0.012 and a corresponding average MRGlu of 4.26±1.00 (95% CI: 3.14–5.39) mg/min/100 g. Modeling parameters calculated for liver tissue regions showed model stability with uptake rates in the liver of 0.004±0.001 and MRGlu values of 0.53±0.14 (95% CI: 0.28–0.8). Estimations of k3 values also showed little variability with a mean value of 0.036±0.009 and CV of less than 28%, indicating relatively low variability.
The second method using a population-based input function with only a 15 min multipass dynamic acquisition protocol also resulted in values matching the literature 14,15. Calculated means and 95% CIs for brain MRGlu and Ki almost matched those measured with the standard 60 min workflow. Ki values for the brain were 0.032±0.009, resulting in an average MRGlu of 3.70±1.02 (95% CI: 2.94–4.45) mg/min/100 g, with a representative parametric image generated from this model shown in Fig. 1. Calculated liver Ki values were 0.004±0.003 and average MRGlu values were 0.55±0.39 (95% CI: 0.26–0.85). This technique also showed excellent stability, with values of k3 being 0.026±0.007, with a CV of only 27%. Mean parameter values calculated using methods 1 and 2 did not show any statistically significant difference (P>0.1). A summary of the data is provided in Table 1 with values from previously published results.
Fig. 1.
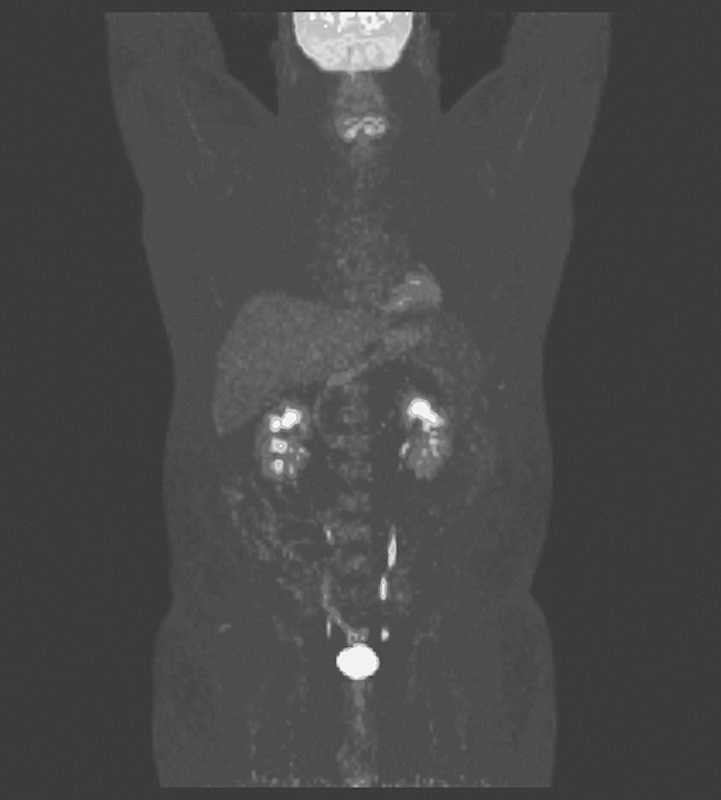
A parametric image generated by calculating Ki values for each voxel on the basis of the continuous bed motion Patlak modeling methods used.
Table 1.
A comparison of Patlak modeling parameters between the standard 1 h dynamic techniques and our 15 min dynamic protocol
Discussion
We have described a novel 15 min dynamic workflow that potentially enhances current techniques for whole-body dynamic imaging with PET. Our group has previously shown potential benefits of CBM techniques compared with step and shoot imaging 17; however, this work shows that CBM techniques can also be used to perform whole-body dynamic PET imaging on a clinical platform. CBM PET techniques applied to standard whole-body dynamic imaging principles achieve expected quantitative results compared with standard dynamic imaging methods and previously published values. We have also shown that these techniques can enable a novel 15 min methodology by which whole-body dynamic PET imaging may be performed. This acquisition method is possible within clinically acceptable scan times while also providing sufficient data points to confirm model accuracy and can be used to generate parametric maps. This novel methodology and preliminary work adds to the current body of literature and provides additional insights into the routine use of whole-body dynamic PET protocols in clinical practice that may yield greater information for clinical disease assessment. More testing is required to fully assess the benefits of these techniques and their clinical significance.
Acknowledgements
Conflicts of interest
Dustin Osborne and Shelley Acuff occasionally provide expert testimonial for Siemens Medical Solutions USA Inc.
References
- 1.Kinahan PE, Fletcher JW. PET/CT standardized uptake values (SUVs) in clinical practice and assessing response to therapy. Semin Ultrasound CT MR 2010; 31:496–505. [DOI] [PMC free article] [PubMed] [Google Scholar]
- 2.Keyes JW., Jr SUV: standard uptake or silly useless value? J Nucl Med 1995; 36:1836–1839. [PubMed] [Google Scholar]
- 3.Zhu W, Li Q, Bai B, Conti PS, Leahy RM. Patlak image estimation from dual time-point list-mode PET data. IEEE Trans Med Imaging 2014; 33:913–924. [DOI] [PMC free article] [PubMed] [Google Scholar]
- 4.Li Q. Quantitative methods for clinical whole body dynamic PET. Boston, MA: Massachusetts General Hospital: National Institute of Biomedical Imaging and Bioengineering; 2014.
- 5.Karakatsanis NA, Lodge MA, Tahari AK, Zhou Y, Wahl RL, Rahmim A. Dynamic whole-body PET parametric imaging: I. Concept, acquisition protocol optimization and clinical application. Phys Med Biol 2013; 58:7391–7418. [DOI] [PMC free article] [PubMed] [Google Scholar]
- 6.Lodge M, Rahmim A, Karakatsanis N, Zhou Y, Mhlanga J, Tahari A, Wahl R. Implementation and evaluation of a dynamic whole-body PET/CT protocol. J Nucl Med 2012; 2012:53. [Google Scholar]
- 7.Karakatsanis NA, Yun Z, Lodge MA, Casey ME, Wahl RL, Rahmim A. Quantitative whole-body parametric PET imaging incorporating a generalized Patlak model. Paper presented at: Nuclear Science Symposium and Medical Imaging Conference (NSS/MIC), 2013 IEEE; 27 October 2013–2 November 2013, Seoul, South Korea.
- 8.Osborne D, Acuff S. Whole-body clinical dynamic imaging and Patlak modeling using continuous bed motion techniques. J Nucl Med 2014; 2014:55. [Google Scholar]
- 9.Sayre GA, Franc BL, Seo Y. Patient-specific method of generating parametric maps of Patlak Ki without blood sampling or metabolite correction: a feasibility study. Int J Mol Imaging 2011; 2011:12. [DOI] [PMC free article] [PubMed] [Google Scholar]
- 10.Feng D, Wang X. A computer simulation study on the effects of input function measurement noise in tracer kinetic modeling with positron emission tomography (PET). Comput Biol Med 1993; 23:57–68. [DOI] [PubMed] [Google Scholar]
- 11.De Geus-Oei LF, Visser EP, Krabbe PF, van Hoorn BA, Koenders EB, Willemsen AT, et al. Comparison of image-derived and arterial input functions for estimating the rate of glucose metabolism in therapy-monitoring 18F-FDG PET studies. J Nucl Med 2006; 47:945–949. [PubMed] [Google Scholar]
- 12.Patlak CS, Blasberg RG, Fenstermacher JD. Graphical evaluation of blood-to-brain transfer constants from multiple-time uptake data. J Cereb Blood Flow Metab 1983; 3:1–7. [DOI] [PubMed] [Google Scholar]
- 13.Graham MM, Muzi M, Spence AM, O’Sullivan F, Lewellen TK, Link JM, Krohn KA. The FDG lumped constant in normal human brain. J Nucl Med 2002; 43:1157–1166. [PubMed] [Google Scholar]
- 14.Phelps ME, Huang SC, Hoffman EJ, Selin C, Sokoloff L, Kuhl DE. Tomographic measurement of local cerebral glucose metabolic rate in humans with (F-18)2-fluoro-2-deoxy-D-glucose: validation of method. Ann Neurol 1979; 6:371–388. [DOI] [PubMed] [Google Scholar]
- 15.Wu L-C, Feng D-G, Wang J-K, Lin H-M, Chou K-L, Lin R-S, et al. Quantitative analysis of FDG PET images. Ann Nucl Med Sci 1998; 11:29–33. [Google Scholar]
- 16.Thie J. Robust surrogate k3 from Patlak analysis. J Nucl Med 2008; 2008:49. [Google Scholar]
- 17.Osborne DR, Acuff S, Cruise S, Syed M, Neveu M, Stuckey A, Bradley Y. Quantitative and qualitative comparison of continuous bed motion and traditional step and shoot PET/CT. Am J Nucl Med Mol Imaging 2015; 5:56–64. [PMC free article] [PubMed] [Google Scholar]