

Abstract
This study explores the association between parental perception of the nutritional quality of school meals and whether students eat lunch served at school. We use data from five low-income cities in New Jersey that have high minority populations. Students whose parents perceive the quality of school meals to be healthy have greater odds of eating meals served at school. Recent changes in guidelines for the United States Department of Agriculture’s National School Lunch Program met with resistance from several fronts. Advocates for and implementers of improved school meals may benefit from partnering with parents to increase the acceptance and utilization of improved school offerings.
Keywords: Parental perception of school meals, School meals programs
Introduction
The United States Department of Agriculture’s (USDA) National School Lunch Program (NSLP) is offered in 94% of public and private schools across the country (Ralston, Newman, Clauson, Guthrie, & Buzby, 2008). According to the School Nutrition and Dietary Assessment IV reports (Fox & Condon, 2012), on an average day in 2009–10, 63% of all students in NSLP public schools participated in the program, with students eligible for free and reduced price meals participating at higher rates (79% and 73%) than those paying full price (48%). In 2012, the USDA implemented revised nutritional guidelines for school meals (USDA, 2012) based on the 2010 Healthy Hunger Free Kids Act (USDA Food and Nutrition Services, 2012). The new guidelines require schools to add more fruit, vegetables, and whole grains to school meals; to limit milk to lower-fat options only; and to reduce saturated fats, trans fats, sodium, and calorie content of the meals. These new guidelines received a mixed response from lawmakers and School Food Authorities (SFA) resulting in temporary reversal on some rulings (USDA Food and Nutrition Services (a), 2012; Bogardus, 2012). Student protests against new healthier meals have captured the attention of social media sites across the country (EarthTalk, 2012).
Parents have supported improving the nutritional quality of school meals (DiCamillo & Field, 2012; Goldberg et al., 2009; Harris, Milici, Sarda, & Schwartz, 2012) to improve children’s diets and to reduce the prevalence of obesity. As a result, advocacy agencies see parents as effective potential partners in promoting healthier school meals (CSPI). Understanding how parental perception of the nutritional quality of food served at school affects their children’s participation in school meals can be critical for achieving improvements in school meals and for increasing the acceptance of such changes.
Methods
Data were obtained from a random digit dial phone survey of 1708 household with at least one child in the 3–18 year age group living in five low-income New Jersey cities in 2009–10. These data were collected as part of the New Jersey Childhood Obesity Study conducted in Camden, New Brunswick, Newark, Trenton, and Vineland. Survey participants were offered an incentive of $10 for completing the survey, which was conducted in English and Spanish. The respondent, an adult parent or guardian who made most of the decisions about food shopping for the household, provided information on a randomly selected 3–18 year old child in the household and on household and parent level demographics. For this paper, analyses were limited to data obtained from parents of 1220 school-going children, referred to as students, with non-missing data on variables of interest.
The questions included in the phone survey were obtained and adapted from previous research and were field tested prior to use. Data on the outcome variable for the current analyses were collected by asking the parents “On most school days, does index child have a lunch served by the school?” Responses were coded as 1 for yes, and 0 for no. This question was adapted from a similar question that asked “How many days does your child typically get lunch in the cafeteria line?” and has been shown to have good reliability (Joe, Carlson, Sallis). Parental perception about healthfulness of school meals was obtained by asking “Regardless of whether or not index child eats food provided by his/her school, how would you rate the nutritional quality of foods offered at index child’s school?” Responses were obtained on a four-point Likert scale from very unhealthy coded as 1 to very healthy coded as 4. Further, parents were asked if their child was eligible for free or reduced meals served at school. Responses were coded as 1 for yes and 0 for No. Additional variables used in the analysis included parent reports on child’s age, race, gender, household income, parental education level, and whether the parent was foreign born. Descriptive and bivariate analyses were used to examine the data. Multivariate logistic regression analyses were used to assess the association between students’ consumption of meals served by school as the dependent variable and parental perception of the healthfulness of the school meal as an independent variable, controlling for parent and student level factors. Household income was not included in the regression analysis because it was highly correlated with student’s school meal eligibility status. All analyses were conducted using complex survey procedures in Stata Version 10 SE, to adjust for clustering of the sample within the five study cities. Sampling weights were used for all statistics reported so the results were representative of children in the five cities. All statistical tests were considered significant at p < .05. This study was approved by the author’s institutional review board.
Results
As shown in Table 1 and 60% of the students were elementary school age and the rest were older. Over three quarters of the students came from household with income below 200% of the federal poverty line. The majority of the students were non-Hispanic black (44.7%) or Hispanic (41.6%), and 70% were eligible for free and reduced price meals. Figure 1 shows that, compared to children whose parents perceived the lunch to be somewhat unhealthy (71.6%), a significantly higher proportion of students whose parents perceived the school lunch as somewhat healthy (89%) or very healthy (92%) ate lunch served at school. On the other hand, as shown in Fig. 2, parents of students who participated in free and reduced price lunches were equally likely to rate the nutritional quality of the meals into any of the four categories (from very unhealthy to very healthy).
Table 1.
Demographic characteristics of the sample (n = 1220).
| % Samplea | |
|---|---|
| Gender | |
| Male | 50.6 |
| Female | 49.4 |
| Age | |
| 5–11 | 60 |
| 12–18 | 40 |
| Race | |
| Non-Hispanic white | 9.4 |
| Non-Hispanic black | 44.7 |
| Hispanic | 41.6 |
| Other | 4.2 |
| Eligible for free or reduced price meal at school | |
| No | 30 |
| Yes | 70 |
| Household poverty category | |
| ≤200% of the FPL | 75.8 |
| >200% of the FPL | 24.2 |
| Mother’s education | |
| High school | 61.1 |
| Some college | 21.6 |
| College graduate | 17.4 |
| Parent foreign born | |
| No | 72.6 |
| Yes | 27.3 |
| Parents perceive meals served at school are healthy | |
| Very healthy | 7.7 |
| Somewhat healthy | 13.7 |
| Somewhat unhealthy | 47.5 |
| Very unhealthy | 31.1 |
| Student eats lunch at school | |
| No | 12.8 |
| Yes | 87.2 |
Sample weighted.
Fig. 1.
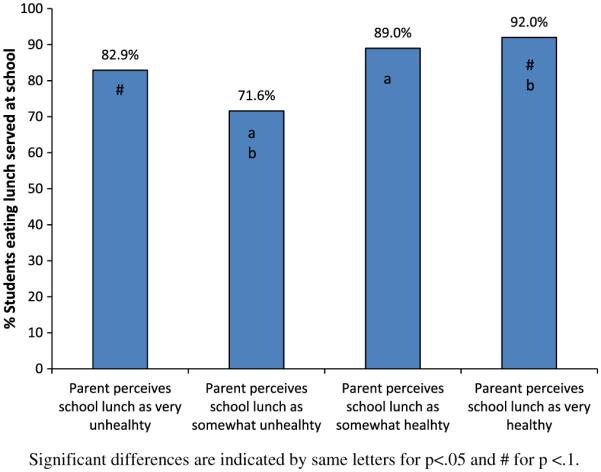
Percentage of students eating lunch served at school by parents’ perception of the healthfulness of the lunch served.
Fig. 2.
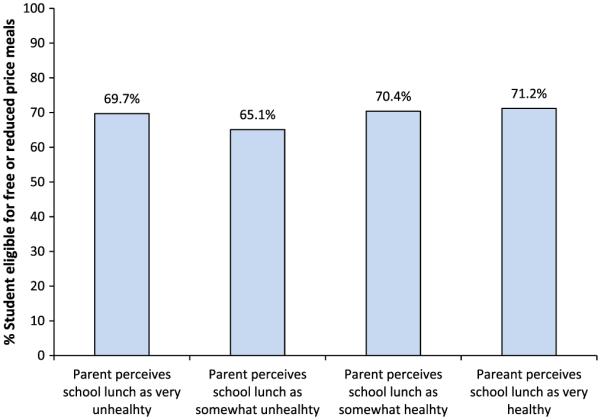
Percentage of students eligible for free and reduced price meals by parents’ perception of the healthfulness of the lunch served.
Table 2 shows the results from multivariate logistic regression. After adjusting for student and parent demographic characteristics, including participation in free and reduced price meals, parental perception of school meals was a significant predictor of the odds of a student eating lunch served at school. Compared to students whose parents perceived the meals served at school as very healthy, students whose parents perceived the meals to be very unhealthy (OR = 0.40, 95% CI: 0.15–1.03) or unhealthy (OR = 0.24, 95% CI: 0.11–0.53) had lower odds of eating lunch served at school. Among the covariates, students’ eligibility for free or reduced price meals was significantly associated with higher odds of students eating lunch served by school (OR 5.59, 95% CI 3.03–10.30). In addition, non-Hispanic black students and Hispanic students had significantly higher odds for eating lunch served at school compared to non-Hispanic white students. We used an interaction term to assess the prospect that the relationship between parental perception and parent reported school meal participation may be moderated by student’s eligibility for free and reduced price meals. However, this interaction was not significant (results not shown).
Table 2.
Results of multivariate logistic regression analysis of association of a student’s odds of eating lunch served at school with child and parent level variable (n = 1220).
| Odds ratio | 95% CI | p-Value | |
|---|---|---|---|
| Gender | |||
| Male | Referent | ||
| Female | 0.63 | 0.36–1.12 | 0.118 |
| Age | |||
| 5–11 | Referent | ||
| 12–18 | 0.92 | 0.53–1.62 | 0.786 |
| Race | |||
| Non-Hispanic white | Referent | ||
| Non-Hispanic black | 3.50 | 1.75–6.99 | <.001 |
| Hispanic | 2.43 | 1.32–4.49 | 0.005 |
| Other | 0.79 | 0.31–2.04 | 0.633 |
| Eligible for free or reduced price meal at school | |||
| No | Referent | ||
| Yes | 5.59 | 3.03–10.30 | <.001 |
| Mother’s education | |||
| High school | Referent | ||
| Some college | 1.28 | 0.69–2.37 | 0.435 |
| College graduate | 1.11 | 0.58–2.13 | 0.744 |
| Parent foreign born | |||
| No | Referent | ||
| Yes | 1.36 | 0.71–2.61 | 0.357 |
| Parents perceive meals served at school are healthy | |||
| Very healthy | Referent | ||
| Somewhat healthy | 0.82 | 0.40–1.68 | 0.589 |
| Somewhat unhealthy | 0.24 | 0.11–0.53 | <.001 |
| Very unhealthy | 0.40 | 0.15–1.03 | 0.057 |
Sample weighted and SE adjusted for complex survey design.
Discussion
Among predominantly low-income, minority students, parental perception of the nutritional quality of school meals was independently associated with whether students ate meals served at school, after adjusting for demographic factors including eligibility for free and reduced price meals. School meals play a critical role in students’ overall dietary intake. Students consume up to 2 meals and a snack at school (Stallings, Suitor, & Taylor, 2009) accounting for almost half of their daily calories (Gleason & Suitor, 2001). Lower income children, eligible for free and reduced priced meals, participate in school meal programs at a higher rate than do those who are not eligible for such benefits (Fox & Condon, 2012). While a number of concerns were raised about the nutritional quality of school meals prior to the recent update of school meal guidelines (Crepinsek, Gordon, McKinney, Condon, & Wilson, 2009), studies have consistently shown that students who participate in NSLP consume more fruits, vegetables, and milk (Condon, Crepinsek, & Fox, 2009; Krebs-Smith, Guenther, Subar, Kirkpatrick, & Dodd, 2010), components of the diet that are often lacking in the diets of school-age children (Krebs-Smith et al., 2010). The USDA implemented revised guidelines governing reimbursable school meals starting in school year 2012 (USDA, 2012). Our finding that parental perception of the nutritional quality of meals served at school is a significant predictor of whether students eat at school suggests that keeping parents informed about changes in school meals is critical to successful implementation of nutritional guidelines to ensure that more students take advantage of healthier school meals. Parents, key stakeholders in children’s nutrition, have supported making improvements in school meals (DiCamillo & Field, 2012; Harris et al., 2012) and have shown interest in obtaining additional information so they can discuss meal options with their children (Bailey-Davis et al., 2013; Goldberg et al., 2009). The USDA is in the process of developing guidance for competitive foods served in schools. It is likely that these guidelines, like the school meal guidelines, will receive resistance from various quarters. Schools and health advocates may want to partner with parents to help mitigate such resistance and to improve students’ access to healthier school food offerings.
It is conceivable, given our cross-sectional design, that students’ exposure to the schools’ meals may have influenced their parents’ perceptions of nutritional quality in our analysis; regardless of the direction of the causal relationship, parent perceptions may be key to their students’ sustained participation. While this study was conducted prior to the release of the new USDA school food guidelines, the result showing that parents’ perception of school food offerings is a strong predictor of student school meal participation is pertinent to the discussion about implementation of the new guidelines. To our knowledge, this is the first study based on a large diverse sample that examines this relationship using quantitative techniques. Future longitudinal studies are needed to understand the direction of causality between parent perception of nutritional quality of school meals and students participation. Another limitation of the study is that the outcome variable did not distinguish between reimbursable and non-reimbursable meals. However, more than two thirds of the children in the sample were eligible for free and reduced meals, and nationally, three quarters of the children eligible for these benefits participate in school meals. Therefore, most students who ate at school likely participated in NSLP.
Conclusions
Students’ participation in meals served at school was independently associated with whether their parents perceived those meals to be healthy. Parents can be key stakeholders in improving the nutritional quality of meals served at schools. As new nutritional guidelines for reimbursable and competitive foods are established, advocates for and implementers of improved school guidance may benefit from partnering with parents to increase the utilization of improved school offerings.
Footnotes
Acknowledgements: This research was supported by a grant from The Robert Wood Johnson Foundation. The author is grateful to Dr. Michael Todd and Dr. Michael Yedidia for useful discussions.
Reference
- Bailey-Davis L, Virus A, McCoy TA, Wojtanowski A, Vander Veur SS, Foster GD. Middle school student and parent perceptions of government-sponsored free school breakfast and consumption. A qualitative inquiry in an urban setting. Journal of the Academy of Nutrition and Dietetics. 2013;113(2):251–257. doi: 10.1016/j.jand.2012.09.017. [DOI] [PubMed] [Google Scholar]
- Bogardus K. USDA changes school lunch requirements. The Hill’s Blog Briefing Room. 2012 Dec 8; http://thehill.com/blogs/blog-briefing-room/news/271813-usda-changes-school-lunch-requirements
- Condon EM, Crepinsek MK, Fox MK. School meals. Types of foods offered to and consumed by children at lunch and breakfast. Journal of the American Dietetic Association. 2009;109(2):S67–S78. doi: 10.1016/j.jada.2008.10.062. [DOI] [PubMed] [Google Scholar]
- Crepinsek MK, Gordon AR, McKinney PM, Condon EM, Wilson A. Meals offered and served in US public schools. Do they meet nutrient standards? Journal of the American Dietetic Association. 2009;109(2):S31–S43. doi: 10.1016/j.jada.2008.10.061. [DOI] [PubMed] [Google Scholar]
- CSPI: Center for Science in Public Interest School lunches get a makeover. http://cspinet.org/nutritionpolicy/School-Meals-Tip-Sheet-Parents.pdf
- DiCamillo M, Field M. Unhealthy eating, lack of physical activity seen as greatest health risk facing Californians. 2012 http://www.field.com/fieldpollonline/subscribers/Rls2408.pdf
- EarthTalk Meal Thicket. Students balk at new school lunch nutrition standards. 2012 http://www.scientificamerican.com/article.cfm?id=new-nutrition-standards-for-school-lunches
- Fox MK, Condon EM. School Nutrition Dietary Assessment Study – IV. 2012 http://www.mathematica-mpr.com/publications/PDFs/nutrition/snda-iv_findings.pdf
- Gleason PM, Suitor C. Children’s diets in the mid-1990s dietary intake and its relationship with school meal participation. 2001 http://www.fns.usda.gov/ora/menu/published/CNP/FILES/ChilDiet.pdf
- Goldberg JP, Collins JJ, Folta SC, McLarney MJ, Kozower C, Kuder J, et al. Retooling food service for early elementary school students in Somerville, Massachusetts. The Shape Up Somerville experience. Preventing Chronic Disease. 2009;6(3):A103. [PMC free article] [PubMed] [Google Scholar]
- Harris J, Milici FF, Sarda V, Schwartz MB. Food marketing to children and adolescents. What do parents think? 2012 http://www.yaleruddcenter.org/resources/upload/docs/what/reports/Rudd_Report_Parents_Survey_Food_Marketing_2012.pdf
- Joe L, Carlson JA, Sallis JF. Active Where? Individual items reliability statistics parent/child survey. http://www.drjamessallis.sdsu.edu/Documents/AW_item_reliability_ParentChild.pdf
- Krebs-Smith SM, Guenther PM, Subar AF, Kirkpatrick SI, Dodd KW. Americans do not meet federal dietary recommendations. Journal of Nutrition. 2010;140(10):1832–1838. doi: 10.3945/jn.110.124826. [DOI] [PMC free article] [PubMed] [Google Scholar]
- Ralston K, Newman C, Clauson A, Guthrie J, Buzby JC. The National School Lunch Program Background, Trends, and Issues (Economic Research Report No. 61) 2008 http://www.ers.usda.gov/publications/err-economic-research-report/err61.aspx
- Stallings V, Suitor C, Taylor C. School meals. Building blocks for healthy children. Institute of Medicine. 2009 http://www.iom.edu/Reports/2009/School-Meals-Building-Blocks-for-Healthy-Children.aspx [PubMed]
- USDA Final rule. Nutrition standards in the National School Lunch and School Breakfast Programs. 2012 http://www.fns.usda.gov/cnd/Governance/Legislation/nutritionstandards.htm [PubMed]
- USDA Food and Nutrition Service (a) FNS guidance to school food authorities. Flexibility in the meat/meat alternate and grain maximums for school year 2012–2013. SP 11-2013 Revised. 2012 http://www.fns.usda.gov/cnd/governance/Policy-Memos/2013/SP11-2013os.pdf
- USDA Food and Nutrition Service Healthy Hunger-Free Kids Act. Nutritional standards in the National School Lunch and Breakfast Programs. FNS-2007-0038. 2012 http://www.fns.usda.gov/cnd/governance/legislation/CNR_2010.htm