

SUMMARY
Normal repair of skeletal muscle requires local expansion of a special population of Foxp3+CD4+ regulatory T (Treg) cells. Such cells failed to accumulate in acutely injured muscle of old mice, known to undergo ineffectual repair. This defect reflected reduced recruitment of Treg cells to injured muscle, as well as less proliferation and retention therein. Interleukin (IL)-33 regulated muscle Treg cell homeostasis in young mice, and its administration to old mice ameliorated their deficits in Treg cell accumulation and muscle regeneration. The major IL-33-expressing cells in skeletal muscle displayed a constellation of markers diagnostic of fibro/adipogenic progenitor cells, and were often associated with neural structures, including nerve fibers, nerve bundles and muscle spindles, which are stretch-sensitive mechanoreceptors important for proprioception. IL-33+ cells were more frequent after muscle injury, and were reduced in old mice. IL-33 is well situated to relay signals between the nervous and immune systems within the muscle context.
INTRODUCTION
Foxp3+CD4+ regulatory T (Treg) cells play a key role in immune-system homeostasis. Classically, they have been associated with various types of immune responses, but more recently, they were found to operate in diverse non-immunological contexts as well. For example, visceral-adipose-tissue (VAT) Treg cells regulate local and systemic inflammation and metabolism (Feuerer et al., 2009), and a distinct population of Treg cells in skeletal muscle potentiates regeneration in acute and chronic injury models (Burzyn et al., 2013). At both of these sites, Treg cells can exert a direct influence on local parenchymal cells or their progenitors, in addition to regulating macrophage activities.
Skeletal muscle is a highly specialized tissue composed largely of post-mitotic, multinucleate cells (myofibers) that rarely turn over in the absence of damage. Upon injury, muscle mounts a robust regenerative response that supports repair or replacement of almost all of the neighboring myofibers. Muscle regeneration is dependent on a pool of quiescent, committed, self-renewable precursors, called satellite cells, found beneath the basal lamina in juxtaposition to muscle fibers (Jang et al., 2011). Injury induces satellite cells to become activated, proliferate, differentiate and either form new myofibers or fuse to existing ones. Leukocytes such as neutrophils, eosinophils, monocytes and macrophages are critical to the regenerative response, arriving within hours of injury; CD4+ and CD8+ T cells join in over time and are generally thought to impede tissue repair (Tidball and Villalta, 2010; Heredia et al., 2013). In contrast, Treg cells enhance repair, accumulating in both acute and chronically injured muscle to constitute 40–50% of CD4+ T cells (Burzyn et al., 2013), well above the typical circulating frequency of 10–15%. The increase in Treg cell representation correlates with a switch in myeloid-lineage populations from a pro- to an anti-inflammatory phenotype, and punctual depletion of Tregs inhibits this phenotypic switch (Burzyn et al., 2013). Muscle Treg cells display a distinct, clonally expanded, T cell receptor (TCR) repertoire that shows signs of antigenic selection. The muscle Treg cell transcriptome, while enriched for signature transcripts, differs substantially from those of Treg cells found in lymphoid tissues.
Aging of skeletal muscle, like that of most mammalian tissues, is associated with a steady decline in both function and regenerative capacity (Jang et al., 2011). The defect in regeneration is due at least in part to an age-associated decrease in satellite cell frequency and function. The molecular mechanisms underlying reduction of the satellite pool are the focus of ongoing investigation, with studies on heterochronic parabiotic mice suggesting an important contribution of circulating factors and/or migratory immune-system cells (Conboy et al., 2005; Brack et al., 2007; Sinha et al., 2014). Treg cell representation within lymphoid tissues has repeatedly been shown to increase with age (Nikolich-Zugich, 2014); yet little is known about concomitant effects on their trafficking to and function within nonlymphoid tissues in response to various challenges.
Here we address whether numerical or phenotypic alterations in local Treg cells subtend the poor muscle regeneration of old mice. We report a severe age-dependent decline in Treg cell accumulation in injured skeletal muscle, and go on to explore the population dynamics underlying this reduction. We uncover the importance of the interleukin (IL)-33:ST2 axis in muscle Treg cell accumulation and function, exploit this axis to enhance muscle repair in old mice, and uncover an unexpected physical association between IL-33-producing stromal cells and nerve cells in muscle.
RESULTS
Treg cell accumulation is diminished in acutely injured skeletal muscle of aged mice
Treg cells represent about 10% of the CD4+ T cell compartment in uninjured skeletal muscle of C57BL/6 (B6) mice, a frequency that does not change with age (Fig. 1A, B). In young mice (~2 months of age), acute muscle injury, generated either by injection of cardiotoxin (CTX) or via milder cryoinjury, results in the accumulation of a distinct population of Treg cells within days (Burzyn et al., 2013) (Fig. 1A, B). However, such an increase was not observed in old mice (~24 months of age), a difference that was apparent already at 6 months (Fig. 1A, B). In contrast, irrespective of muscle injury, the two older groups showed an elevated frequency of splenic Treg cells, as previously reported (Nikolich-Zugich, 2014). The reduced accumulation of Tregs in muscle of aged mice was observed throughout the time-course of recovery from CTX-induced injury (Fig. 1C).
Figure 1. Diminished Treg cell accumulation in skeletal muscle of aged mice.

Different-aged B6 mice were im-injected with CTX into the hindlimb muscles. A. Cytofluorometric dot-plots of lymphocytes taken 6 days after injury. Representative of n=3–6 mice. Numbers depict the fraction of CD4+ T cells within the designated gate. B. Summary data for the experiments depicted in panel A. C. Summary data on Treg cell fraction (top) and number (bottom) various days after injury. n=4–9. D. Summary data on muscle Treg cell diagnostic marker expression over time. n=4 mice. E. RNAseq analysis. Normalized expression values for muscle (left) and splenic (right) Treg cells isolated 4 days after CTX injury. Muscle Treg cell “up” (red) and “down” (blue) signature transcripts (Burzyn et al., 2013) are overlain in the left panel, with some key muscle Treg cell “up” genes highlighted. Some differentially expressed genes encoding trafficking or related molecules are highlighted on the spleen plot in the right panel. Averaged from two experiments. For all relevant panels: mean ± SD. *, p≤.05; **, p≤.01; ***, p≤.001; ****, p .0001 from the unpaired t-test corrected for multiple experiments. Post-test comparisons of ranked p-values (generated from Fisher's Least Significant Difference test) using the Holm-Sidlac method. Significance level set at 5%. All other p-values were not significant. (See also Fig. S1.)
The Treg cells that were found in the injured muscle of older mice were bona fide “muscle Treg cells” as they displayed typical amounts of diagnostic cell-surface markers, such as ST2 (the IL-33 receptor) and amphiregulin (Areg) (Burzyn et al., 2013) (Fig. 1D). They also expressed the characteristic muscle Treg cell “up” and “down” signatures (Burzyn et al., 2013), according to RNAseq analysis of cells harvested four days after injury (Fig. 1E).
Given their reported roles in skeletal muscle regeneration (Arnold et al., 2007), and their sensitivity to Treg cell numbers and activities (Burzyn et al., 2013), we also compared the myeloid-lineage populations that arose after CTX injury of young and aged mice. There was a significant decrease in representation of the major histocompatibility complex class II (MHCII)-negative compartment of monocytes plus macrophages in aged mice (Fig. S1A, B), a change parallel to that provoked by punctual ablation of Treg cells in young mice (MP, CB and DM, unpublished results).
Reduced Treg cell accumulation in injured muscle of aged mice reflects defects in their recruitment, proliferation and retention
Next we sought to identify the feature(s) of muscle Treg population dynamics that were compromised in older mice. As a prelude, we determined whether muscle Treg cell accumulation in young mice was dependent on recruitment from the pool of circulating T cells. Two-month-old mice were treated with the S1P1 receptor agonist, FTY720, at the same time as CTX injury, and muscle infiltrates were analyzed by flow cytometry over a seven-day time-course. Agonism of the S1P1 receptor provokes its down-regulation, thereby trapping T and B cells within lymphoid tissues and clearing them from the circulation (Kunkel et al., 2013). Although FTY720 treatment had no significant effect on the overall size of the cellular infiltrate in injured muscle, it profoundly reduced the accumulation of Treg cells (Fig. 2A). Thus, the accrual of muscle Treg cells in response to injury seemed to depend on recruitment from the circulating T cell pool.
Figure 2. Defects in Treg cell recruitment, proliferation, and retention in muscle of aged mice.

A. Muscle Treg cell dependence on the circulating pool. Two-month-old mice were treated with FTY720 or PBS a day prior to CTX-induced injury and daily thereafter, and muscle lymphocytes were analyzed cytofluorometrically various days later. n=3–8 mice. B–E. Treg cell migration from the CLNs to the muscle. B. Schematic diagram of the protocol. Two-month-- or >6-month-old Kaede/B6 Tg mice were injected with CTX, and 24 hours later, the CLNs (cervical LNs) were exposed to violet light non-invasively. Lymphocytes from the indicated tissues were examined cytofluorometrically for Kaede-red+ photoconverted (PhC) cells, either immediately or 24 hours later (ALNs= axial LNs, ILNs= inguinal LNs). C) Dot-plot representative of n=7–9 mice from three experiments. D) Exodus from the PhC CLN pool. Normalized to the day 0 PhC population. E) Immigration to various tissues. The “migration ratio” is the fraction of Kaede-red+ cells in a designated organ normalized to the fraction in the non-draining LN, which provides a measure of the systemic circulation. Raw fractional data appear in Fig. S2A. F) Muscle Treg cell proliferation. EdU was co-injected at the time of CTX injury, and LNs from the indicated tissues were examined cytofluorometrically a day later. n=7 mice from two experiments. Representative dot-plots can be found in Fig. S2B. G–I. Treg cell migration out of the muscle. G) Schematic diagram of the protocol. As per panels B–D, except that the tibialis anterior muscle was exposed to violet light two days after CTX injection, and tissues were examined 1–5 days later. H) Emigration of the initial PhC pool from the muscle. n=2–9 mice from three experiments. Normalized to the day 0 PhC population. I) Immigration of the initial PhC pool to draining and non-draining LNs. Normalized to the day 0 PhC value. Values ≥100% likely reflect proliferation. Statistics for this figure as per Fig. 1. (See also Fig. S2.)
These results raised the possibility that the reduced accumulation of Treg cells in injured muscle of older mice reflected a defect in their recruitment to the muscle, their proliferation, and/or their retention therein. As FTY720 can affect processes other than egress from lymphoid tissues, we turned to the Kaede transgenic (Tg) mouse system (Tomura et al., 2008) both to confirm the conclusions from the FTY720 experiments and to evaluate the three possible mechanisms. Kaede/B6 mice ubiquitously express a photoconvertible fluorescent reporter (Kaede) under the control of Actb transcriptional control elements. Upon exposure to violet light, reporter fluorescence irreversibly converts from green to red, innocuously and stably for at least 2 weeks. One day after CTX-induced muscle injury, we non-invasively photoconverted cells in the cervical lymph nodes (CLNs) of 2-month-old or >6-month-old mice by exposure to violet light; Kaede-red+ cells were then tracked from the CLNs (representing the general circulation) to the axillary LNs (ALNs, general circulation), the inguinal LNs (ILNs, muscle-draining) and the muscle (Fig. 2B). Twenty-four hours after photoconversion, about half of the Kaede-red+ Treg cells had emigrated from the CLNs in young mice, while significantly fewer (only a quarter) had done so in aged individuals (Fig. 2C, D). A similar age-dependent difference in emigration from the CLNs was observed for Kaede-red+ conventional CD4+ T (Tconv) cells (Fig. 2D). Accordingly, a lower frequency of photoconverted cells was found in the CD4+ T cell compartments of injured muscles, the draining ILNs and the non-draining ALNs of aged mice (Fig. S2A). When the muscle and ILN fractions were normalized to the ALN values in order to correct for general circulation patterns, it became clear that the major migration-related difference between young and aged mice concerned migration of Treg cells to the injured muscle (Fig. 2E): vigorous in young mice, actually double that of the general circulation (ie the migation ratio was ~2), but barely detectable in their aged counterparts. This difference was not found for Tconv cells.
To uncover any age-related effects on Treg cell proliferation, we injected mice with 5-ethynyl-2’-deoxyuridine (EdU) at the time of CTX-induced injury, and quantified its incorporation by CD4+ T cell subsets at relevant sites. Proliferation of Treg cells from injured muscle, but not the spleen, of aged mice was clearly reduced vis-à-vis young individuals (Figs. S2B and 2F). No such difference was seen for Tconv cells.
For evaluation of the age dependence of Treg cell retention in injured muscle, we again turned to the Kaede Tg system, but this time photoconverted the injured tibialis anterior (TA) muscle (Fig. 2G). The decay curve of the photoconverted Treg population in injured muscle revealed an increased turnover in aged relative to young mice (Fig. 2H). Enhanced turnover of muscle Treg cells in aged mice was due, at least in part, to increased migration from the injured muscle to the ILNs and ALNs (Fig. 2I). (Note that the high values in ILNs at later times, a few even ≥100%, likely reflect proliferation.)
The IL-33:ST2 axis impacts muscle Treg cell accumulation and regenerative activities
An obvious question was what factor(s) might promote the accumulation of Treg cells in injured skeletal muscle of young mice. Our attention was rapidly drawn to IL-33 because Il1rl1, which encodes this cytokine’s receptor, ST2, was one of the loci most strongly up-regulated in muscle versus lymphoid-tissue Treg cells (Fig. 3A), and because recent work has linked IL-33 to the control of Treg cell homeostasis in parenchymal tissues (Schiering et al., 2014; Vasanthakumar et al., 2015; Kolodin et al., 2015). ST2 protein was also up-regulated at the surface of muscle Treg cells, measured as either the fraction of ST2+ cells or the ST2 MFI (Fig. 3B). An elevated fraction of ST2+ Treg cells was evident in muscle as early as 12 hours post-injury, peaked on day 2, then dipped from day 4 onward, but to a value (~30%) still substantially higher than that of lymphoid-tissue Treg cells (<5%) (Fig. 3C). Such frequent expression of ST2 was not a general feature of cells infiltrating injured skeletal muscle as it was not observed for either neutrophils, monocytes ormacrophages (Fig. 3C).
Figure 3. Involvement of the IL-33:ST2 axis in muscle Treg cell accumulation and regenerative activities.

A. Microarray analysis. Normalized expression values for Treg cells from 2-month-old mice isolated 14 days after CTX injury. Data from (Burzyn et al., 2013). B. Cytofluorometric analysis. Hindlimb muscles from 2-month-old mice were prepared a day after CTX injury. Left, dot plots representative of n=4 mice from two experiments. Numbers depict fraction of CD4+ T cells. Right, summary data for fraction of ST2+ Treg cells (top) and Treg cell ST2 mean fluorescence intensity (MFI) (bottom). C. Summary data for ST2 fraction within various leukocyte populations at various times after CTX injury of 2-month-old mice. n=3–8 mice from two experiments. D. Impact of Treg-cell-expressed ST2 on Treg cell accumulation. Two-month-old mice with a Treg-specific ablation of ST2 expression (Il1rl1mut) or their homozygous wild-type littermates (Il1rl1WT) were injected with CTX, and Treg cells were examined cytofluorometrically various times later. Top, fractional representation; bottom, numbers. Summary data for n=4–7 mice from two experiments. E–G. Impact of Treg-cell-expressed ST2 on muscle repair 4 days after cryoinjury. E) Expression of diagnostic transcript signatures. Microarray analysis was performed on RNA isolated from whole muscle of 2-month-old mice taken 8 days after cryoinjury. Overlain are signatures developed and validated in (Burzyn et al., 2013); transcript identities are listed in Table S1 for convenience. F) Histologic appearance. Representative H&E stains of tibialis anterior muscle from 2-month-old mice taken 8 days after cryoinjury (representative of two experiments). Arrows highlight necrotic areas, while asterisks indicate cellular infiltration. Original magnification=100x. Scale bar=100μm. G) Quantification of regenerating fibers. For the mice illustrated in panel F, the cross-sectional area of regenerating myofibers is represented as a frequency distribution of myofiber size (left) or as the mean area (right). n=5–6 mice from two experiments. p-values in this figure as per Fig. 1, except that those of panel E come from the Chi-square test and from the left graph of panel G from the t-test of weighted sum. (See also Table S1.)
To test the possible involvement of the IL-33:ST2 axis in muscle Treg cell accumulation and function, we generated mice lacking ST2 specifically on Tregs (Treg-Il1rl1mut), always comparing their performance with that of wild-type (WT) littermates (Il1rl1WT). Cytofluorimetrically, the representation of muscle Treg cells in 2-month-old mutant and WT mice was similar one day after CTX-induced injury; however, ST2-denuded Treg cells showed impaired accumulation over time (Fig. 3D). In contrast, there was no significant difference in the splenic Treg populations of mutant and WT mice (Fig. 3D). Flow cytometry confirmed that Treg cells in the mutant mice were all devoid of ST2 (data not shown).
Several assays were employed to assess the importance of Treg-cell expression of ST2 for muscle regeneration. In order to facilitate cross-mouse quantification and comparison, we cryoinjured TA muscles, a method that provokes milder, more uniform injury and permits better visualization than CTX-induced injury does. There was also a significant reduction in the accumulation of Treg cells in muscle of Treg-Il1rl1mut mice four days after cryoinjury, in particular those with a bona fide muscle Treg cell phenotype signaled by Klrg1 expression (Burzyn et al., 2013) (data not show). Regeneration was initially evaluated via whole-tissue transcriptomics, making use of signatures developed and validated in our previously published kinetic analysis of skeletal muscle regeneration (Burzyn et al., 2013) (Table S1). Expression of a set of “muscle homeostasis/function” genes is routinely high at steady-state, decreases for several days after acute injury (d4), and returns to steady-state values once regeneration has been completed (d8). Examples include genes whose products are implicated in metabolism (Pfkfb1, Adh1, Fbp2, and Vldlr) or muscle differentiation and function (Mstn and Mb). This signature was strongly under-represented in mutant, vis-à-vis WT, muscle Tregs eight days post-injury (Fig. 3E, left panel). In contrast, expression of a set of “muscle repair/regeneration” genes is routinely very low at steady-state, increases over the first days after injury (4d), and eventually, and obligatorily, returns to the low baseline values (8d). The products of these genes promote efficient tissue repair, e.g. Myog (which encodes a muscle transcription factor), Mmp2 and Adam8 (encoding proteins involved in construction of the extracellular matrix). This signature was substantially over-represented in the muscle Treg cells of mutant mice eight days after injury (Fig. 3E, right panel). These transcriptional aberrations were accompanied by histological abnormalities, e.g. less effective clearing of the muscle infiltrate in the absence of ST2 (Fig. 3F). Furthermore, the distribution and mean cross-sectional area of regenerating (centrally nucleated) myofibers was significantly decreased in mice lacking ST2 specifically on Treg cells (Fig. 3G), indicating delayed or impaired recovery from injury. Thus, the IL-33:ST2 axis plays a clear role in the accumulation and pro-regenerative activities of the Treg cells associated with acutely injured muscle of young mice.
Muscle IL-33 expression spikes shortly after acute injury, reflecting synthesis by nerve-associated cells resembling fibro/adipogenic progenitors
IL-33 is a member of the IL-1 family of cytokines (Cayrol and Girard, 2014). It resides constitutively in the nucleus, primarily of non-hematopoietic cells -- including epithelial cells, endothelial cells and fibroblasts. In response to stimuli such as infectious agents, allergens, or mechanical perturbation, IL-33 is released from the cell by a mechanism that remains obscure, but entails, at least in part, passive release from necrotic or stressed cells. Demonstration of a role for IL-33 in injury-induced expansion of the muscle Treg population and in optimal muscle regeneration after injury raised the issue of this cytokine’s synthesis in skeletal muscle. How does IL-33 expression change in response to acute injury? What cells produce it? How does IL-33 expression evolve with aging?
Both Il33 transcript quantification by PCR titering (Fig. 4A) and IL-33 protein estimation by immunoblotting (Fig. 4B) revealed a spike of expression 6–12 hours after acute muscle injury. As a first step towards pinpointing the cells producing IL-33, we sorted the CD45+ and CD45− fractions of the myofiber-associated (MFA) and interstitial muscle compartments 12 hours post-injury, and quantified transcripts via PCR analysis. For both compartments, the major IL-33 expressers were CD45− cells (Fig. 4C). This finding was confirmed by both immunohistology (Fig. S3B) and flow cytometry (see below), which also failed to evidence many IL-33+ endothelial (CD31+) cells (Fig. S3C and see below).
Figure 4. Quantification of IL-33 expression and identification of IL-33 expressers as cells resembling FAPs.

A and B. An early spike of IL-33 expression. Two-month-old mice were injected with CTX, and various times later, Il33 transcripts in tibialis anterior muscle were quantified by PCR (A) or IL-33 protein was estimated by immunoblotting (B). Plotted in panel A is the fold-change in expression value relative to that of uninjured muscle. For PCR, n=2 mice. For immunoblotting, n=1 (24 and 96 hrs) to 3 (uninjured, 6 and 12 hrs) mice. C. Localization of IL-33 expression within muscle. Il33 transcripts in the myofiber associated (MFA) and interstitial muscle compartments were quantified by PCR 12 hrs after CTX injury of 2mth-old mice. Data are represented as fold-change relative to the corresponding population from uninjured muscle. n=3–4 mice from two experiments. D. Gating strategy to localize IL-33 expression by flow cytometry. Single-cell suspensions were prepared from uninjured hindlimb muscles of Il33−/ − mice and WT controls, and were analyzed by flow cytometry for the indicated markers. Top row of plots: gating strategy to delineate hematopoetic cells (CD45+), endothelial cells (CD31+) and FAPs (CD45−CD31−PDGFRa+PDPN+). Lower set of plots: typical staining for IL-33, including isotype and IL-33-deficient negative controls. Numbers indicate the fraction of cells in the gated population. E. Summary data on uninjured (top) and 12 hours post-CTX injured (botton) muscle. n=6 mice from two experiments. Statistical analysis of this figure’s data as per Fig. 1. (See also Fig. S3.)
Given their fibroblastic nature and documented role in skeletal muscle regeneration (Joe et al., 2010; Uezumi et al., 2010; Murphy et al., 2011), fibro/adipogenic progenitor (FAP) cells emerged as a promising candidate. These cells are characterized by surface display of Sca1 and the alpha chain of the receptor for platelet-derived growth factor (PDGFRα) in the absence of CD45, CD31 and other hematopoietic lineage markers (lin−). Indeed, cytofluorometric studies revealed that the major IL-33+ cell population in both uninjured and injured muscle of young mice displayed this constellation of markers, in addition to expressing podoplanin (Gp38, PDPN) (Fig. 4D, E). Injury increased the representation of IL-33+ FAPs (Fig. 4E).
Immunohistological analyses confirmed the overlap between IL-33 synthesis and PDGFRα display, as well as providing information on this cytokine’s cellular and intracellular geography in muscle. Low-magnification scanning revealed IL-33-expressing cells to be most abundant in regions immediately surrounding muscle fibers (Fig. S3A). Many of them (~20%), were intimately associated with nerve structures. IL-33 was readily detected within PDGFRα+ cells of the perineurium (Glut1+) encasing the myelin sheath (S100+) of nerve fibers (Fig. 5A), within nerve bundles (Fig. 5B), and within cells parenthesizing muscle spindles (Fig. 5C). Muscle spindles are collections of nerves and specialized muscle fibers (intra- and extra-fusal) surrounded by a fibrous capsule, and are critical in stretch-sensitive mechanoreception, and thereby proprioception (Maier, 1997). Only in cells associated with muscle spindles could we detect IL-33 in the cytoplasm (Fig. 5C). Within 12 hrs of CTX-induced injury, there was a global increase in IL-33+ cells, not obviously confined to a particular region or cell-type – both “by eye” and according to the fraction of DAPI+ structures (nuclei) co-expressing IL-33 (Fig. 5D).
Figure 5. Immunohistologic localization of IL-33-expressing cells in mice and humans.

A–C. Co-localization of IL-33+ cells within nerve structures: in PDGFRα+ cells of the perineurium (Glut1+) encasing myelin sheaths (S100+) of nerve fibers (A); in nerve bundles (B) or in muscle spindles (C). Immunofluorescence microscopy of muscle sections 6 hours post-CTX-injury. Left panels in B and C are brightfield views. Original magnifications are: A (right panel), B and C=200x; A (left panel)=100x; A (center panel)=600x. Scale bar for panel A=100μm (left), 10μm (middle), 50μm (right); for panel B=10μm; for panel C=10μm. D. Increase in IL-33+ cells upon muscle injury. The fraction of IL-33+ nuclei (DAPI+ structures) was measured automatically as described in the Experimental Procedures. p≤.0001 by an unpaired t-test. Each dot represents a single field of view. Data from 4–10 fields from 2–3 individual mice. E. IL-33-expressing cells in human muscle. Uninjured gluteus maximus from healthy individuals (representative of three examined). Left, IL-33+ cells surrounding nerve fibers; right, vascular IL-33+ cells. Original magnification=200x. For all panels, arrows point to IL-33+ cells. Scale bar=50μm.
We were also able to detect IL-33-expressing cells in biopsies of uninjured gluteus maximus from healthy humans. Again, many of them could be found in association with nerve structures, notably nerve fibers meandering through the muscle (Fig. 5e, left panel). In contrast to mice, humans also expressed IL-33 in cells associated with vascular structures (Fig. 5E, right panel).
Lastly, we compared IL-33 expression in injured muscle of young and aged mice, employing a variety of assays. Il33 transcript values six hours after CTX-induced injury were significantly higher in young individuals (Fig. 6A). This trend held, although less strikingly, at 12 hours. We also observed fewer IL-33+ FAPs when quantified cytofluorometrically (Fig. 6B). Inexplicably, we did not see a parallel difference in IL-33 protein expression by immunoblotting (data not shown).
Figure 6. Reduced IL-33 expression in skeletal muscle of aged mice.
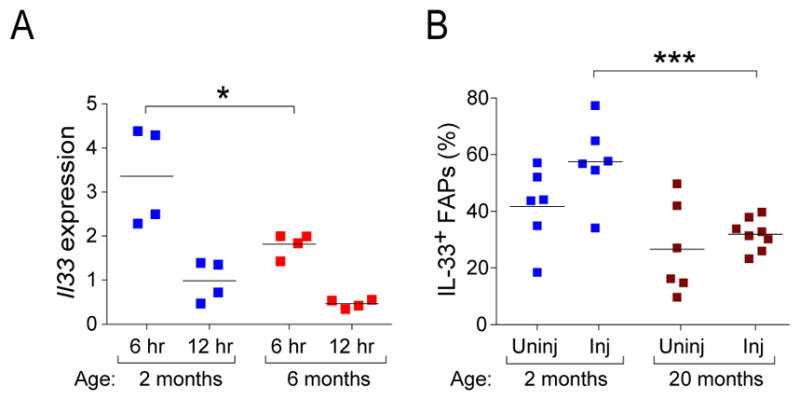
Mice of the designated ages were injected with CTX, and expression of IL-33 in tibialis anterior muscle was examined 6–12 hours later. A. PCR titration of Il33 transcripts(fold change vs. uninjured). Induction vis-à-vis uninjured muscle is plotted. n=4 mice from two experiments. B. Cytofluorometric analysis of FAPs 12 hours post-injury. Gating was performed as in Fig. 4D. Summary data from 6–7 mice from two experiments. The 2-month values correspond to those of Fig. 4E. Statistics for this figure as per Fig. 1.
Exogenous addition of IL-33 restores the Treg population in injured muscle of aged mice, enhancing regeneration
Injection of IL-33 can augment the fraction and number of Treg cells in parenchymal tissues within just a few days (Schiering et al., 2014; Vasanthakumar et al., 2015; Kolodin et al., 2015), and values can remain elevated for at least a month afterwards (Kolodin et al., 2015). To determine whether IL-33 could boost the Treg population in injured muscle, we injected different-aged mice with recombinant IL-33 or just vehicle [phosphate-buffered saline (PBS)] on the day of injury, and analyzed them by flow cytometry six days later. IL-33 did indeed expand the muscle Treg population -- in IL-33-treated 6-month-old mice, the numbers attained were even greater than those typical of IL-33-untreated 2-month-old individuals (Fig. 7A, left panels). In contrast, there was no significant increase in the size of the splenic Treg populations under these conditions (Fig. 7A, right panels). Neither was there an augmentation of the muscle or spleen Tconv cell compartments (Fig. S4A).
Figure 7. Restoration of the Treg population in injured muscle of old mice through IL-33 supplementation, promoting regeneration.

A. Expansion of Treg populations in IL-33-treated mice. Two-month- versus six-month-old mice were im-injected with 0.3 μg/muscle rIL-33 in PBS or just PBS in addition to CTX, and the indicated tissues were examined cytofluorometrically 6 days later. Summary data for 8 mice from two experiments. B–H. Improvement in muscle regeneration by IL-33 treatment. Twenty-two-month-old mice were ip-injected with rIL-33 (2 ug) or PBS the day prior to and the day following cryoinjury, and were examined 4 days later. Two-month-old regeneration controls (Burzyn et al., 2013) were not IL-33 treated. B) Muscle Treg population expansion. Summary data for n=5 mice from two experiments. C) Augmentation of muscle satellite cells in IL-33-treated injured mice. Representative dot-plots (left) and summary data (right). Numbers refer to the fraction of Lin−Sca1− cells. n=9–11 mice from three experiments. D) Improved clonal efficiency in IL-33-treated injured mice. Muscle satellite cells were sequentially double-sorted according to the panel C gates, plating individual cells into single wells. Clones were scored after 7 days of culture. Each dot represents a single mouse. Data from three experiments. E and F. Microarray assessment of muscle regeneration. Whole-muscle RNA was isolated from 22-month-old mice 8 days after cryoinjury, and the differential expression of diagnostic transcript signatures in the presence and absence of IL-33 treatment were depicted on volcano plots. E) The validated regeneration signatures described in the legend to Fig. 3E. F) The sets of genes previously determined (Burzyn et al., 2013) to be induced (red) or repressed (blue) upon recombinant Areg injection, which was documented to improve muscle regeneration. Values at the top refer to the numbers of genes over- (right) or under- (left) represented after IL-33 (vs PBS) injection. G. Histologic presentation. Representative H&E-stained sections of tibialis anterior muscle. Representative of two experiments. Asterisks designate immunocyte infiltration. Original magnification=100x. H. Number (left) and cross-sectional area represented either as the frequency distribution (middle) or mean area (right) of regenerating myofibers per mouse from day 8 cryoinjured TA muscle. Summary data for 6–7 mice from two experiments. Two-month-old regeneration controls, the same as Fig 3G, were not IL-33 treated. Statistics as per Fig. 1, except p-values for panels E and F come from the Chi-square test and for the middle plot of panel H from the t-test of weighted sum. (See also Figs S4 and S5.)
As a first step in addressing the mechanisms involved, we determined whether IL-33 boosted the recruitment of Treg cells from the circulation via the Kaede Tg mouse experiment depicted in Fig. S4B. Young mice were treated with IL-33 or vehicle alone at the time of injury; a day later, the CLNs were photoconverted; and again a day later, total, ST2+ and Kaede-red+ Treg cells were quantified from the muscle and control ALNs. While IL-33 increased the representation of Treg cells in the CD4+ T cell compartment (Fig. S4C, left) and the fraction of Treg cells expressing ST2 (Fig. S4C, right), as anticipated, it did not enhance the recruitment of circulating Treg cells to the muscle (Fig. S4D, E). IL-33 did, however, have a strong impact on Treg cell proliferation, as evidenced by the experiment schematized in Fig. S5A. Two and a half days after CTX-induced muscle injury, old mice were injected with EdU; and 12 hrs later, total, ST2+, EdU+ and Ki67+ T cells from muscle and spleen were cytofluourometrically quantified. As expected, IL-33 increased Treg cell representation, in particular cells displaying ST2 (Fig. S5B). According to both EdU incorporation and Ki67 staining, IL-33 induced Treg cell proliferation in both the muscle and spleen (Fig. S5C, D). In contrast, Tconv cells did not proliferate or accumulate in either the muscle or spleen (Figs. S5E-G). Similar results (i.e. increased EdU incorporation) came from analogous experiments on young mice (not shown). The Treg cells within muscle that were expanded by IL-33 treatment were typical “muscle Treg cells” according to microarray analysis four days after CTX-induced injury (plus IL-33 treatment) of young mice (Fig S5H). In confirmation of the EdU-incorporation and Klrg1-staining experiments, IL-33 induced several pathways related to cell replication, cycling, or proliferation: “cell cycle mitotic” (p<8X10⁻⁸), “G2M checkpoint” (p<8X10⁻⁸), “cell cycle” (p<2.5X10⁻⁷), “mitotic spindle” (p<1X10⁻⁵), according to Gene-Set Enrichment Analysis.
To assess the impact of IL-33 supplementation on muscle regeneration in old mice, we again used the milder, more homogeneous cryoinjury model. Injection of IL-33 into 22-month-old mice at the time of cryoinjury also expanded muscle Treg cells (Fig. 7B). Results from multiple assays indicated a statistically significant impact on muscle regeneration. First, the representation of satellite cells [defined as Beta1+CXCR4+Lin−Sca1− ( Cerletti et al., 2008)] increased in response to IL-33 supplementation (Fig. 7C), and they were more effective at forming myogenic colonies in vitro (Fig. 7D). Second, whole-muscle transcriptomics showed a strong enrichment for the “muscle homeostasis/function” signature in IL-33-, but not PBS-, treated old mice, and less apparent skewing of the “muscle repair/regeneration” signature (Fig. 7E). In addition, IL-33-treated old mice showed a striking enrichment and impoverishment of the signatures that were previously determined (Burzyn et al., 2013) to be up- or down-regulated, respectively, in mice injected with Areg (Fig. 7F). This muscle Treg cell product is a member of the epidermal growth factor family and enhances regeneration through a direct impact on muscle progenitor cells (Burzyn et al., 2013). Third, histologic analysis illustrated superior muscle regeneration in old mice supplemented with IL-33 (Fig. 7G). There was an elevated number of regenerating, centrally nucleated, myofibers; an evident skewing in their size distribution to higher values; and a higher average myofibril cross-sectional area (Fig. 7H).
DISCUSSION
Acute injury of skeletal muscle in young mice provokes the local accumulation of a special population of Foxp3+CD4+ Treg cells within days (Burzyn et al., 2013). These cells have a transcriptome and TCR repertoire distinct from those of other Treg populations, adapted for optimally surviving and operating in the muscle, and thereby promoting effective repair. We now report that the accumulation of Treg cells in injured skeletal muscle profoundly declines with age, paralleling a degradation of repair and regeneration processes. Our results raise several points that merit further discussion.
First, the reduced accumulation of Treg cells in muscle of old mice reflected defects in multiple aspects of their population dynamics: recruitment, proliferation, and retention. That the muscle Treg population was so dependent on speedy recruitment from the circulation makes an interesting contrast with the behavior of its counterpart VAT Treg population, which is seeded in the first few weeks of life and is self-contained thereafter, with little detectable migration into or out of it (Kolodin et al., 2015). RNAseq analysis revealed that circulating (i.e. splenic) Treg cells of young and aged mice differentially expressed genes encoding several chemokine receptors, e.g. CXCR6 and CCR7 (lower in aged mice) and CCR5 and CCR3 (higher in aged mice). Several of these differences have been noted previously (Mo et al., 2003). In addition, the gene encoding the S1P1 receptor was down-regulated in splenocytes of old mice. One or more of these differences could underlie the reduced egress of Treg cells from the LNs of aged mice and/or their diminished recruitment to injured muscle. The lower S1P1 expression is a good candidate for the former as signaling through this receptor is known to control egress of most lymphocyte populations from lymphoid organs (Schwab and Cyster, 2007), and S1P1 receptor antagonism at the time of injury blocked Treg recruitment to the muscle. Less CCR7 could also promote retention of Treg cells in LNs, as has been reported in another system (Ishimaru et al., 2010). The down-regulation of Itgae expression in Treg cells in muscle of aged mice could at least partially explain their reduced retention therein as the adhesion molecule it encodes, CD103, has been shown to drive tissue retention of Treg cells (Suffia et al., 2005).
Second, we found IL-33 to be an important regulator of muscle Treg cell homeostasis. While initial studies had emphasized the role of this cytokine in driving T helper (Th)-2 cell responses, primarily through an impact on type-2 innate lymphoid cells (ILCs) and anti-inflammatory macrophages (Garlanda et al., 2013; Molofsky et al., 2013), more recent work highlighted its ability to expand Treg populations (Turnquist et al., 2011, 2014; Schiering et al., 2014). Results from our loss- and gain-of-function experiments indicated a substantially more potent effect of IL-33 on muscle Treg than on lymphoid-tissue Treg cells, parallel to what we previously documented for VAT Treg cells (Kolodin et al., 2015). This difference in potency is also reflected in expression of the IL-33 receptor, ST2: Treg cells in muscle and adipose tissue display substantially more than do their lymphoid-tissue counterparts. Thus, IL-33 may be most relevant for homeostasis of parenchymal-tissue-Treg populations, likely a manifestation of this cytokine’s alarmin function, evident in the rapid spike of IL-33 expression in skeletal muscle in response to injury. The IL-33 effect in muscle seemed to be primarily a local one because the representation of Treg cells in Treg-Il1rl1mutmice was normal the day after injury – they just failed to accumulate thereafter; and because IL-33 supplementation did not enhance recruitment of circulating Treg cells to the muscle.
Third, the identity of the major IL-33-producing cell-type in skeletal muscle was not anticipated. The phenotype of these cells is reminiscent of that of LN fibroblastic reticular cells (FRCs) – CD45−CD31−PDGFRα +PDPN(Gp38)+ – which have indeed been reported to express abundant Il33 transcripts (Malhotra et al., 2012). Muscle IL-33 expressers also displayed a constellation of cell-surface markers typical of FAPs: CD45−CD31−Sca1+PDGFRα+. FAPs, which can engender both fibroblasts and adipocytes, have been attributed a substantial role in the regeneration of myofibers and in fat deposition within aged skeletal muscle (Joe et al., 2010; Uezumi et al., 2010). It was recently suggested that eosinophil-produced IL-4 and/or 13 signals serve as a switch between the two FAP fates, promoting their proliferation to support myogenesis while inhibiting their differentiation into adipocytes (Heredia et al., 2013). FAP-produced IL-33 should be able to sustain ST2+ type-2 ILCs in muscle in addition to Treg cells, which would have the potential to feed back positively on eosinophils and anti-inflammatory macrophages via ILC-produced IL-5 and IL-13, as has been reported in VAT (Molofsky et al., 2013). Thus, there is likely to be a complex interplay between innate and adaptive immunocytes, supporting stromal cells, and myocytes in regenerating muscle, as was recently argued for adipose tissue (Molofsky et al., 2015). Nonetheless, the diminished Treg cell accumulation in injured muscle of Treg-Il1rl1mut mice argues for a direct link between FAPs and Treg cells via IL-33, as does the fact that IL-33 can induce proliferation of and transcriptional changes within isolated Treg cells in culture (Vasanthakumar et al., 2015; Schiering et al., 2014).
Lastly. the association between a fraction of the IL-33-producing cells and neural structures within skeletal muscle was quite striking. Muscle spindles, which were parenthesized by IL-33-producing cells, are stretch-sensitive mechanoreceptors, and thereby proprioreceptors, that lie parallel to myofibers, and transmit signals back and forth to the spinal cord (Maier, 1997). They host both sensory and motor neurons. Most recently, muscle-spindle feedback was shown to play an essential role in facilitating neural circuit reorganization and directing locomotor recovery after spinal-cord injury (Takeoka et al., 2014). Our finding, together with reports that the IL-33:ST2 axis has a mechanically activated cardioprotective role reflective of heart fibroblast:myocyte crosstalk (Sanada et al., 2007), raises the possibility that IL-33 might operate generally as a mechano-sensitive signal. Indeed, application of mechanical stress to fibroblasts in vitro or in vivo induced IL-33 secretion in the absence of cell necrosis (Kakkar et al., 2012). It may also be worth noting that as many as 1/3 of dispersed brain cells, especially oligodendrocytes and gray-matter astrocytes, were reported to express IL-33, which is released from injured central nervous system (CNS) tissue and promotes recovery after CNS injury (Gadani et al., 2015). Thus, IL-33 is well placed to relay homeostatic signals between the nervous and immune systems in the muscle context.
Age-related sarcopenia and associated defects in muscle repair subsequent to injury or atrophy represent a major health problem with our aging population structure, exerting a strong impact on mobility, independence and quality of life. The IL-33:ST2 axis seems to be a promising avenue to explore in attempts to address this important problem.
EXPERIMENTAL PROCEDURES
Mice
Most B6 mice were purchased from the Jackson Laboratory. Foxp3-IRES-GFP (Bettelli et al., 2006), Kaede/B6 (Tomura et al., 2008), Foxp3-creYFP (Rubtsov et al., 2008), and Il1rl1-flox (Chen et al., 2015) mice were obtained from V. Kuchroo, O. Kanagawa, A. Rudensky, and R. Lee, respectively. Mice lacking ST2 specifically on Tregs (Treg-Il1rl1mut) were generated by crossing the ST2-flox and Foxp3-creYFP lines. B6 mice ≥20 months of age (and control 2-month-old mice) were obtained from the National Institute of Aging colony at Charles River Laboratories. All mice were housed in our specific-pathogen-free facilities at Harvard Medical School. Experiments were conducted under protocols approved by Harvard Medical School’s Institutional Animal Care and Use Committee. Male mice of the specified ages were used.
Muscle injury
Routinely, mice were anesthetized with avertin (0.4mg/g body weight), and injected with 0.03 ml/muscle of Naja mossambica cardiotoxin (0.03 mg/ml, Calbiochem or Sigma) in one or more hindlimb muscles. For regeneration studies, TA muscles were exposed to a liquid-nitrogen-chilled metal probe for 8 seconds.
Isolation and characterization of muscle leukocytes, myofiber-associated cells and fibro/adipocyte progenitors
Detailed procedures appear in the supplementary materials.
Transcript analyses
RNAseq on ultra-low cell numbers (1–5x10³) and PCR analyses were performed, and the resulting data analyzed as detailed in the supplementary materials.
For microarray analysis of whole muscle, the tissue was flash-frozen in liquid nitrogen and homogenized in TRIzol (Invitrogen) before RNA extraction (Painter et al., 2011). Microarray analysis of T cell populations was always done on double-sorted cells. All samples were generated in duplicate or (usually) triplicate. Sample processing and data analysis were performed as previously described (Cipolletta et al., 2012). The “muscle homeostasis/function” and “muscle repair/regeneration” signatures were developed and validated in (Burzyn et al., 2013), as were the Areg “up” and “down” signatures.
Microarray/RNAseq data are available from the National Center for Biotechnology Information/Gene Expression Omnibus repository under accession numbers GSE76722, GSE76733, GSE76695 and GSE76697.
Assessment of population dynamics
To block exit of lymphocytes from peripheral lymphoid organs, mice were treated with an S1P1 receptor agonist. 25 mg/kg FTY720 (Cayman Chemical) was ip-injected prior to injury and daily thereafter. The Kaede Tg mouse system was used to monitor cell migration from the CLNs to hindlimb muscles, draining LNs (ILNs), and non-draining LNs (ALNs); or from TA muscle to the ILNs and ALNs. Details are presented in the supplementary materials. For quantification of T cell proliferation in vivo, 1 mg EdU was intraperitonally (ip) injected, and 12 or 24 hours later, cells were processed for detection by the Click-iT EdU kit following the manufacturer’s protocol (Molecular Probes).
Histological analyses
Details of the diverse histologic procedures can be found in the supplemental materials.
Clonal myogenesis assay
Satellite cells (CD45−Sca-1−CD11b−CXCR4+β1-integrin+) were first sorted in bulk and then individually into 96-well plates coated with collagen (1 mg/ml, Sigma) and laminin (10 mg/ml, Invitrogen). Cells were cultured in F10 medium with 20% horse serum and 5 ng/ml bFGF (Sigma) for 7 days, with fresh bFGF added daily. Wells containing myogenic colonies were scored by brightfield microscopy on day 7.
IL-33 treatments
Recombinant mouse IL-33 (Biolegend) was administered via intramuscular (im) (0.3 ug/muscle) or ip (2 ug) injection. Mice treated with IL-33 im, received it only at the time of injury. ip-treated mice were given IL-33 the day prior to and the day following injury.
Supplementary Material
Figure S1 (associated with Fig. 1): Response of skeletal muscle myeloid-lineage cells to CTX injury.
As per Fig. 1A, except myeloid lineage cells were examined 4 days post-injury. A. Gating strategy, resulting in populations R1 (mostly MFs, some MOs), R2 (MFs), R3 (mostly DCs), and R4 (mostly MOs), and eosinophils. B. Summary data for the above-delineated populations. n=4–8 mice from two experiments.
Figure S2 (associated with Fig. 2): Different Treg population dynamics in young and aged mice.
A. Recruitment from circulating T cell pools. Summary data for % Kaede-red+ T cells 24 hours after exposure of CLNs to violet light. These data were used to calculate the migration ratios of Fig. 2D. B. Proliferation. Representative dot plots of dividing Treg cells one day after co-administration of CTX and EdU. Numbers depict fraction of CD4+ T cells within the designated gate. Representative of two experiments. Summary data appear in Fig. 2F.
Figure S3 (associated with Fig. 4): Histologic examination of IL-33-expressing cells in muscle.
A. Low-magnification immunofluorescence microscopy of muscle sections 6 hours post-CTX-induced injury. Original magnification=100x. Scale bar=50μm. B. Lack of IL-33-expressing CD45+ cells in skeletal muscle 6 hours after CTX injury. Original magnification=400x. Scale bar=10μm. C. Lack of IL-33-expressing CD31+ cells in skeletal muscle 6 hours after CTX injury. Original magnification= 400x. Scale bar=10μm. Arrows point to some IL-33+ cells. Note their lack of co-staining for CD45 (B) or CD31 (C).
Figure S4 (associated with Fig. 7): Minimal IL-33 effects on Tconv cell accumulation or Treg cell recruitment from the circulation.
A. Data from the same experiment as that depicted in Fig. 7A except that Tconv cells were examined. B-D. Analysis of Treg recruitment from the CLNs of 2–3 month-old Kaede tg mice using the protocol depicted in panel B. n=7 from two experiments. C. Cytofluorometric analysis of the fraction of Foxp3+ of CD4+ cells (left) or ST2+ of Foxp3+ cells (right). D. Flow cytometric quantification of cells photoconverted in the CLNs and found in the muscle (left) or control, non-draining, ALNs (right). E. Determination of the migration ratio as per Fig. 2E. A value of 1 reflects the general circulation.
Figure S5 (associated with Fig. 7): IL-33 effects on Treg cell proliferation and gene expression.
A. >18-month-old B6 mice were treated according to the protocol depicted in panel A. n=8 from two experiments. B-D. Proliferation of Treg cells. Cytofluorometric determination of the fraction Foxp3+ of CD4+ T cells (B, left), fraction ST2+ of Foxp3+T cells (B, right), fraction (left) and number (right) of EdU+ Foxp3+ cells (C), and fraction (left) and number (right) of Ki67+-Foxp3+CD4+ T cells (D). E-G. Same as B-D except Foxp3-CD4+ T cells were examined. H. RNAseq comparison of gene expression by Tregs isolated from 4d CTX-injured muscle of 2-month-old mice treated with IL-33 vs vehicle (PBS) alone at the time of injury. Muscle over- and under-represented transcript signatures came from (Burzyn et al., 2013).
Table S1 (associated with Fig. 3): Muscle “homeostasis/function” and “epair/regeneration” gene lists.
A and B. Muscle gene lists. Curated from microarray analysis of normalized expression values of day 4 vs day 8 ctx-injured muscle from 2 mth-old mice. Data are from (Burzyn et al., 2013).
(A) Muscle homeostasis/function. Genes up-regulated in day 8 vs day 4 injured muscle. (B) Muscle regneration/repair. Genes down-regulated in day 8 vs day 4 injured muscle.
Acknowledgments
We thank N. Asinovski, R. Cruse, K. Hattori, D. Jepson, A. Ortiz-Lopez, H. Paik, A. Rhoads, G. Buruzula and J. LaVecchio for technical support; R. Lee for the ST2-flox mice; and E. Estrella, and L. Kunkel for the human samples and for technical advice. Drs I. Chiu, A. Magnuson, J. Sanes and B. Spiegelman for helpful discussions. This work was funded by the JPB Foundation and by NIH grants R01DK092541 to DM, and R01AG033053 and U01HL100402 to AJW. AJW was an Early Career Scientist at the Howard Hughes Institute. WK was supported by fellowships from the NIH (T32-GM007753 and F30AG046045) . Cell sorting was performed under NIH P30DK036836.
Footnotes
AUTHOR CONTRIBUTIONS
Conceptualization, W.K., D.B., M.P., K.K.W, A.J.W., D.M.; Investigation, W.K., D.B., M.P., K.K.W.; Resources, Y.C.J.; Writing – Original Draft, W.K., D.M.; Writing – Review & Editing, W.K., D.B., M.P., K.K.W, Y.C.J., A.J.W., C.B., D.M.; Supervision, A.J.W., D.M.; Project Administration, A.J.W., C.B., D.M.; Funding Acquisition, A.J.W., D.M.
Publisher's Disclaimer: This is a PDF file of an unedited manuscript that has been accepted for publication. As a service to our customers we are providing this early version of the manuscript. The manuscript will undergo copyediting, typesetting, and review of the resulting proof before it is published in its final citable form. Please note that during the production process errors may be discovered which could affect the content, and all legal disclaimers that apply to the journal pertain.
References
- Arnold L, Henry A, Poron F, Baba-Amer Y, van RN, Plonquet A, Gherardi RK, Chazaud B. Inflammatory monocytes recruited after skeletal muscle injury switch into antiinflammatory macrophages to support myogenesis. J Exp Med. 2007;204:1057–1069. doi: 10.1084/jem.20070075. [DOI] [PMC free article] [PubMed] [Google Scholar]
- Bettelli E, Carrier Y, Gao W, Korn T, Strom TB, Oukka M, Weiner HL, Kuchroo VK. Reciprocal developmental pathways for the generation of pathogenic effector TH17 and regulatory T cells. Nature. 2006;441:235–238. doi: 10.1038/nature04753. [DOI] [PubMed] [Google Scholar]
- Brack AS, Conboy MJ, Roy S, Lee M, Kuo CJ, Keller C, Rando TA. Increased Wnt signaling during aging alters muscle stem cell fate and increases fibrosis. Science. 2007;317:807–810. doi: 10.1126/science.1144090. [DOI] [PubMed] [Google Scholar]
- Burzyn D, Kuswanto W, Kolodin D, Shadrach JL, Cerletti M, Jang Y, Sefik E, Tan TG, Wagers AJ, Benoist C, et al. A special population of regulatory T cells potentiates muscle repair. Cell. 2013;155:1282–1295. doi: 10.1016/j.cell.2013.10.054. [DOI] [PMC free article] [PubMed] [Google Scholar]
- Cayrol C, Girard JP. IL-33: an alarmin cytokine with crucial roles in innate immunity, inflammation and allergy. Curr Opin Immunol. 2014;31C:31–37. doi: 10.1016/j.coi.2014.09.004. [DOI] [PubMed] [Google Scholar]
- Cerletti M, Jurga S, Witczak CA, Hirshman MF, Shadrach JL, Goodyear LJ, Wagers AJ. Highly efficient, functional engraftment of skeletal muscle stem cells in dystrophic muscles. Cell. 2008;134:37–47. doi: 10.1016/j.cell.2008.05.049. [DOI] [PMC free article] [PubMed] [Google Scholar]
- Chen WY, Hong J, Gannon J, Kakkar R, Lee RT. Myocardial pressure overload induces systemic inflammation through endothelial cell IL-33. Proc Natl Acad Sci U S A. 2015;112:7249–7254. doi: 10.1073/pnas.1424236112. [DOI] [PMC free article] [PubMed] [Google Scholar]
- Cipolletta D, Feuerer M, Li A, Kamei N, Lee J, Shoelson SE, Benoist C, Mathis D. PPAR-gamma is a major driver of the accumulation and phenotype of adipose tissue Treg cells. Nature. 2012;486:549–553. doi: 10.1038/nature11132. [DOI] [PMC free article] [PubMed] [Google Scholar]
- Conboy IM, Conboy MJ, Wagers AJ, Girma ER, Weissman IL, Rando TA. Rejuvenation of aged progenitor cells by exposure to a young systemic environment. Nature. 2005;433:760–764. doi: 10.1038/nature03260. [DOI] [PubMed] [Google Scholar]
- Feuerer M, Herrero L, Cipolletta D, Naaz A, Wong J, Nayer A, Lee J, Goldfine AB, Benoist C, Shoelson S, et al. Lean, but not obese, fat is enriched for a unique population of regulatory T cells that affect metabolic parameters. Nat Med. 2009;15:930–939. doi: 10.1038/nm.2002. [DOI] [PMC free article] [PubMed] [Google Scholar]
- Gadani SP, Walsh JT, Smirnov I, Zheng J, Kipnis J. The glia-derived alarmin IL-33 orchestrates the immune response and promotes recovery following CNS injury. Neuron. 2015;85:703–709. doi: 10.1016/j.neuron.2015.01.013. [DOI] [PMC free article] [PubMed] [Google Scholar]
- Garlanda C, Dinarello CA, Mantovani A. The interleukin-1 family: back to the future. Immunity. 2013;39:1003–1018. doi: 10.1016/j.immuni.2013.11.010. [DOI] [PMC free article] [PubMed] [Google Scholar]
- Heredia JE, Mukundan L, Chen FM, Mueller AA, Deo RC, Locksley RM, Rando TA, Chawla A. Type 2 innate signals stimulate fibro/adipogenic progenitors to facilitate muscle regeneration. Cell. 2013;153:376–388. doi: 10.1016/j.cell.2013.02.053. [DOI] [PMC free article] [PubMed] [Google Scholar]
- Ishimaru N, Nitta T, Arakaki R, Yamada A, Lipp M, Takahama Y, Hayashi Y. In situ patrolling of regulatory T cells is essential for protecting autoimmune exocrinopathy. PLoS ONE. 2010;5:e8588. doi: 10.1371/journal.pone.0008588. [DOI] [PMC free article] [PubMed] [Google Scholar]
- Jang YC, Sinha M, Cerletti M, Dall'Osso C, Wagers AJ. Skeletal muscle stem cells: effects of aging and metabolism on muscle regenerative function. Cold Spring Harb Symp Quant Biol. 2011;76:101–111. doi: 10.1101/sqb.2011.76.010652. [DOI] [PubMed] [Google Scholar]
- Joe AW, Yi L, Natarajan A, Le GF, So L, Wang J, Rudnicki MA, Rossi FM. Muscle injury activates resident fibro/adipogenic progenitors that facilitate myogenesis. Nat Cell Biol. 2010;12:153–163. doi: 10.1038/ncb2015. [DOI] [PMC free article] [PubMed] [Google Scholar]
- Kakkar R, Hei H, Dobner S, Lee RT. Interleukin 33 as a mechanically responsive cytokine secreted by living cells. J Biol Chem. 2012;287:6941–6948. doi: 10.1074/jbc.M111.298703. [DOI] [PMC free article] [PubMed] [Google Scholar]
- Kolodin D, van PN, Li C, Magnuson AM, Cipolletta D, Miller CM, Wagers A, Germain RN, Benoist C, Mathis D. Antigen- and cytokine-driven accumulation of regulatory T cells in visceral adipose tissue of lean mice. Cell Metab. 2015;21:543–557. doi: 10.1016/j.cmet.2015.03.005. [DOI] [PMC free article] [PubMed] [Google Scholar]
- Kunkel GT, Maceyka M, Milstien S, Spiegel S. Targeting the sphingosine-1-phosphate axis in cancer, inflammation and beyond. Nat Rev Drug Discov. 2013;12:688–702. doi: 10.1038/nrd4099. [DOI] [PMC free article] [PubMed] [Google Scholar]
- Maier A. Development and regeneration of muscle spindles in mammals and birds. Int J Dev Biol. 1997;41:1–17. [PubMed] [Google Scholar]
- Malhotra D, Fletcher AL, Astarita J, Lukacs-Kornek V, Tayalia P, Gonzalez SF, Elpek KG, Chang SK, Knoblich K, Hemler ME, et al. Transcriptional profiling of stroma from inflamed and resting lymph nodes defines immunological hallmarks. Nat Immunol. 2012;13:499–510. doi: 10.1038/ni.2262. [DOI] [PMC free article] [PubMed] [Google Scholar]
- Matta BM, Lott JM, Mathews LR, Liu Q, Rosborough BR, Blazar BR, Turnquist HR. IL-33 is an unconventional Alarmin that stimulates IL-2 secretion by dendritic cells to selectively expand IL-33R/ST2+ regulatory T cells. J Immunol. 2014;193:4010–4020. doi: 10.4049/jimmunol.1400481. [DOI] [PMC free article] [PubMed] [Google Scholar]
- Mo R, Chen J, Han Y, Bueno-Cannizares C, Misek DE, Lescure PA, Hanash S, Yung RL. T cell chemokine receptor expression in aging. J Immunol. 2003;170:895–904. doi: 10.4049/jimmunol.170.2.895. [DOI] [PubMed] [Google Scholar]
- Molofsky AB, Nussbaum JC, Liang HE, Van Dyken SJ, Cheng LE, Mohapatra A, Chawla A, Locksley RM. Innate lymphoid type 2 cells sustain visceral adipose tissue eosinophils and alternatively activated macrophages. J Exp Med. 2013;210:535–549. doi: 10.1084/jem.20121964. [DOI] [PMC free article] [PubMed] [Google Scholar]
- Molofsky AB, Van GF, Liang HE, Van Dyken SJ, Nussbaum JC, Lee J, Bluestone JA, Locksley RM. Interleukin-33 and interferon-gamma counter-regulate group 2 innate lymphoid cell activation during immune perturbation. Immunity. 2015;43:161–174. doi: 10.1016/j.immuni.2015.05.019. [DOI] [PMC free article] [PubMed] [Google Scholar]
- Murphy MM, Lawson JA, Mathew SJ, Hutcheson DA, Kardon G. Satellite cells, connective tissue fibroblasts and their interactions are crucial for muscle regeneration. Development. 2011;138:3625–3637. doi: 10.1242/dev.064162. [DOI] [PMC free article] [PubMed] [Google Scholar]
- Nikolich-Zugich J. Aging of the T cell compartment in mice and humans: from no naive expectations to foggy memories. J Immunol. 2014;193:2622–2629. doi: 10.4049/jimmunol.1401174. [DOI] [PMC free article] [PubMed] [Google Scholar]
- Painter MW, Davis S, Hardy RR, Mathis D, Benoist C. Transcriptomes of the B and T lineages compared by multiplatform microarray profiling. J Immunol. 2011;186:3047–3057. doi: 10.4049/jimmunol.1002695. [DOI] [PMC free article] [PubMed] [Google Scholar]
- Rubtsov YP, Rasmussen JP, Chi EY, Fontenot J, Castelli L, Ye X, Treuting P, Siewe L, Roers A, Henderson WR, Jr, et al. Regulatory T cell-derived interleukin-10 limits inflammation at environmental interfaces. Immunity. 2008;28:546–558. doi: 10.1016/j.immuni.2008.02.017. [DOI] [PubMed] [Google Scholar]
- Sanada S, Hakuno D, Higgins LJ, Schreiter ER, McKenzie AN, Lee RT. IL-33 and ST2 comprise a critical biomechanically induced and cardioprotective signaling system. J Clin Invest. 2007;117:1538–1549. doi: 10.1172/JCI30634. [DOI] [PMC free article] [PubMed] [Google Scholar]
- Schiering C, Krausgruber T, Chomka A, Frohlich A, Adelmann K, Wohlfert EA, Pott J, Griseri T, Bollrath J, Hegazy AN, et al. The alarmin IL-33 promotes regulatory T-cell function in the intestine. Nature. 2014;513:564–568. doi: 10.1038/nature13577. [DOI] [PMC free article] [PubMed] [Google Scholar]
- Schwab SR, Cyster JG. Finding a way out: lymphocyte egress from lymphoid organs. Nat Immunol. 2007;8:1295–1301. doi: 10.1038/ni1545. [DOI] [PubMed] [Google Scholar]
- Sinha M, Jang YC, Oh J, Khong D, Wu EY, Manohar R, Miller C, Regalado SG, Loffredo FS, Pancoast JR, et al. Restoring systemic GDF11 levels reverses age-related dysfunction in mouse skeletal muscle. Science. 2014;344:649–652. doi: 10.1126/science.1251152. [DOI] [PMC free article] [PubMed] [Google Scholar]
- Suffia I, Reckling SK, Salay G, Belkaid Y. A role for CD103 in the retention of CD4+CD25+ Treg and control of Leishmania major infection. J Immunol. 2005;174:5444–5455. doi: 10.4049/jimmunol.174.9.5444. [DOI] [PubMed] [Google Scholar]
- Takeoka A, Vollenweider I, Courtine G, Arber S. Muscle spindle feedback directs locomotor recovery and circuit reorganization after spinal cord injury. Cell. 2014;159:1626–1639. doi: 10.1016/j.cell.2014.11.019. [DOI] [PubMed] [Google Scholar]
- Tidball JG, Villalta SA. Regulatory interactions between muscle and the immune system during muscle regeneration. Am J Physiol Regul Integr Comp Physiol. 2010;298:R1173–R1187. doi: 10.1152/ajpregu.00735.2009. [DOI] [PMC free article] [PubMed] [Google Scholar]
- Tomura M, Yoshida N, Tanaka J, Karasawa S, Miwa Y, Miyawaki A, Kanagawa O. Monitoring cellular movement in vivo with photoconvertible fluorescence protein “Kaede” transgenic mice. Proc Natl Acad Sci U S A. 2008;105:10871–10876. doi: 10.1073/pnas.0802278105. [DOI] [PMC free article] [PubMed] [Google Scholar]
- Turnquist HR, Zhao Z, Rosborough BR, Liu Q, Castellaneta A, Isse K, Wang Z, Lang M, Stolz DB, Zheng XX, et al. IL-33 expands suppressive CD11b+ Gr-1(int) and regulatory T cells, including ST2L+ Foxp3+ cells, and mediates regulatory T cell-dependent promotion of cardiac allograft survival. J Immunol. 2011;187:4598–4610. doi: 10.4049/jimmunol.1100519. [DOI] [PMC free article] [PubMed] [Google Scholar]
- Uezumi A, Fukada S, Yamamoto N, Takeda S, Tsuchida K. Mesenchymal progenitors distinct from satellite cells contribute to ectopic fat cell formation in skeletal muscle. Nat Cell Biol. 2010;12:143–152. doi: 10.1038/ncb2014. [DOI] [PubMed] [Google Scholar]
- Vasanthakumar A, Moro K, Xin A, Liao Y, Gloury R, Kawamoto S, Fagarasan S, Mielke LA, Afshar-Sterle S, Masters SL, et al. The transcriptional regulators IRF4, BATF and IL-33 orchestrate development and maintenance of adipose tissue-resident regulatory T cells. Nat Immunol. 2015;16:276–285. doi: 10.1038/ni.3085. [DOI] [PubMed] [Google Scholar]
- Villalta SA, Rosenthal W, Martinez L, Kaur A, Sparwasser T, Tidball JG, Margeta M, Spencer MJ, Bluestone JA. Regulatory T cells suppress muscle inflammation and injury in muscular dystrophy. Sci Transl Med. 2014;6:258ra142. doi: 10.1126/scitranslmed.3009925. [DOI] [PMC free article] [PubMed] [Google Scholar]
Associated Data
This section collects any data citations, data availability statements, or supplementary materials included in this article.
Supplementary Materials
Figure S1 (associated with Fig. 1): Response of skeletal muscle myeloid-lineage cells to CTX injury.
As per Fig. 1A, except myeloid lineage cells were examined 4 days post-injury. A. Gating strategy, resulting in populations R1 (mostly MFs, some MOs), R2 (MFs), R3 (mostly DCs), and R4 (mostly MOs), and eosinophils. B. Summary data for the above-delineated populations. n=4–8 mice from two experiments.
Figure S2 (associated with Fig. 2): Different Treg population dynamics in young and aged mice.
A. Recruitment from circulating T cell pools. Summary data for % Kaede-red+ T cells 24 hours after exposure of CLNs to violet light. These data were used to calculate the migration ratios of Fig. 2D. B. Proliferation. Representative dot plots of dividing Treg cells one day after co-administration of CTX and EdU. Numbers depict fraction of CD4+ T cells within the designated gate. Representative of two experiments. Summary data appear in Fig. 2F.
Figure S3 (associated with Fig. 4): Histologic examination of IL-33-expressing cells in muscle.
A. Low-magnification immunofluorescence microscopy of muscle sections 6 hours post-CTX-induced injury. Original magnification=100x. Scale bar=50μm. B. Lack of IL-33-expressing CD45+ cells in skeletal muscle 6 hours after CTX injury. Original magnification=400x. Scale bar=10μm. C. Lack of IL-33-expressing CD31+ cells in skeletal muscle 6 hours after CTX injury. Original magnification= 400x. Scale bar=10μm. Arrows point to some IL-33+ cells. Note their lack of co-staining for CD45 (B) or CD31 (C).
Figure S4 (associated with Fig. 7): Minimal IL-33 effects on Tconv cell accumulation or Treg cell recruitment from the circulation.
A. Data from the same experiment as that depicted in Fig. 7A except that Tconv cells were examined. B-D. Analysis of Treg recruitment from the CLNs of 2–3 month-old Kaede tg mice using the protocol depicted in panel B. n=7 from two experiments. C. Cytofluorometric analysis of the fraction of Foxp3+ of CD4+ cells (left) or ST2+ of Foxp3+ cells (right). D. Flow cytometric quantification of cells photoconverted in the CLNs and found in the muscle (left) or control, non-draining, ALNs (right). E. Determination of the migration ratio as per Fig. 2E. A value of 1 reflects the general circulation.
Figure S5 (associated with Fig. 7): IL-33 effects on Treg cell proliferation and gene expression.
A. >18-month-old B6 mice were treated according to the protocol depicted in panel A. n=8 from two experiments. B-D. Proliferation of Treg cells. Cytofluorometric determination of the fraction Foxp3+ of CD4+ T cells (B, left), fraction ST2+ of Foxp3+T cells (B, right), fraction (left) and number (right) of EdU+ Foxp3+ cells (C), and fraction (left) and number (right) of Ki67+-Foxp3+CD4+ T cells (D). E-G. Same as B-D except Foxp3-CD4+ T cells were examined. H. RNAseq comparison of gene expression by Tregs isolated from 4d CTX-injured muscle of 2-month-old mice treated with IL-33 vs vehicle (PBS) alone at the time of injury. Muscle over- and under-represented transcript signatures came from (Burzyn et al., 2013).
Table S1 (associated with Fig. 3): Muscle “homeostasis/function” and “epair/regeneration” gene lists.
A and B. Muscle gene lists. Curated from microarray analysis of normalized expression values of day 4 vs day 8 ctx-injured muscle from 2 mth-old mice. Data are from (Burzyn et al., 2013).
(A) Muscle homeostasis/function. Genes up-regulated in day 8 vs day 4 injured muscle. (B) Muscle regneration/repair. Genes down-regulated in day 8 vs day 4 injured muscle.