Abstract
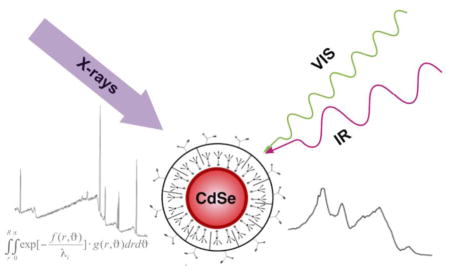
Surface engineering advances of semiconductor quantum dots (QDs) have enabled their application to molecular labeling, disease diagnostics and tumor imaging. For biological applications, hydrophobic core/shell QDs are transferred into aqueous solutions through the incorporation of water-solubility imparting moieties, typically achieved via direct exchange of the native surface passivating ligands or indirectly through the adsorption of polymers. Although polymeric encapsulation has gained wide acceptance, there are few reports addressing the characterization of the adsorbed polymers and existing theoretical analyses are typically based on simple geometric models. In this work, we experimentally characterize and quantify water-soluble QDs prepared by adsorption of amphiphilic poly(maleic anhydride-alt-1-tetradecene) (PMAT, MW~9000) onto commercially available CdSe/CdS/ZnS (CdSe/CdS/ZnS-PMAT). Using x-ray photoelectron spectroscopy (XPS) we determined that ~15 PMAT molecules are adsorbed onto each QD and sum frequency generation (SFG) vibrational spectra was utilized to investigate the mechanism of interaction between PMAT molecules and the QD surface. Importantly, when employed together, these techniques constitute a platform with which to investigate any polymer-nanoparticle complex in general.
Keywords: Quantum Dots, X-ray Photoelectron Spectroscopy, Sum Frequency Generation
Graphical abstract
Introduction
As nanoparticles (NPs) in general, and semiconductor quantum dots (QDs) in particular, become an ever-present stalwart in the application of nanotechnology to the biomedical sciences, there has been an increasing surge in the literature regarding the need for more accurate analytical characterization of their structure, composition and biological effects [1–3]. Indeed, over the last decade there have been an increasing number of reports of QDs application as bright luminescent labels for molecular diagnostics, ultrasensitive in vitro assays and tumor imaging [4–7]. Comprehensive characterization has become important to their successful engineering and application [8–10]. The notable characteristics of QDs include unique optical properties such as size-tunable narrow Gaussian emission line shapes, broad excitation spectra, robust photo-stability and high quantum yields [11–13]. High-quality II–VI CdSe cores with a thin protective overlayer of higher bandgap ZnS[14] (overall diameter [11] less than 10 nm) are commonly employed. The photo-generated exciton is confined to the lower bandgap fluorescent core while the surrounding ZnS shell enhances photoluminescence by confining the exciton and passivating the core; thereby attenuating photo-oxidation and surface defect effects [12].
A result of the high-temperature organometallic synthetic procedure used to produce monodisperse nanoparticles is the nanocrystal surface being passivated with a monolayer of hydrophobic surfactant ligands [15], yielding overall hydrophobic nanoparticles. However, to serve as biologically relevant probes, QDs must be transferred into aqueous solutions and often undergo conjugation with biological molecules such as small molecule ligands, nucleic acids and proteins. The two most widely used methods to achieve phase transfer are to perform ligand exchange, thereby exchanging native surface molecules with bi-functional water-solubility imparting ligands [16–20], or polymer encapsulation, wherein a polymer containing both hydrophobic and hydrophilic groups [15; 21–23] is adsorbed over the native surface ligands. Since QD optical properties are intimately sensitive to surface physical and electronic structure, the ligand exchange process can result in a dramatic decrease in photoluminescence or particle precipitation [24], although it has been shown that multidentate ligands minimize or eliminate these negative side-effects altogether [20; 25]. Importantly, polymer adsorption leaves the native ligand layer intact in a hydrocarbon bilayer thereby leaving the QD photoluminescence unaffected. As such, polymer encapsulated-nanoparticles have been successfully applied to biological studies using polyethylene glycol derivatized phospholipids [26], block copolymers [6] and amphiphilic polyanhydrides [22; 27–29] encapsulating moieties. Afterwards, specific-targeting ability is gained through the conjugation of bioaffinity ligands such as antibodies or aptamers to the polymer-coated QDs. Ideally, by optimizing the molecular stoichiometry and orientation of the encapsulated polymer, improved biocompatibility and reduced non-specific protein binding to the QDs can be achieved.
A common assumption is that the encapsulating polymers orient so the hydrophobic domains strongly interact with alkyl chains of the ligands on the QD surfaces and the hydrophilic groups face outward, rendering the QDs water-soluble. Although polymer encapsulated QDs have been widely used, there are few detailed experimental studies that directly quantify and characterize the interaction mechanism of the adsorbed polymer [22; 30; 31]. It should be noted that many theoretical analyses in the literature are typically based on simple geometric models that presume an interaction mechanism between the polymer and QD. In this study water soluble QDs are prepared by encapsulating amphiphilic poly(maleic anhydride-alt-1-tetradecene) (PMAT, MW~9000) around commercially available CdSe/CdS/ZnS (CdSe/CdS/ZnS-PMAT).
In recent years there has been increased interest in developing methods for characterizing the surface chemistry of NPs [32], but most of the method development have focused on XPS analysis of alkyl thiol covered gold NPs [33–35]. These studies represent significant advances in our ability to quantify NP surface chemistry, however, some of these approaches cannot be easily extended to the multi-shell configuration of QDs, especially since the shells in QDs contain high atomic number elements that can have a significant effect on the photoelectrons emitted from the elements in the NP core [36]. Methods that can be applied to XPS characterization of QDs include ones previously developed for NP catalyst characterization [8; 37] or ones such as simulated electron spectra for surface analysis (SESSA)[38]. However, as XPS measurements are made in ultra-high vacuum the overlayer thicknesses measured by XPS can differ from the overlayer thicknesses measured in solution due to hydration of the overlayer [39]. In this study XPS is used to directly quantify the PMAT/QD ratio. Sum frequency generation (SFG) vibrational spectroscopy, another powerful technique for characterizing polymer encapsulated NPs [40], is used to obtain additional information about the ordering and orientation of PMAT on the QD surface. This combination of techniques serves as a platform that can be extended to directly characterize any generic polymer/nanoparticle complex.
Materials and Methods
Reagents
Poly(maleic anhydride-alt-1-tetradecene) (PMAT, MW~9000), chloroform, hexane, methanol and sodium borate were purchased from Sigma-Aldrich (St. Louis, MO) and used as received. Boric acid was purchased from Fisher Scientific and used as received. CdSe/CdS/ZnS (622 nm emission) QDs synthesized by the successive ion layer adsorption and reduction (SILAR)[8; 41; 42] method and purified using standard hexane/methanol extraction [41; 43] were obtained in powder form as a gift from Ocean Nanotech (Springdale, AR).
PMAT-encapsulation
Hydrophobic CdSe/CdS/ZnS QDs were dissolved in chloroform and mixed with a 250–500 molar excess of PMAT. QD concentration was estimated from absorption measurements as previously discussed by Peng and coworkers [44]. A few drops of methanol were added to the chloroform mixture to aid in PMAT dissolution. After thorough mixing for a few minutes on a vortexer, the chloroform was evaporated under vacuum, yielding CdSe/CdS/ZnS-PMAT QDs. The resultant residue was resuspended in 50 mM borate buffer (1:1 mixture of sodium borate and boric acid, pH 8.5) for 5 minutes without agitation to allow base-mediated ring-opening of the anhydride groups to yield highly-negatively charged carboxylic acid functionalized water-soluble CdSe/CdS/ZnS-PMAT QDs. Afterwards, the solution was vortexed to fully resuspend the water-soluble QDs. Excess PMAT was removed by two rounds of ultra-centrifugation at 45,000 rpm for 45–60 minutes using a Beckman Coulter Ultracentrifuge (Fullerton, CA). The resulting soft pellet (100–150 μL) was collected each time and resuspended in fresh borate buffer.
Hydrodynamic radius and optical analysis
Nanoparticle hydrodynamic radii were obtained by light scattering analysis performed on a Malvern Zetasizer NanoZS (Worcestershire, UK). Hydrodynamic size data were obtained from a number-weighted size distribution analysis and was reported as the standard error of the mean. A UV-2450 spectrophotometer (Shimadzu, Columbia, MD) and a Fluoromax4 fluorometer (Horiba Jobin Yvon, Edison, NJ) were used to characterize the absorption and emission spectra of CdSe/CdS/ZnS before and after PMAT encapsulation. True-color fluorescence images were obtained with an IX-71 inverted microscope (Olympus, San Diego, CA), 100x oil-emersion objective (NA 1.40) and a Q-color5 digital color camera (Olympus) using broad-band near-UV excitation provided by a mercury lamp. A long-pass dichroic filter (400 nm) and emission filter (420 nm) were used to pass the Stokes-shifted fluorescence signals (Chroma Technologies, Brattleboro, VT).
Sample preparation for electron microscopy and surface analysis
For transmission electron microscopy (TEM) and XPS analyses CdSe/CdS/ZnS QDs were dissolved in hexane. For TEM analysis 10–20μl was drop cast onto a TEM grid. For XPS analyses 20 drops (10μl each) were sequentially dropped onto a clean silicon wafer substrate every 2 minutes and dried under ambient conditions. Two drops (100μl each) of CdSe/CdS/ZnS-PMAT QDs in borate buffer were dropped onto a clean silicon wafer substrate for XPS analyses and dried under vacuum. The samples were stored in a desiccator prior the surface analysis experiments. For SFG, the QDs were drop cast onto one side of an equilateral calcium fluoride prism and dried under ambient conditions.
Transmission Electron Microscopy (TEM)
TEM analysis was carried out at the University of Washington Molecular Analysis Facility using a FEI Tecnai G2 F20 TWIN 200kV TEM equipped with an EDAX detector. A dilute solution of QDs in hexane or water was dropped onto a Formvar-coated copper grid and allowed to dry under ambient conditions. TEM images were obtained with Gatan Digital Micrograph software. The diameter of the QDs was measured by manually segmenting the nanoparticles with image processing software, then measuring the areas of 50 QDs using ImageJ.
X-ray Photoelectron spectroscopy (XPS)
XPS data were acquired with a Surface Science Instruments S-probe spectrometer. This instrument has a monochromatized Al Kα x-ray source, hemispherical analyzer, multichannel detector and low-energy electron flood gun for charge neutralization. The x-ray spot size used for these experiments was approximately 800 μm × 800 μm. Pressure in the analytical chamber during spectral acquisition was less than 5 × 10⁻⁹ Torr. Spectra used to determine surface elemental compositions were acquired at an analyzer pass energy of 150 eV. The high-resolution C1s spectra were acquired at an analyzer pass energy of 50 eV. The take-off angle (the angle between the substrate normal and the axis of the analyzer lens) was 55° for all XPS experiments. This take-off angle is close to the ‘magic’ angle (45°) which, depending on the particle size, minimizes the effects of surface curvature and roughness [37; 45]. Three spots on two replicates were analyzed for each sample type.
The ESCA Analysis A program was used to determine peak areas. The binding energy scale was calibrated by assigning the hydrocarbon peak in C1s high-resolution spectra to a binding energy of 285.0 eV. Peak fitting of high-resolution C1s spectra was performed using XPSPEAK4.1 software.
Sum Frequency Generation (SFG)
SFG vibrational spectra were obtained by overlapping visible and tunable IR laser pulses (25 ps) in time and space. The visible beam with a wavelength of 532 nm was delivered by an EKSPLA Nd:YAG laser operating at 50 Hz, which was also used to pump an EKSPLA optical parametric generation/amplification. The difference frequency unit was based on barium borate and AgGaS2 crystals to generate tunable IR laser radiation from 1000 – 4000 cm−1. The bandwidth was 1 cm−1 for the visible pump pulses. The IR laser light had a bandwidth of 1 cm−1 in the C–H stretching region (2800 – 3000 cm−1) and 4 cm−1 in all other regions. Both beams were focused and had a diameter of less than 1 mm at the sample. The energy for each beam was 160 μJ per pulse. The SFG signal generated at the sample was analyzed by filters and a monochromator, detected with a gated photomultiplier tube. The spectra were collected with 400 shots per data point in 2 or 4 cm−1 increments, depending on the spectral range. The SFG spectra were normalized by a reference SFG signal generated in a ZnS crystal. The QDs were probed going through the calcium fluoride prism in a near-total internal reflection geometry.
Results and Discussion
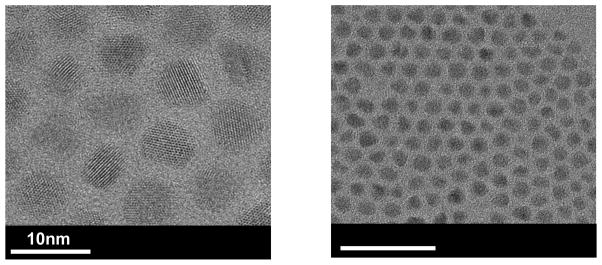
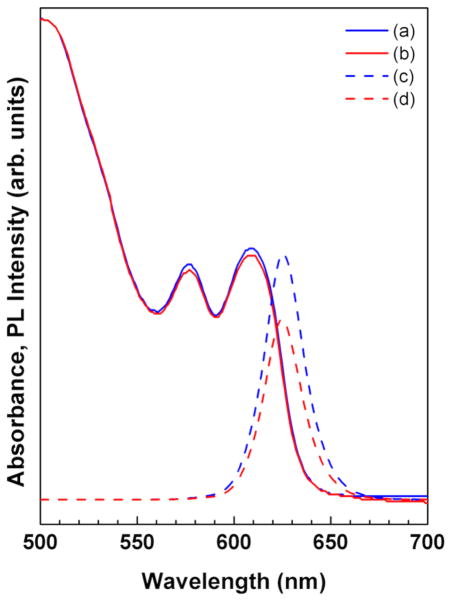
As indicated in the high resolution TEM images, the CdSe/CdS/ZnS QDs (Figure 1) show nearly spherical crystalline particles with a narrow size distribution and an average diameter of 6.9 ± 0.6nm. After PMAT encapsulation, the CdSe/CdS/ZnS-PMAT QDs had a hydrodynamic diameter of 10–13 nm and exhibited ~ 73% of the original fluorescent intensity. The QDs formed a sharp band when run on 1% agarose gel at 100V for 30 minutes and moved towards the positive electrode, indicating a monodisperse population of the negatively-charged particles. Figure 2 shows no difference in the absorbance peak position and a minor decrease in the photoluminescence spectra after PMAT encapsulation indicating that this procedure is indeed benign to QDs [22].
Figure 1.
High resolution transmission electron microscopy images of CdSe/CdS/ZnS QDs show nearly spherical crystalline particles with a narrow size distribution and diameter of ~6.9nm ± 0.6nm.
Figure 2.
Evaluation of optical properties of the CdSe/CdS/ZnS QDs prior to and after PMAT encapsulation: (a) absorbance of CdSe/CdS/ZnS (b) absorbance of CdSe/CdS/ZnS-PMAT (c) photoluminescence of CdSe/CdS/ZnS and (d) photoluminescence of CdSe/CdS/ZnS-PMAT. No difference in the absorbance peak position and a minor decrease in the photoluminescence intensity are observed.
The QDs have a thin layer (~1nm) of CdS between the CdSe core and the ZnS shell [8]. The XPS determined atomic percentages for the CdSe/CdS/ZnS QDs before and after PMAT encapsulation are given in Table 1. The P2p region contains the P2p3/2 and P2p1/2 peaks as well as the Se(L2M4,5M4,5) Auger peak. The S2s region contains the S2s and Se3s peaks. For calculation of the XPS atomic percentages in Table 2, the contributions of Se(L2M4,5M4,5) and Se 3s to the P and S spectra were substracted [8].
Table 1.
Initial XPS atomic percentages of CdSe/CdS/ZnS and CdSe/CdS/ZnS-PMAT QDs indicate the decrease of the cores elements after PMAT encapsulation. The initial XPS atomic percentages assume a homogeneous distribution of elements in the QDs. Corrected XPS atomic percentages, which account for the core-shell-shell distribution of elements in the QDs, of CdSe/CdS/ZnS-PMAT QDs were used to estimate that ~15 PMAT molecules were attached to each QD.
| at% | |||
|---|---|---|---|
| Initial XPS atomic percentages | Corrected XPS atomic percentages CdSe/CdS/ZnS-PMAT QDs elements | ||
| Element | CdSe/CdS/ZnS | CdSe/CdS/ZnS-PMAT | |
| C 1s | 83.4±2.1 | 49.1±2.1 | 80 |
| O 1s | 5.7±0.9 | 33.2±0.6 | |
| Cd 3d | 5.6±0.7 | 1.5±0.1 | 17 |
| Se 3d | 0.9±0.1 | 0.16±0.01 | 3 |
| P 2p | 0.6±0.1 | traces | |
| Zn 2p3 | 0.08±0.02 | traces | |
| S 2s | 1.2±0.4 | traces | |
| F 1s | 2.5±1.6 | --- | |
| Na 1s | --- | 5.3±0.3 | |
| Cl 2p | --- | 0.6±0.08 | |
| B1s | --- | 9.8±1.4 | |
| Cd/Se | 6.2 | 9.4 | 5.6 |
XPS detected Cd, Se, Zn and S signals from the CdSe/CdS/ZnS core. The XPS Cd/Se and the S/Zn atomic ratios are greater than 1 (6 and 15, respectively), closely matching a three-layer structure of CdSe/CdS/ZnS that is produced by SILAR synthetic method [8; 41; 42]. The XPS phosphorous signal is unique marker for the native organic ligands such as TOPO and phosphonic acids [43]. However, the XPS C/P and O/P atomic ratios are higher than the expected stoichiometric ratios, 24 for C/P in TOPO and 3 for O/P presented in phosphonic acids. This difference could to be due to the presence of organic impurities from the solvents or adsorption of adventitious carbon. The presence of organic impurities might also account for the detected fluorine signal. Previous work has highlighted that the phosphonic acid impurities contained in technical grade TOPO are retained on the QD surface [43]. The initial XPS atomic percentages for the CdSe/CdS/ZnS-PMAT QDs in Table 1 contain B, Na and Cl signals, which are residual ions/species from the borate buffer solution (NaCl and B4Na2O7). The encapsulating PMAT layer covers the CdSe/CdS/ZnS QD providing an effective attenuation of the XPS signals from the QD core elements. As the XPS signal decreases exponentially with depth from the outermost surface, we have observed a substantial decrease in the CdSe/CdS/ZnS core elements (Cd, Se, Zn, S, P) and only traces of Zn, S and P were detected after PMAT encapsulation.
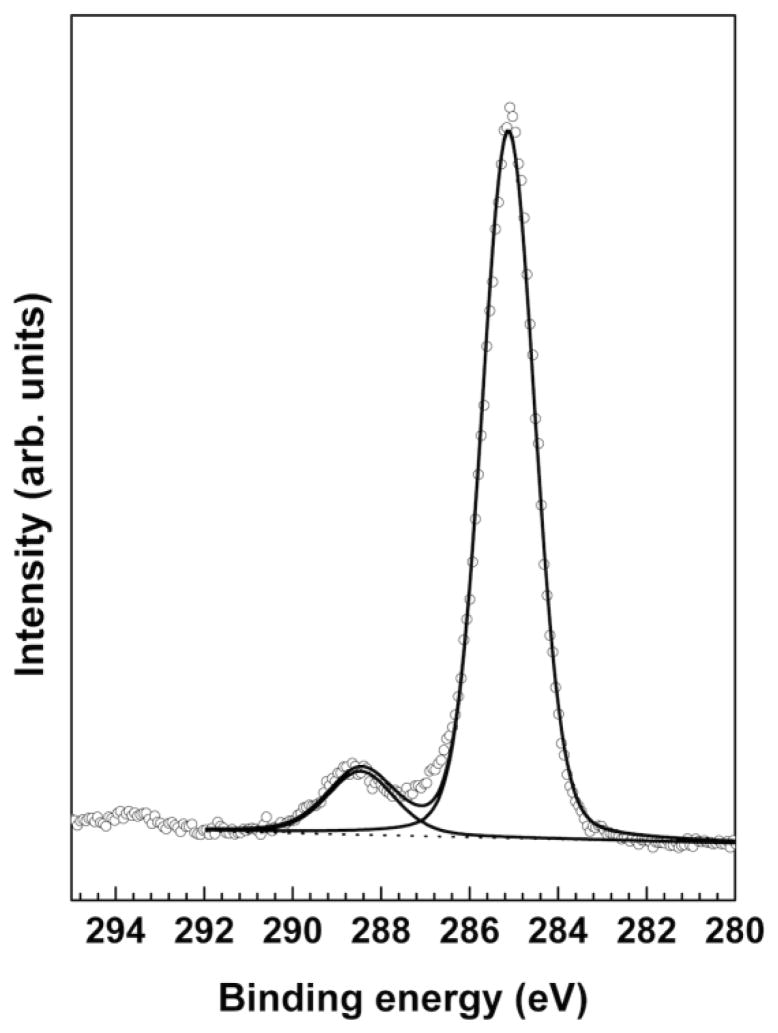
The high resolution XPS C1s spectrum in Figure 3 was fit with peaks at 285.0 eV (hydrocarbon) and 288.3 eV (anhydride/acid). The measured hydrocarbon to anhydride/acid ratio of 8.1 is in excellent agreement with the expected theoretical CH2/C=O ratio of 8 from the PMAT molecular structure. The XPS C1s high-resolution spectrum suggests that most of the XPS carbon signal from the CdSe/CdS/ZnSe-PMAT QDs can be attributed to the PMAT encapsulation layer. This is consistent with detection of only trace amounts of phosphorous from the organic ligands. The measured XPS O/C atomic ratio (~0.68) is higher than the O/C stoichiometric ratio (0.22) of the PMAT molecules. This is likely due the presence of oxygen atoms from the elements associated with the borate buffer that were detected in this sample (Na, B, etc). The thickness of the PMAT layer was estimated by a method that was recently developed by Shard to interpret the XPS data from core-shell nanoparticles [33]. Based on this method the estimated thickness of the encapsulated PMAT is ~2nm indicating that the overall diameter of the CdSe/CdS/ZnS-PMAT QDs is ~11nm (7nm QD plus twice the PMAT thickness). This value falls within the mesured hydrodynamic diameter of 10–13 nm, suggesting that PMAT forms a dense layer on the QDs and doesn’t adsorb significant amounts of water molecules from the surrounding solution.
Figure 3.
High-resolution XPS C1s spectrum of the CdSe/CdS/ZnS-PMAT QDs fit with peaks at 285.0 eV (hydrocarbon) and 288.3 eV (anhydride/acid).
The initial atomic percentages of the core elements in Table 1 are lower than their actual percentages due to attenuation effects and eliminating these effects allows more accurate elemental composition. The QDs in the present study have spherical size that is comparable to the XPS photoelectron inelastic mean free path. As a result the actual elemental composition should be corrected by applying following integral [37]:
| (1) |
The numeric solution of equation (1) includes the elemental distribution of each element within the analyzed specimen. The core structure of the QDs assumes that the Cd and Se are originated from an inner core (where r varies from zero to ~3.5) that is surrounded by the PMAT layer. Numerical solutions of equation (1) provide the ‘corrected XPS composition’ of the CdSe/CdS/ZnS-PMAT (Table 1). The signals from the shells are too weak to be included since only traces of S and Zn were detected.
The XPS atomic percentages were used to estimate the number of polymers chain associated with each QD. The XPS atomic composition represents the average XPS composition of a single QD, since the measured samples can be considered to be a layer of close-packed, randomly arranged QDs on a smooth silicon wafer surface [37; 38]. Taking ratios of corrected atomic percentages in Table 1 provides atomic ratios or the ratios of the number of atoms (#) in a sample as shown in equation (2).
| (2) |
As noted above, XPS averages over large number of QDs, so the corrected composition in Table 1 represents that of an average single QD. The number of Cd and Se atoms in one single QD can be calculated from the dimension of each QD (TEM image in Figure 1). The properties of the CdSe core are MW(CdSe)=191.37g/mole and ρ(CdSe)= 5.816g/cm3. Using these parameters provides an estimate of ~ 2000 Cd and Se atoms per CdSe core. Consideration of a thin CdS layer around of the CdSe core does not have a significant effect on this quantitative data as both have similar molar volumes, 32.9 and 30.0cm3/mole for CdSe and CdS, respectively. The (%Cd +%Se)/%C ratio can be calculated from the corrected data in Table 1, which yields a value of ~8000 carbon atoms surrounding the QD core. The contribution of the organic ligands to the carbon atomic percentage is neglected (Figure 3 and Table 1). There are 18 carbon atoms per PMAT monomer and ~30 monomers per PMAT polymer (MW (one monomer) = 310g/mole and the approximate MW (PMAT) = 9000 Da), yielding the estimated PMAT/QD ratio to be ~15.
Colvin and co-workers [22] used thermogravimetric analysis to show that rod-shaped QDs (5.8nm head width and 8.4nm long) were encapsulated with ~1 poly(maleic anhydride-alt-1-octaecene) (PMAO, 40,000 MW) per QD. The difference between the two studies may be explained by a higher coating density of the smaller polymer (PMAT 9000 MW) and the different shape of the QDs.
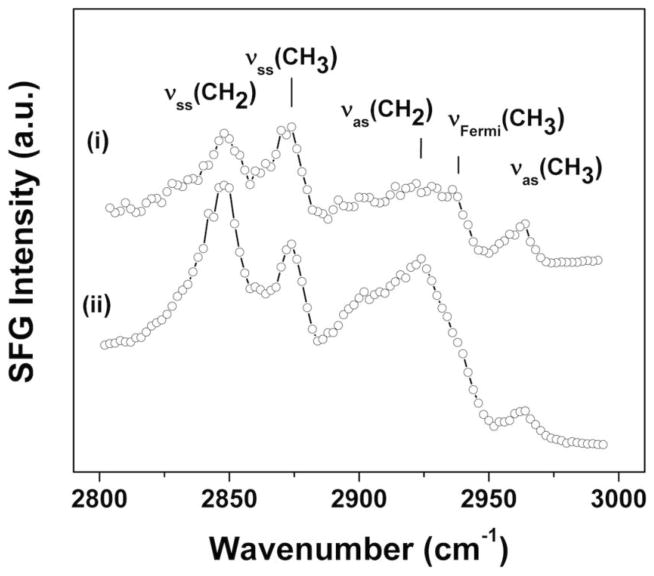
Figure 4(i) displays the ppp (sum, visible, IR) polarization SFG C–H stretching spectrum of the CdSe/CdS/ZnS QDs. The spectrum shows distinct features that can be assigned to asymmetric (2963 cm−1) and symmetric (2874 cm−1) stretches as well as a Fermi-resonance (2937 cm−1) of the ligands CH3 groups [48; 49]. Resonances assigned to the symmetric (2848 cm−1) and asymmetric (2921cm−1) methylene stretches from the ligands chains are also observed, but are comparatively weak [48; 49]. The strong methyl stretches and weak methylene stretches observed in the SFG CH spectrum indicate the ligand chains have a significant degree of alignment and orientational order, with only a moderate amount of gauche defects. Disordered groups and centrosymmetric groups do not produce a SFG signal [50; 51]. Thus, well-ordered and aligned alkyl chains in an all-trans configuration only exhibit methyl stretches in SFG CH spectra. The extent of the ligands molecular order is significant in view of the QDs surface geometry shown in Figure 1. Self-assembled monolayer films on curved surfaces might be expected to exhibit lower molecular alignment and packing densities compared to flat surfaces due to a decrease in the chain density moving away from the surface on highly curved surface [52–54]. However, nanoparticles are not perfectly spherical and should be considered to be polyhedrons with surfaces of low index crystal planes [1]. If the nanoparticle surface planes are sufficiently large, then surface ligand ordering on the low-index terraces should be similar to that observed for flat surfaces. The SFG results suggest this is the case for the CdSe/CdS/ZnS QDs, in agreement with a IR study by Young et al. who also reported densely packed TOPO chains on CdS QDs [55]. The SFG methylene stretch intensities of the CdSe/CdS/ZnSe-PMAT increase while the methyl stretch intensities decrease significantly (Figure 4(ii)). This indicates PMAT encapsulation increases the number of gauche defects and therefore leads to a decrease in the order of the ligands chains. A CH stretching mode related to the methylene group in the polymer backbone is also visible in the CdSe/CdS/ZnS-PMAT spectrum near 2900 cm−1, indicating some degree of order in the PMAT polymer layer.
Figure 4.
SFG CH stretch spectra acquired in ppp (sum, visible, IR) polarization from (i) CdSe/CdS/ZnS and (ii) CdSe/CdS/ZnS-PMAT. The spectra show that the organic ligands have a significant degree of orientational order and the PMAT has a more limited degree of order.
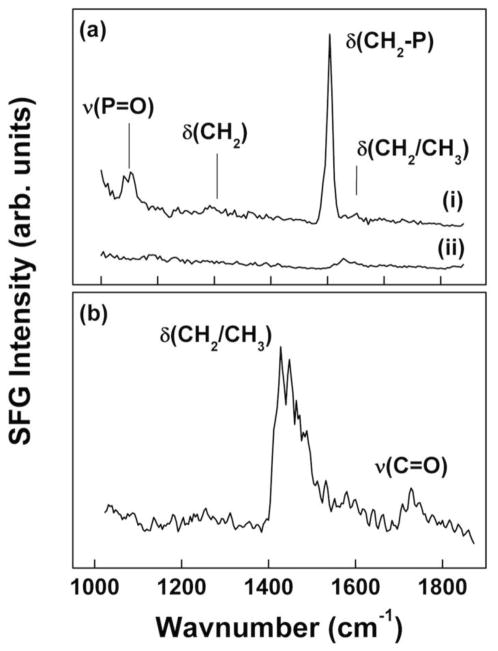
The CH region analysis is further corroborated by the fingerprint ssp polarization SFG spectrum. The CdSe/CdS/ZnS spectrum in Figure 5a(i) exhibits a very pronounced resonance near 1403 cm−1 (δ(CH2-P))[49], which can be assigned to deformation vibrations of the methylene unit located next to the phosphorous atom. In addition, there is a broad mode around 1040 – 1050 cm−1 that can be assigned to P=O groups covalently bound to dielectric surfaces [49], [55; 56]. Unbound R3P=O resonances would be expected near 1150 cm−1 [49; 55]. The broad shape of the resonance has been attributed to the P=O group occupying multiple adsorption sites. CH deformation modes are very weak, but are detectable near 1200 cm−1 and 1430 cm−1. Again, the presence of the P=O and δ(CH2-P) modes demonstrates the high degree of orientational order in the organic ligands.
Figure 5.
(a) Fingerprint region ssp polarization SFG spectra of (i) CdSe/CdS/ZnS and (ii) CdSe/CdS/ZnS-PMAT. The presence of the P=O and δ(CH2-P) modes demonstrates the high degree of orientational order in the organic ligands. This order is lost after PMAT encapsulation due to the penetration of the PMAT side chains deep into the organic film. (b) Fingerprint region ppp polarization SFG spectrum of CdSe/CdS/ZnS-PMAT exhibit a C=O stretching from a partially ordered surface layer of carboxylic groups
The SFG spectrum of the CdSe/CdS/ZnS-PMAT QD is almost featureless in the fingerprint region (Figure 5a(ii)). Only a weak feature from the C–H deformation modes is present. This implies that the order in the ligands film close to the QD surface (i.e. the P=O and the CH2 located next to the P atom) is lost after PMAT encapsulation. This is consistent with penetration of the PMAT side chains deep into the surface ligand film. The fingerprint region SFG spectrum acquired with ppp polarization for the CdSe/CdS/ZnS-PMAT (Figure 5b) exhibit a weak C=O stretching mode near 1728 cm−1 in addition to the C–H bending vibrations near 1450 cm−1 [55]. The former feature comes from a partially ordered surface layer of carboxylic groups. Our SFG study of the interaction between the PMAT and the organic ligands as well as the PMAT orientation are consistent with a model where QDs are densely coated with the amphiphilic polymer.
Conclusions
The multi-technique results from this study provide a detailed understanding of interaction between PMAT and the native QD surface ligands after encapsulation. XPS analysis estimates that ~15 PMAT molecules were adsorbed to each QD forming a 2nm film on their surfaces. The application of SFG to QDs indicates that the PMAT hydrocarbon chains penetrated into the surface ligand layer, confirming a common assumption in the literature. Importantly, this work demonstrates that these techniques and method of analysis are a versatile platform capable of shedding light on any polymer/nanoparticle complex. The detailed characterization and analysis methodology holds potential to benefit the nanoparticle surface engineering and biomedical research fields.
Highlights.
X-ray photoelectron spectroscopy (XPS) was used to quantity the overlayer thickness (~2nm) of poly(maleic anhydride-alt-1-tetradecene) (PMAT, MW~9000) adsorbed onto CdSe/CdS/ZnS quantum dots (QDs). This corresponds to ~15 PMAT molecules adsorbed onto each QD. Transmission electron microscopy (TEM) was used to determine the diameter of the QDs (6.9 ± 0.6 nm) prior to PMAT encapsulation. Sum frequency generation (SFG) vibrational spectra was utilized to investigate the mechanism of interaction between PMAT molecules and the QD surface. Together these techniques constitute a powerful platform to investigate any polymer-nanoparticle system.
Acknowledgments
This research was funded by the National ESCA and Surface Analysis Center for Biomedical Problems (NIH grant EB-002027). TW thanks the Deutsche Forschungsgemeinschaft for a research fellowship. S.R.D. acknowledges the NSF for generous fellowship support. The authors would also like to show appreciation to Pavel Zrazhevskiy for help with QD preparation and purification and OceanNanotech for providing the QD sample. Part of this work was conducted at the University of Washington Molecular Analysis Facility, funded in part by the NSF National Nanotechnology Infrastructure Network (NNIN).
Footnotes
Publisher's Disclaimer: This is a PDF file of an unedited manuscript that has been accepted for publication. As a service to our customers we are providing this early version of the manuscript. The manuscript will undergo copyediting, typesetting, and review of the resulting proof before it is published in its final citable form. Please note that during the production process errors may be discovered which could affect the content, and all legal disclaimers that apply to the journal pertain.
References
- 1.Grainger DW, Castner DG. Advanced Materials. 2008;20:867–877. [Google Scholar]
- 2.Baer DR, et al. J Vac Sci Technol A. 2013;31:50820. doi: 10.1116/1.4818423. [DOI] [PMC free article] [PubMed] [Google Scholar]
- 3.Baer D, Gaspar D, Nachimuthu P, Techane S, Castner D. Analytical and Bioanalytical Chemistry. 2010;396:983–1002. doi: 10.1007/s00216-009-3360-1. [DOI] [PMC free article] [PubMed] [Google Scholar]
- 4.Alivisatos P. Nature Biotechnology. 2004;22:47–52. doi: 10.1038/nbt927. [DOI] [PubMed] [Google Scholar]
- 5.Michalet X, Pinaud FF, Bentolila LA, Tsay JM, Doose S, Li JJ, Sundaresan G, WAM, Gambhir SS, Weiss S. Science. 2005;307:538–544. doi: 10.1126/science.1104274. [DOI] [PMC free article] [PubMed] [Google Scholar]
- 6.Gao X, Cui Y, LRM, Chung LWK, Nie S. Nature Biotechnology. 2004;22:969–976. doi: 10.1038/nbt994. [DOI] [PubMed] [Google Scholar]
- 7.Gao X, Yang L, Petron JA, Marshall FF, Simons JW, Nie S. Current Opinion in Biotechnology. 2005;16:63–72. doi: 10.1016/j.copbio.2004.11.003. [DOI] [PubMed] [Google Scholar]
- 8.Zorn G, Dave SR, Gao X, Castner DG. Analytical Chemistry. 2011;83:866–873. doi: 10.1021/ac102516n. [DOI] [PMC free article] [PubMed] [Google Scholar]
- 9.Morris-Cohen AJ, Malicki M, Peterson MD, Slavin JWJ, Weiss EA. Chemistry of Materials. 2013;25:1155–1165. [Google Scholar]
- 10.Hennig A, Dietrich PM, Hemmann F, Thiele T, Borcherding H, Hoffmann A, Schedler U, Jager C, Resch-Genger U, Unger WES. Analyst. 2015;140:1804–1808. doi: 10.1039/c4an02248c. [DOI] [PubMed] [Google Scholar]
- 11.Smith AM, Nie SM. Analyst. 2004;129:672–677. doi: 10.1039/b404498n. [DOI] [PubMed] [Google Scholar]
- 12.Medintz IL, Uyeda HT, Goldman ER, Mattoussi H. Nature Materials. 2005;4:435–466. doi: 10.1038/nmat1390. [DOI] [PubMed] [Google Scholar]
- 13.Parak WJ, Garison D, Pellegrino T, Zanchet D. Nanotechnology. 2003;14:R15–R27. [Google Scholar]
- 14.Hines MA, Guyot-Sionnest P. Journal of Physical Chemistry. 1996;100:468–471. [Google Scholar]
- 15.Smith AM, Dave S, Nie S, True L, Gao X. Expert Review of Molecular Diagnostics. 2006;6:231–244. doi: 10.1586/14737159.6.2.231. [DOI] [PubMed] [Google Scholar]
- 16.Garison D, Pinaud FF, Williams SC, Parak WJ, Zanchet D, Weiss S, Alivisatos AP. Journal of Physical Chemistry B. 2001;105:8861–8871. [Google Scholar]
- 17.Selvan ST, Tan TT, Ying JY. Advanced Materials. 2005;17:1620–1625. [Google Scholar]
- 18.Uyeda HT, Medintz IL, Jaiswal JK, Simons SM, Mattoussi H. Journal of the Amrican Chemical Society. 2005;127:3870–3878. doi: 10.1021/ja044031w. [DOI] [PubMed] [Google Scholar]
- 19.Liu W, Choi HS, Zimmer JP, Tanaka E, Frangioni JV, Bawendi MG. Journal of the Amrican Chemical Society. 2007;129:14530–14531. doi: 10.1021/ja073790m. [DOI] [PMC free article] [PubMed] [Google Scholar]
- 20.Choi HS, Liu W, Misra P, Tanaka E, Zimmer JP, Ipe BI, Bawendi MG, Frangioni JV. Nature Biotechnology. 2007;25:1165–1170. doi: 10.1038/nbt1340. [DOI] [PMC free article] [PubMed] [Google Scholar]
- 21.Rhyner MN, Smith AM, Gao X, Mao H, Yang L, Nie S. Nanomedicine. 2006;1:209–217. doi: 10.2217/17435889.1.2.209. [DOI] [PubMed] [Google Scholar]
- 22.Yu WW, Chang E, Falkner JC, Zhang J, Al-Somali AM, Sayes CM, Johns J, Drezek R, Colvin VL. Journal of the Amrican Chemical Society. 2007;129:2871–2879. doi: 10.1021/ja067184n. [DOI] [PubMed] [Google Scholar]
- 23.Zrazhevskiy P, Dave SR, Gao X. Particle & Particle Systems Characterization. 2014;31:1291–1299. doi: 10.1002/ppsc.201400184. [DOI] [PMC free article] [PubMed] [Google Scholar]
- 24.Rogach AL, Nagesha D, Ostrander JW, Giersig M, Kotov NA. Chemistry of Materials. 2000;12:2676–2685. [Google Scholar]
- 25.Liu W, Howarth M, Greytak AB, Zheng Y, Nocera DG, Ting AY, Bawendi MG. Journal of American Chemical Society. 2008;130:1274–1284. doi: 10.1021/ja076069p. [DOI] [PMC free article] [PubMed] [Google Scholar]
- 26.Dubertret B, Skourides P, Norris DJ, Noireaux V, Brivanlou AH, Libchaber A. Science. 2002;298(5599):1759–1762. doi: 10.1126/science.1077194. [DOI] [PubMed] [Google Scholar]
- 27.Kirchner C, Liedl T, Kudera S. Nano letters. 2005;5:331–338. doi: 10.1021/nl047996m. [DOI] [PubMed] [Google Scholar]
- 28.Wu X, Liu H, Liu J, Haley KN, Treadway JA, Peter Larson JPJ, Ge N, Peale F, Bruchez MP. Nature Biotechnology. 2002;21:41–46. doi: 10.1038/nbt764. [DOI] [PubMed] [Google Scholar]
- 29.Pellegrino T, Manna L, Kudera S, Liedl T, Koktysh D, Rogach AL, Keller S, Radler J, Natile G, Parak WJ. Nano letters. 2004;4:703–707. [Google Scholar]
- 30.Rosenthal SJ, McBride J, Pennycook SJ, Feldman LC. Surface Science Reports. 2007;62:111–157. doi: 10.1016/j.surfrep.2007.02.001. [DOI] [PMC free article] [PubMed] [Google Scholar]
- 31.Dietrich PM, Hennig A, Holzweber M, Thiele T, Borcherding H, Lippitz A, Schedler U, Resch-Genger U, Unger WES. Journal of Phyiscal Chemistry C. 2014;118:20393–20404. [Google Scholar]
- 32.Gross E, Somorjai GA. Journal of Catalysis. 2015;328:91–101. [Google Scholar]
- 33.Shard AG. Journal of Physical Chemistry C. 2012;116:16806–16813. [Google Scholar]
- 34.Techane S, Baer DR, Castner DG. Analytical Chemistry. 2011;83:6704–6712. doi: 10.1021/ac201175a. [DOI] [PMC free article] [PubMed] [Google Scholar]
- 35.Torelli MD, Putans RA, Tan Y, Lohse SE, Murphy CJ, Hamers RJ. ACS Applied Materials and Interfaces. 2015;7:1720–1725. doi: 10.1021/am507300x. [DOI] [PubMed] [Google Scholar]
- 36.Chudzicki M, Werner WSM, Shard AG, Wang Y-C, Castner DG, Powell CJ. Journal of Phyiscal Chemistry C. 2015. in press. [DOI] [PMC free article] [PubMed] [Google Scholar]
- 37.Frydman A, Castner DG, Schmal M, Campbell CT. Journal of Catalysis. 1995;157:133–144. [Google Scholar]
- 38.Werner SMW, Chudzicki M, Smekal W, Powell JC. Applied Physics Letters. 2014 [Google Scholar]
- 39.Bell ND, Minelli C, Shard AG. Analytical Methods. 2013;5:4591–4601. [Google Scholar]
- 40.Krier JM, Michalak WD, Baker LR, An K, Komvopoulos K, Somorjai GA. The Journal of Physical Chemistry C. 2012;116:17540–17546. [Google Scholar]
- 41.Li JJ, Wang A, Guo W, Keay JC, Mishima TD, Johnson MB, Peng X. Journal of American Chemical Society. 2003;125:12567–12575. doi: 10.1021/ja0363563. [DOI] [PubMed] [Google Scholar]
- 42.Talapin DV, Mekis I, Gotzinger S, Kornowski A, Benson O, Weller H. Journal of Physical Chemistry B. 2004;108:18826–18831. [Google Scholar]
- 43.Morris-Cohen AJ, Donakowski MD, Knowles KE, Weiss EA. Journal of Physical Chemistry C. 2010;114:897–906. doi: 10.1021/jp102101f. [DOI] [PubMed] [Google Scholar]
- 44.Yu WW, Qu L, Guo W, Peng X. Chemistry of Materials. 2003;15:2854–2860. [Google Scholar]
- 45.Gunter PLJ, Gijzeman OLJ, Niemantsverdriet JW. Applied Surfece Science. 1997;115:342–346. [Google Scholar]
- 46.Ratner BD, Castner DG. Electron Spectroscopy for Chemical Analysis. In: Vickerman JC, Gilmore IS, editors. Surface Analysis The Principle Techniques. Wiley; New York: 2009. p. 47. [Google Scholar]
- 47.Laibinis PE, Bain CD, Whitesides GM. Journal of Physical Chemistry. 1991;95:7017–7021. [Google Scholar]
- 48.Himmelhaus M, Eisert F, Buck M, Grunze M. J Phys Chem B. 2000;104:576–584. [Google Scholar]
- 49.Bellamy LD. Lowe & Brydone. Thetford; Norfolk: 1975. [Google Scholar]
- 50.Shen YR. The Principles of Nonlinear Optics. John Wiley \& Sons; New York: 1984. [Google Scholar]
- 51.Shen YR. Annual Review of Physical Chemistry. 1989;40:327–351. doi: 10.1146/annurev.pc.40.100189.000245. [DOI] [PubMed] [Google Scholar]
- 52.Love JCE, Lara A, Kriebel Jennah K, Nuzzo Ralph G, Whitesides George M. Chemical Review. 2005;105:1103–1169. doi: 10.1021/cr0300789. [DOI] [PubMed] [Google Scholar]
- 53.Hill HD, Millstone JE, Banholzer MJ, Mirkin CA. ACS Nano. 2009;3:418–424. doi: 10.1021/nn800726e. [DOI] [PMC free article] [PubMed] [Google Scholar]
- 54.Weeraman C, Yatawara AK, Bordenyuk AN, Benderskii AV. Journal of American Chemical Society. 2006;128:14244–14245. doi: 10.1021/ja065756y. [DOI] [PubMed] [Google Scholar]
- 55.Young AG, Al-Salim N, Green DP, McQuillan AJ. Langmuir. 2008;24:3841–3849. doi: 10.1021/la703655v. [DOI] [PubMed] [Google Scholar]
- 56.Koh SE, McDonald KD, Holt DH, Dulcey CS. Langmuir. 2006;22:6249–6255. doi: 10.1021/la052379e. [DOI] [PubMed] [Google Scholar]


