 Kavain, an extract from the shrub Piper methysticum, was recently reported to modulate TNF-α expression in both human and mouse cells via regulation of LPS-Induced TNF-Alpha Factor (LITAF).
Abstract
Kavain, an extract from the shrub Piper methysticum, was recently reported to modulate TNF-α expression in both human and mouse cells via regulation of LPS-Induced TNF-Alpha Factor (LITAF). The purpose of the present study was to define the molecular pathway(s) associated with Kavain′s effects on TNF modulation. In vitro studies using WT mouse primary macrophages showed that Kavain significantly reduced E. coli LPS-induced TNF-α production but this effect was almost abrogated in LITAF–/– and ERK2–/– cells. Therefore we reintroduced the ERK2 gene in ERK2–/– cells and partially restored E. coli LPS-induced LITAF-mediated TNF-α production. The translocation of LITAF into to nucleus was found to be dependent on ERK2 S206 residue. Kavain inhibits LITAF/TNF-α expression via dephosphorylation of ERK2 in response to E. coli LPS. Finally, in vivo, Kavain had a significant anti-inflammatory effect on wild type mice that developed Collagen Antibody Induced Arthritis (CAIA), but only a minor effect in ERK2–/– mice also affected by CAIA. Based on these findings, we concluded that ERK2 may be the kinase upstream for LITAF being a crucial factor for Kavain-mediated regulation of LPS-induced TNF-α.
Introduction
TNF-α is a pleiotropic cytokine originally identified as an endogenous factor induced by inflammatory stimuli. It has been shown that TNF-α is a multifaceted cytokine exhibiting pleotropic effects both beneficial and detrimental to several organs and systems; this feature requires rigorous control of its expression, thus highlighting its importance.1–5 The regulation of TNF-α gene expression in cells of monocytic lineage is complex and stimulus-dependent, involving controls at the transcriptional level.6–8 However, the relative contribution of these regulatory elements is poorly understood.
The production and secretion of TNF-α 9 is induced by E. coli Lipopolysaccharide (LPS), a potent stimulator of monocytes and macrophages. The effects of E. coli LPS on transcription factor activity and expression have been widely investigated.10 We cloned E. coli LPS Induced TNF-Alpha Factor (LITAF),11 and showed that it partially controls TNF-α gene expression.12,13 Searching for inhibitors to LITAF signaling, a potential route to a novel class of oral TNF-α modulators, we found that Kavain inhibited TNF-α secretion in cells via suppression of LITAF.14
Kavain has been known for its therapeutic properties for several decades.15,16 Because Kavain is used as a treatment for inflammatory diseases,14,17–19 its anti-inflammatory action has been widely studied:20–22 Kavain was found to affect TNF-α transcriptional regulation23 although the molecular basis for that regulation remains unclear.
It is known that mitogen-activated protein kinases (MAPKs) play a key role in the intracellular transmission of a variety of extracellular signals which are the extracellular signal-regulated kinases (ERKs). ERKs are the product of two distinct genes: ERK1 (MAPK3) and ERK2 (MAPK1).24 TNF-α-dependent promoter activity is abolished by the treatment of cells with MAPK inhibitors.25
Our kinase array data pointed at ERK2 as a potential kinase involved in Kavain effects. In this paper, we found that in response to E. coli LPS, Kavain inhibits LITAF/TNF-α expression via dephosphorylaion of ERK2. ERK2, rather than ERK1, is the upstream kinase of LITAF and the ERK2 serine S206 is the key serine for the regulation of LPS-induced TNF-α.
Materials and methods
Animals and cells
Under strict SPF conditions, we maintained three groups of 8–12-week old mice: wild-type (WT, C57BL/6 Jackson labs), an ERK2 mutant (ERK–/–, stock no. 019112 Jackson labs), and our mLITAF conditional knockout mice.13 RAW 264.7 cells (TIB 71, ATCC), THP-1 cells (TIB-202, ATCC), and mice peritoneal macrophages were cultured in RPMI-1640 media (Cat#: 11875–093, Life Technologies, NY) with 10% FBS at 37 °C in 5% CO2 atmosphere. All experiments were approved by the Boston University Institutional Animal Care and Use Committee and were performed in compliance with the relevant animal care and use laws and institutional guidelines.
DNA constructs
A full-length mouse ERK2 gene (aa 1–358, Open Biosystems) was subcloned into pcDNA3HA26 (named ERK2wt). The primer pairs used for 1st and 2nd PCR of the ERK2 mutant DNA fragments are shown in Table 1. The mutant DNA fragments generated by both PCRs were purified, diluted to 1 ng ml–1, and used for a 3rd PCR with the primer pair 5′-ggctgtgcagccaacatggcg-3′ and 5′-ttaagatctgtatcctggctg-3′. Each resulting DNA fragment with both start and end codons was sub-cloned into pcDNA3HA. All cloned DNAs were confirmed by DNA sequencing and the relationship between them was analyzed by VisANT.24
Table 1. The primer pairs used for PCR of ERK2 DNA constructs.
| Name of construction | Primer pairs for ERK2 mutant fragments |
||
| PCR | Forward primer | Reverse primer | |
| ERK27M | 1st | 5′-ggctgtgcagccaacatggcg-3′ | 5′-gctcaaaagggaggttggtgtagcgc-3′ |
| 2nd | 5′-ccttttgagcaccagaccta-3′ | 5′-ttaagatctgtatcctggctg-3′ | |
| ERK120M | 1st | 5′-ggctgtgcagccaacatggcg-3′ | 5′-gaacgttagcgaggtgctgtgtcttc-3′ |
| 2nd | 5′-gctaacgttctgcaccgtgac-3′ | 5′-ttaagatctgtatcctggctg-3′ | |
| ERK151M | 1st | 5′-ggctgtgcagccaacatggcg-3′ | 5′-tataacccttaggcttgaggtcacgg-3′ |
| 2nd | 5′-aagggttataccaagtccatt-3′ | 5′-ttaagatctgtatcctggctg-3′ | |
| ERK206M | 1st | 5′-ggctgtgcagccaacatggcg-3′ | 5′-taggcctgttcttggtataacccttg-3′ |
| 2nd | 5′-aacaggcctatcttcccagga-3′ | 5′-ttaagatctgtatcctggctg-3′ | |
| ERK206P | 1st | 5′-ggctgtgcagccaacatggcg-3′ | 5′-aaatatcaatgggcttggtataaccc-3′ |
| 2nd | 5′-gggttataccaagcccattgatattt-3′ | 5′-ttaagatctgtatcctggctg-3′ | |
| ERK211P | 1st | 5′-ggctgtgcagccaacatggcg-3′ | 5′-ggatgcagcccacaggccaaatatca-3′ |
| 2nd | 5′-tgatatttggcctgtgggctgcatcc-3′ | 5′-ttaagatctgtatcctggctg-3′ | |
| ERK221P | 1st | 5′-ggctgtgcagccaacatggcg-3′ | 5′-agataggcctgttgggtagcatctct-3′ |
| 2nd | 5′-agagatgctacccaacaggcctatct-3′ | 5′-ttaagatctgtatcctggctg-3′ | |
| ERK244M | 1st | 5′-ggctgtgcagccaacatggcg-3′ | 5′-tgtgcgggagtccaagaatacccagg-3′ |
| 2nd | 5′-ctcccgcacaaaaataaggtg-3′ | 5′-ttaagatctgtatcctggctg-3′ | |
| ERK282M | 1st | 5′-ggctgtgcagccaacatggcg-3′ | 5′-tgggctcatcgtcagcatttgggaac-3′ |
| 2nd | 5′-gatgagcccattgctgaagcg-3′ | 5′-ttaagatctgtatcctggctg-3′ | |
| ERK357M | 1st | 5′-ggctgtgcagccaacatggcg-3′ | 5′-ttatctgtatcctggctggaa-3′ |
Recombinant lentivirus
For the positive control DNA, we used an ERK2wt DNA fragment amplified by PCR with the primer pair 5′-ggctgtgcagccaacatggcg-3′ and 5′-ttaagatctgtatcctggctg-3′. For mutation DNA, we generated a front DNA segment without mutation by amplifying ERK2wt DNA using 5′-ggctgtgcagccaacatggcg-3′ and 5′-aaatatcaatgggcttggtataaccc-3′, and we generated a DNA segment with a point mutation, S206P, by amplifying ERK2wt DNA using 5′-gggttataccaagcccattgatattt-3′ and 5′-ttaagatctgtatcctggctg-3′. These two DNA fragments were recovered, diluted to 1 ng ml–1, mixed, and then amplified again by PCR with primer pair 5′-ggctgtgcagccaacatggcg-3′ and 5′-ttaagatctgtatcctggctg-3′. Finally, the mutant (ERK206P) DNA fragment was inserted into plenti7.3/V5-TOPO vector (Cat#: K5325-20, Invitrogen) and named lenP. The positive control (ERK3wt) DNA was inserted into plenti7.3/V5-TOPO vector and named len2. Both len2 and lenP plus Lentiviral backbone DNA (plenti7.3, as the negative control, named ct7.3) were purified and used for lentivirus packaging. The pre-cultured 293FT cells at ≥90% confluence were co-transfected by Lipofectamine 2000 (Invitrogen) with DNA of Len2, LenP, or ct7.3 plus ViraPower Packaging Mix (Invitrogen). They were cultured at 37 °C, 5% CO2, for 5–7 days. The viral particles were harvested and suspended in an appropriate volume of DMEM. The titer (1 × 10⁸ pfu) of viral particles was measured following manufacturer's instructions.
ELISA
WT and ERK2-mutant mice were injected intravenously with antibodies, E. coli LPS, and/or Kavain for 10 days. The conditioned media from mouse macrophages and the serum from treated mice were subjected to ELISA for the detection of TNF-α concentration with an Invitrogen kit (Cat#: KMC30110). ELISA immunoreactivity was quantified using a microplate reader (Model 680, Bio-Rad). Data were analyzed and then graphed.
Western blotting
Cells were harvested and proteins from the whole cell and from the nuclei were fractionally purified. Nuclear proteins were purified by scraping treated and untreated cells, and pellets were on ice for 15 min and in the presence of 25 μL 1% Nonidet P-40. They were re-suspended in 400 μL of cold buffer A (10 mM Hepes, pH 7.9/10 mM KCl/0.1 mM EDTA/0.1 mM EGTA/1 mM DTT/0.5 mM phenylmethylsulfonyl fluoride/1 μg ml–1 pepstatin A/10 μg ml–1 leupeptin/10 μg ml–1 aprotinin). Samples were vortexed and centrifuged for 1 min at 10 000g, and the pellets were again suspended with 100 μL of buffer B (20 mM Hepes, pH 7.9/400 mM NaCl/1 mM EDTA/1 mM EGTA/1 mM DTT/0.5 mM phenylmethylsulfonyl fluoride/1 μg ml–1 pepstatin A/10 μg ml–1 leupeptin/10 μg ml–1 aprotinin). After shaking the samples on a rocker platform for 15 min at 4 °C, they were centrifuged at 4 °C for another 15 min at 10 000g. Cell lysates from whole cells or nuclei (60 μg total proteins per lane) were applied to SDS polyacrylamide gels, and proteins were detected by WB. The following antibodies were directed against p-ERK2 (sc-16981): LITAF (sc-66945), GAPDH (sc-365062), actin (sc-1615), all from Santa Cruz Biotechnology, or tubulin (T6199, Sigma).
Inhibitors
Kavain (Cat#500-64-1, AvaChem Scientific), E-64 (inhibition of cysteine protease, Cat# E3132, Sigma), PMSF (inhibition of serine protease, Cat# P7626, Sigma), and MNS (inhibition of cysteine protease and tyrosine kinase, Cat# S4921, Selleckchem) were dissolved in 1% DMSO just before use.
Collagen antibody induced arthritis (CAIA)
WT mice (LITAF+/+) and ERK2-mutant mice (ERK2–/–) were injected intraperitoneally with 1. ArthritoMab (Cat# CIA-MAB-2C, MD Bioproducts) twice on day-1 (7 mg per mouse) and day-5 (4 mg per mouse); 2. E. coli LPS (100 μg per mouse) every three days; and 3. Kavain (1–1.2 mg per mouse) every other day10,27 in a 10-day experimental protocol. Arthritis was monitored using a clinical score and later by histological analysis of hind dorsal paws.
Statistical analysis
All experiments were performed in triplicate and statistical analyses were conducted with the SAS software package. All data were normally distributed. For multiple mean comparisons, we conducted analysis of variance (ANOVA), while we used the Student's t-test for single mean comparison. For time-course study, we used a two-way repeated measure ANOVA. P values less than 0.05 were considered significant.
Results
Kavain effects on E. coli LPS-induced TNF-α
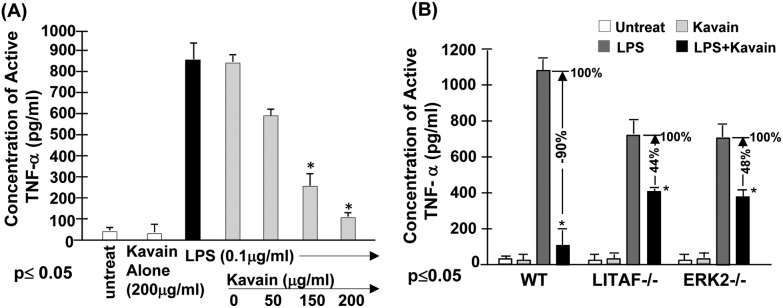
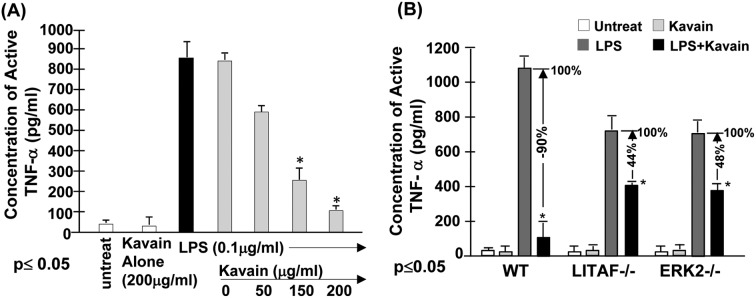
Our previous data indicates that the treatment of cells with Kavain inhibits E. coli LPS-induced TNF-α.14 To fully map the signal transduction pathway associated with Kavain inhibition of LPS-induced TNF-α we used a kinase array. We found that Kavain affects ERK1/2, prompting us to further investigate the role of ERK in Kavain's inhibitory effects on E. coli LPS-induced LITAF/TNF. To address this issue, primary macrophages from WT mice were untreated as control or treated with 0.1 μg ml–1E. coli LPS and then exposed to different concentrations of Kavain. The supernatants from each test group were assessed for TNF-α production. As shown in Fig. 1A, there was an inverse relationship between Kavain concentrations and E. coli LPS-induced TNF-α secretion. We then tested whether Kavain reduces TNF-α via ERK2 and LITAF. Primary macrophages from WT, LITAF–/–, and ERK2–/– mice were treated with Kavain, E. coli LPS, or both, and some were left untreated. Supernatants from each test group were assessed for TNF-α production. Kavain treatment exposure decreased E. coli LPS-induced TNF-α secretion by 90% in WT cells, 48% in ERK2–/– cells, and only 44% in LITAF–/– cells (Fig. 1B). This suggests a role of ERK2 or LITAF in Kavain inhibition of LPS-induced TNF-α expression.
Fig. 1. Effects of Kavain on ERK2/LITAF/TNF-α. To examine whether Kava acts to reduce LPS-induced TNF-α secretion in cells, (A) WT mouse primary macrophages were untreated as the control or treated with 200 μg ml–1 Kavain alone as negative control (white bar), or with 0.1 μg ml–1E. coli LPS alone (black bar) as positive control, or co-treated with 0.1 μg ml–1E. coli LPS plus 0, 50, 150, or 200 μg ml–1 Kavain (gray bars). The cells were continuously cultured for 8 h and then their supernatants were collected and used for assessment of TNF-α production with triplicate ELISAs. Data were analyzed and then graphed. (B) Mouse primary Macrophages from WT, LITAF conditional knockout (macLITAF–/–), or ERK2 mutant (ERK–/–) mice were untreated (the white bars), treated with 200 μg ml–1 Kavain alone (the light grey bars) as the negative control, 0.1 μg ml–1E. coli LPS (the dark grey bars, assigned a value of 100% as the baseline) as the positive control, or co-treated with 0.1 μg ml–1 LPS and 200 μg ml–1 Kavain (the black bars, the actual value is calculated relative to the baseline) as the test group for 8 h. The conditioned media from each treated cells were used for assessment of TNF-α production with triplicate ELISAs. Data were analyzed and then graphed.
ERK2: the upstream kinase of LITAF
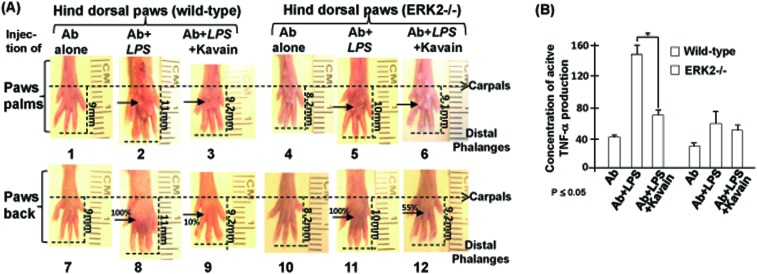
Our previous in vivo data10 indicated that LITAF-deficient mice exhibited significantly less inflammation compared to WT mice in a CAIA mouse model. Now, we found that Kavain treatment inhibits E. coli LPS-induced TNF-α via ERK2 (Fig. 1). For confirmation, we evaluated CAIA in live WT and ERK2–/– mice. E. coli LPS alone induced abnormal swelling in WT and ERK2–/– mice paws (Fig. 2A, no. 2 & 8, 5 & 11). With the addition of Kavain, the swelling was reduced by about 10% in the WT mice paws (no. 3 & 9) and by about 55% in ERK2–/– mice paws (no. 6 & 12). ELISA analysis of serum from these mice (Fig. 2B) showed that, E. coli LPS-induced TNF-α production was significantly reduced by Kavain treatment in the serum of WT mice, however, in the absence of ERK2, E. coli LPS-induced TNF-α production was minimally affected by Kavain, compared to control. This suggests that Kavain reduces E. coli LPS-induced TNF-α via ERK2 in the CAIA mouse model.
Fig. 2. Analysis of CAIA in the absence of ERK2. (A) WT or ERK2 mutant mice were injected with the antibody alone as the negative control, antibody plus E. coli LPS as the positive control, or antibody plus E. coli LPS and Kavain as the test groups. Arthritis was monitored after injection and histological effects of hind paws were analyzed after treatments. Images of the paw palm (no. 1, 2, 3, 4, 5, or 6) or paw back (no.7, 8, 9, 10, 11, or 12) as a reference group were taken from a hind paw of each mouse (either control or treated mouse). Swelling of the area on the paws was indicated with arrows. Swelling on the paws induced by E. coli LPS alone (no. 2 & 8 or 5 & 11) was assigned a value of 100% as the baseline for WT or ERK2–/– group); the actual value of others is calculated relative to the baseline. (B) Serum from mice treated above was used for assessment of TNF-α production with triplicate ELISAs. Data were analyzed and then graphed. All assays were triplicated. Mean SEM.
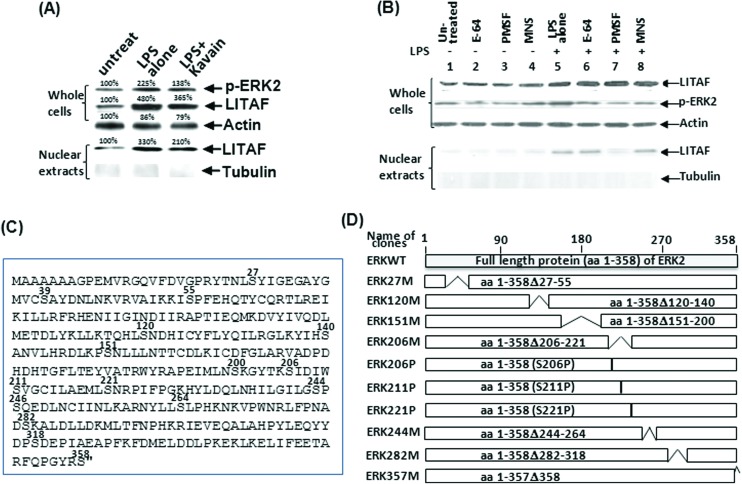
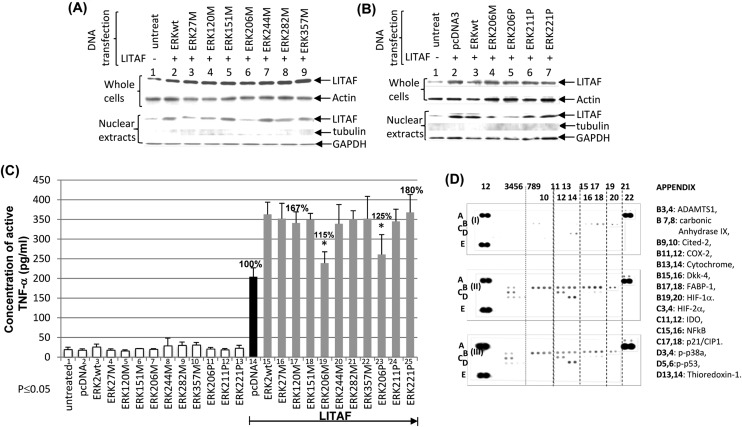
Our previous data reported that LITAF regulation depends on the magnitude of its translocation in cell nuclei.13 To identify whether ERK2 affects LITAF regulation and their role in the signal transduction pathway, a WB analysis was performed. As shown in Fig. 3A, the dephosphorylation of ERK2 by Kavain inhibits LITAF translocation in the nucleus of E. coli LPS-treated WT macrophages. Moreover, inhibitors of ERK2 (E-64, PMSF, MNS) were used to identify the upstream factor and examine the potential association between ERK2 and LITAF. Compared to the positive control (Fig. 3B, lane 5), all inhibitors partially reduced ERK2 phosphorylation in E. coli LPS-treated cells but did not affect E. coli LPS-induced LITAF expression (lanes 6–8). However, PMSF significantly inhibited LITAF translocation in nuclei (lane 7), suggesting that ERK2 is an important kinase that activates LITAF as a downstream transcriptional factor in E. coli LPS-induced signaling pathway. As PMSF reacts with serine residues to inhibit protease/kinases, the serine residue in ERK2 was found to be crucial for the LITAF/TNF-α signaling pathway. To identify which serine among the 16 serine residues of ERK2 (Fig. 3C) is required for LITAF translocation, ERK2 serine DNA deletions (Fig. 3D) were constructed. As shown in Fig. 4A, Raw264.7 cells were co-transfected overnight with DNAs of LITAF and each ERK2 serine deletion. The extraction from whole cells or nuclei was assessed by WB analysis. Except for ERK206M (lane 6, lack of serine residues S206, S211, and S221), most ERK2 cloned DNAs transfected (lanes 2–5, 7–9) causing a clear translocation of LITAF protein in the nuclei when compared to the control (lane 1). Although slight variation of levels of LITAF nuclear translocation was observed, this was due to unequal loading of the total protein, as evidenced by GAPDH levels. To identify the key serine for the regulation of LITAF in response to E. coli LPS, we constructed a mutation of S206P, S211P or S221P (only one amino acid was altered) and analyzed them using WB. There was no significant translocation of LITAF in the nuclei (Fig. 4B) after transfection of ERK206P (lane 15) compared to the control (lane 11). We confirmed this data with ELISA analysis. Compared to the control in lane 14 (Fig. 4C), co-transfection of LITAF with most of the ERK2 DNA clones in WT cells increased TNF-α production for up to 167–180% (lanes 15–18, 20–22, 24, & 25). However, after co-transfection of LITAF with ERK206M (lane 19) and with ERK206P (lane 23), we only observed 115% and 125% increases respectively, suggesting that LITAF translocation is dependent on S206 – both ERK206M & ERK206P lack this amino acid. To investigate whether S206 affects other factors, THP-1 cells were co-transfected with ERK2wt (WT ERK2, filter II) and with ERK206P (filter III) and then assessed by a protein array. As shown in Fig. 4D, some factors induced by the overexpression of ERK2 (ERK2wt or ERK206P) were clearly observed, such as thioredoxin-1 (APPENDIX location: D13, 14, filter II/III), carbonic anhydrase IX (B7, 8, filter II/III), etc., compared to the control (filter I). However, no significant differences for these factors were found in a comparison of ERK2wt (filter II) and ERK206P (filter III). Our most recent qRT-PCR has also proved this point (data not shown).
Fig. 3. WB analysis after transfection of ERK2, LITAF, and mutations in cells. (A) Untreated WT mouse primary macrophages served as negative control, those treated with 0.1 μg ml–1E. coli LPS alone served as positive control, and those co-treated with 0.1 μg ml–1E. coli LPS plus 200 μg ml–1 Kavain were the test group. The cells were continuously cultured for 16 h. Extracts from whole cells or nuclei were separately purified and subjected to WB analysis with antibody against pERK2, LITAF, or actin/tubulin as control. (B) WT mouse primary macrophages were untreated as control (lane 1) or treated with 0.1 μg ml–1E. coli LPS (lane 5–8), 10 μM E-64 (lane 2 and 6), 250 μM PMSF (lane 3 and 7), or 20 μM MNS (lane 4 and 8). The cells were continuously cultured for 16 h. Extracts from whole cells or nuclei were separately purified and subjected to WB analysis with antibody against pERK2, LITAF, or actin/tubulin as control. (C) Diagram of ERK2 amino acid sequences; serine (S) was indicated with position superscript. (D) Different lengths of ERK2 cDNA were truncated or mutated by PCR, and then inserted into pcDNA3HA vector. Gray box: full length of ERK2. White boxes: deletions or mutations. The amino acid region of cloned DNA representing serine mutation (either deleted or mutated) was shown in the boxes. Serine deletions/mutations were confirmed by sequencing.
Fig. 4. WB/ELISA analysis of serine mutation of ERK2. To examine the effect of serine on LITAF regulation, western blot was performed (A & B). RAW 264.7 cells were untreated (lanes 1 & 11) as the control or co-transfected with LITAF and ERK2 cloned DNAs (lanes 2–9, 12–17). Cell extractions from whole cells or nuclei of either control or test groups were separately purified and subjected to Western blot analysis with antibody against LITAF, compared to Actin, tubulin, or GAPDH as the control. Triplicate assays above were conducted. Mean SEM. To further identify which serine is involved in TNF-α secretion via LITAF, ELISA analysis was performed (C). Pre-cultured Raw264.7 cells were untreated as the control (lane 1) or transfected with 0.5 μg ml–1 of ERKwt (lanes 3 & 15), ERKw27M (lanes 4 & 16), ERK120M (lanes 5 & 17), ERK151M (lanes 6 & 18), ERK206M (lanes 7 & 19), ERK244M (lanes 8 & 20), ERK282M (lanes 9 & 21), ERK357M (lanes 10 & 22), ERK206P (lanes 11 & 23), ERK211P (lanes 12 & 24), ERK221P (lanes 13 & 25), or pcDNA3 (lanes 2 & 14) as control. 0.5 μg ml–1 LITAF was simultaneously transfected (lanes 14–25) for 16 h. The supernatants were collected from each test group and used for assessment of TNF-α production with triplicate ELISAs. To detect whether other factors or kinases are affected in the absence of S206 of ERK, a protein array was performed (D). The matured THP-1 cells were co-transfected with 0.5 μg ml–1 LITAF DNA plus 0.5 μg ml–1 of pcDNA3 (filter I) as the control or ERK2WT (filter II) or ERK206P (filter III) for 48 h. The protein from each treated cell was purified and used for protein array assay by a Human Cell Stress Array Kit (R & D Systems ARY018) following manufacturer's instruction.
S206: key serine for the regulation of LPS-induced TNF-α
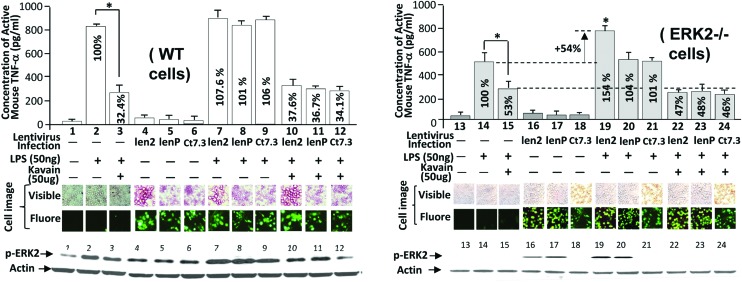
We infected WT mice macrophages with the lentiviral len2 (WT ERK2), lenP (S206P of ERK2), and ct7.3 (blank control) to further determine whether E. coli LPS-induced TNF-α production via the ERK2 serine residue, S206. As shown in Fig. 5, lentiviral infection with either len2 (no. 7) or lenP (no. 8) in WT cells did not significantly enhance LPS-induced TNF-α production compared to the control (no. 2). However, infection of len2, namely restoration of the ERK2 gene in ERK2–/– cells, significantly increased LPS-induced TNF-α production by 154% (no. 19) compared to the control (no. 14). Moreover, this increase in the absence of S206 due to transfection of lenP was not reflected (no. 20). It suggests that S206 of ERK2 is involved in LITAF-mediated TNF-α production in response to E. coli LPS. Kavain also significantly reduced E. coli LPS-induced TNF-α production to a similar level among different cells: 53% in ERK2–/– cells (no. 15), 47% in ERK2–/– cells restored with WT ERK2 gene (no. 22), and 48% in ERK2–/– cells restored with ERK2 lacking S206 residue (no. 23). This suggests that S206 may not be related to Kavain-reduced TNF-α production. The observation above was further confirmed by the fluorescent microscopy and WB analysis (Fig. 5).
Fig. 5. Analysis of TNF-α production after infection of viral particles in E. coli LPS/Kavain-treated cells. Untreated macrophages from WT (o. 1–12) or ERK2–/– mice (no. 13–24) were analyzed by ELISA. Cells were infected with viral particles (MOI = 2) of len2 (no. 4, 7, 10, 16, 19, or 22), lenP (no. 5, 8, 11, 17, 20, or 23), or ct7.3 as control (no. 6, 9, 12, 18, 21, or 24). Cells were incubated for 37 °C, 5% CO2 for 3 days and then co-treated with 50 ng ml–1 of E. coli LPS (no. 2, 3, 7–12, 14, 15, and 19–24) plus 50 μg ml–1 of Kavain (no. 3, 10–12, 15, and 22–24) for 5 h. Their cultured media were used for ELISA (n = 3) and graphed. The cells (WT or ERK2–/– cells) treated with E. coli LPS alone (no. 2 for WT cells or No. 14 for ERK2–/–) were assigned a value of 100% (baseline) and the actual value of others were calculated relative to each baseline. The lysate from macrophages were detected by WB with antibodies against p-ERK2 and actin. The result was attached at the bottom of the figures. Data are presented as mean ± SEM. The phase contrast panels (visible and fluorescent) were the pair of cells. The treated cells were exposed to visible light and to fluorescent light using an Olympus BX40 microscope at 1000× magnification. The GFP-induced fluorescent signal in mice macrophages was observed. The images were taken with a MicroFIRE camera under uniform exposure time: 30 ms for visible light and 1 s for fluorescent light. The data analysis was processed by the program Image-Pro plus 5.0. Multiple tests were done with similar results.
Discussion
The present study attempted to define the molecular mechanisms associated with Kavain′s inhibitory effects on TNF-α. We show that in vitro Kavain significantly inhibits E. coli LPS-induced TNF-α production in WT mouse primary macrophage cells and this inhibition is less effective in LITAF–/– and ERK2–/– cells. In vivo, Kavain has a significant effect on wild-type mice that developed CAIA, but only a minor effect in ERK2–/– mice also affected by CAIA, advocating for an important role of ERK2 in this process.
Our data indicates that: In vitro, E. coli LPS induced TNF-α production via kinases in ERK1 & 2, and protein array showed that ERK2 is more regulated by Kavain than ERK1 (data not shown). Thus, we focus on ERK2 as a key kinase in this paper. Furthermore, ERK2 is the kinase upstream of LITAF, with its S206 amino acid residue involved in LITAF nuclear translocation.
The restoration of ERK2 gene in ERK2–/– cells improves E. coli LPS-induced TNF-α production. Our data also indicates that: Kavain inhibits E. coli LPS-induced LITAF/TNF-α production via dephosphorylation of ERK2 in vitro in WT macrophage cells, and CAIA in vivo in WT mice. However, questions remain on ERK2's role in this signaling pathway. For example, the addition of Kavain to E. coli LPS-treated cells almost completely blocks E. coli LPS-induced TNF-α secretion in WT cells, but the same experiment does not yield nearly the same result in LITAF–/– cells (44%) or in ERK2–/– cells (48%). Consistent with a report published by Lidke et al.,28 our data shows that ERK translocation remained unchanged after LPS treatment of macrophages. This issue remains controversial, as Seger et al. reported that ERK can be translocated to the nucleus via interaction with another kinase, such as MEK.29 Further studies are warranted to clarify this issue. Furthermore the mechanism associated with a reduced Kavain effect in the absence of ERK remains unknown. Further investigation of the Kavain chemical structure is warranted in order to comprehensibly answer this question. In addition, Michael D. Schaller indicated that serines 126 or 130, which also respond to LPS stimulation, play an important role in cytoskeletal rearrangement.30 Our preliminary data does not show serine 206 is required for this cytoskeletal rearrangement (data not shown).
Folmer et al. indicated that NF-κB is inhibited by Kavain treatment in cells.31 However, we found that the overexpression of ERK2 does not affect NF-κB expression (Fig. 4D, C15 & 16, filter II & III). Thus, we hypothesize that the inhibition of E. coli LPS-induced TNF-α by Kavain, in the absence of LITAF or ERK2, may be associated with other kinases/factors including NF-κB. If true, these potential associations need to be experimentally identified. For example, Turne et al. indicated that mast cell activation may be a mechanistic component of Kavain-mediated inflammation.32 Mast cells are also used to study various inflammations and their related diseases, such as wound healing or urticarias.33 However, it is unclear whether Kavain is involved in the same signal transduction pathway (LPS-induced ERK/LITAF/TNF) in mast cell as it is in macrophages. Further investigation of this issue may be necessary. Most publications qualitatively document the swelling at mouse paws through radiographs of the inter-phalangeal joints or by histological exam34–36 but little or no quantitative analysis. Here, we present a semi-quantitative method allowing us to compare levels of swelling at mouse paws after different treatments. As shown in Fig. 2A, the differential swelling between No. 9 and No. 8 (control) is visible to the naked eye. All mice used for CAIA were about the same age and weight, thus paw lengths were similar at the beginning of the experiment. After 10 days of E. coli LPS treatment, we found that the inter-phalangeal length – carpals to distal phalanges – of mice paws became longer as the swelling increased: the inter-phalangeal length of the treated WT paws is 11 mm (no. 8) vs. 9 mm (no. 7) in the controls. We observed different inter-phalangeal lengths (no. 9–12) with different degrees of swelling. Using this measurement method, we estimate that Kavain inhibited E. coli LPS-induced swelling to about 10% (no. 9) compared to the 100% in positive controls (no. 8).
Based on our findings, we believe that Kavain may be a valuable option to inhibit LITAF/TNF-α expression in the treatment of E. coli LPS-induced inflammatory disease. This new knowledge contributes to our understanding the mechanism of Kavain-mediated deactivation of LITAF via ERK2, leading to proinflammatory cytokine reduction and highlighting the importance of LITAF in the early response to E. coli LPS.
Acknowledgments
This work was supported by a grant from NIH/NIDCR R01 DE14079.
References
- Alexander H. R., Sheppard B. C., Jensen J. C., Langstein H. N., Buresh C. M., Venzon D. J. Clin. Invest. 1991;88(1):34–39. doi: 10.1172/JCI115298. [DOI] [PMC free article] [PubMed] [Google Scholar]
- Beutler B., Cerami A. Annu. Rev. Immunol. 1989;7:625–655. doi: 10.1146/annurev.iy.07.040189.003205. [DOI] [PubMed] [Google Scholar]
- Sugarman B. J., Aggarwal B. B., Hass P. E., Figari I. S., Palladino Jr. M. A., Shepard H. M. Science. 1985;230(4728):943–945. doi: 10.1126/science.3933111. [DOI] [PubMed] [Google Scholar]
- Talmadge J. E., Phillips H., Schneider M., Rowe T., Pennington R., Bowersox O. Cancer Res. 1988;48(3):544–550. [PubMed] [Google Scholar]
- Uglialoro A. M., Turbay D., Pesavento P. A., Delgado J. C., McKenzie F. E., Gribben J. G. Tissue Antigens. 1998;52(4):359–367. doi: 10.1111/j.1399-0039.1998.tb03056.x. [DOI] [PMC free article] [PubMed] [Google Scholar]
- Conn D. L. Arthritis Rheum. 2001;45(5):462–467. doi: 10.1002/1529-0131(200110)45:5<462::aid-art366>3.0.co;2-v. [DOI] [PubMed] [Google Scholar]
- Edwards 3rd C. K., Zhou T., Zhang J., Baker T. J., De M., Long R. E. J. Immunol. 1996;157(4):1758–1772. [PubMed] [Google Scholar]
- Jue D. M., Jeon K. I., Jeong J. Y. J. Korean Med. Sci. 1999;14(3):231–238. doi: 10.3346/jkms.1999.14.3.231. [DOI] [PMC free article] [PubMed] [Google Scholar]
- Marrack P., Kappler J. Nature. 1988;332(6167):840–843. doi: 10.1038/332840a0. [DOI] [PubMed] [Google Scholar]
- Merrill J. C., You J., Constable C., Leeman S. E., Amar S. Proc. Natl. Acad. Sci. U. S. A. 2011;108(52):21247–21252. doi: 10.1073/pnas.1111492108. [DOI] [PMC free article] [PubMed] [Google Scholar]
- Myokai F., Takashiba S., Lebo R., Amar S. Proc. Natl. Acad. Sci. U. S. A. 1999;96(8):4518–4523. doi: 10.1073/pnas.96.8.4518. [DOI] [PMC free article] [PubMed] [Google Scholar]
- Tang X., Fenton M. J., Amar S. Proc. Natl. Acad. Sci. U. S. A. 2003;100(7):4096–4101. doi: 10.1073/pnas.0630562100. [DOI] [PMC free article] [PubMed] [Google Scholar]
- Tang X., Metzger D., Leeman S., Amar S. Proc. Natl. Acad. Sci. U. S. A. 2006;103(37):13777–13782. doi: 10.1073/pnas.0605988103. [DOI] [PMC free article] [PubMed] [Google Scholar]
- Pollastri M. P., Whitty A., Merrill J. C., Tang X., Ashton T. D., Amar S. Chem. Biol. Drug Des. 2009;74(2):121–128. doi: 10.1111/j.1747-0285.2009.00838.x. [DOI] [PMC free article] [PubMed] [Google Scholar]
- National Toxicology Program, Toxicology and carcinogenesis studies of kava kava extract (CAS No. 9000–38-8) in F344/N rats and B6C3F1 mice (Gavage Studies), Natl. Toxicol. Program Tech. Rep. Ser., 2012, 571, 1–186.. [PubMed] [Google Scholar]
- Gardner D. M. J. Neuropsychiatry Clin. Neurosci. 2002;27(5):324–333. [PMC free article] [PubMed] [Google Scholar]
- Baker J. D. Soc. Stud. Sci. 2011;41(3):361–384. doi: 10.1177/0306312710395341. [DOI] [PubMed] [Google Scholar]
- Saad B., Azaizeh H., Abu-Hijleh G., Said O. Evidence-Based Complementary Altern. Med. 2006;3(4):433–439. doi: 10.1093/ecam/nel058. [DOI] [PMC free article] [PubMed] [Google Scholar]
- Teschke R., Genthner A., Wolff A. J. Ethnopharmacol. 2009;123(3):378–384. doi: 10.1016/j.jep.2009.03.038. [DOI] [PubMed] [Google Scholar]
- Kormann E. C., Amaral Pde A., David M., Eifler-Lima V. L., Cechinel Filho V., Campos Buzzi F. Pharmacol. Rep. 2012;64(6):1419–1426. doi: 10.1016/s1734-1140(12)70939-8. [DOI] [PubMed] [Google Scholar]
- Li Y., Mei H., Wu Q., Zhang S., Fang J. L., Shi L. Toxicol. Sci. 2011;124(2):388–399. doi: 10.1093/toxsci/kfr235. [DOI] [PMC free article] [PubMed] [Google Scholar]
- Olsen L. R., Grillo M. P., Skonberg C. Chem. Res. Toxicol. 2011;24(7):992–1002. doi: 10.1021/tx100412m. [DOI] [PubMed] [Google Scholar]
- Shaik A. A., Hermanson D. L., Xing C. Bioorg. Med. Chem. Lett. 2009;19(19):5732–5736. doi: 10.1016/j.bmcl.2009.08.003. [DOI] [PMC free article] [PubMed] [Google Scholar]
- Hu Z., Chang Y. C., Wang Y., Huang C. L., Liu Y., Tian F. Nucleic Acids Res. 2013;41(Web Server issue):W225–W231. doi: 10.1093/nar/gkt401. [DOI] [PMC free article] [PubMed] [Google Scholar]
- Boulton T. G., Nye S. H., Robbins D. J., Ip N. Y., Radziejewska E., Morgenbesser S. D. Cell. 1991;65(4):663–675. doi: 10.1016/0092-8674(91)90098-j. [DOI] [PubMed] [Google Scholar]
- Tang X., Marciano D. L., Leeman S. E., Amar S. Proc. Natl. Acad. Sci. U. S. A. 2005;102(14):5132–5137. doi: 10.1073/pnas.0501159102. [DOI] [PMC free article] [PubMed] [Google Scholar]
- Wang G., Ujiie H., Shibaki A., Nishie W., Tateishi Y., Kikuchi K. Am. J. Pathol. 2010;176(2):914–925. doi: 10.2353/ajpath.2010.090744. [DOI] [PMC free article] [PubMed] [Google Scholar]
- Lidke D. S., Huang F., Post J. N., Rieger B., Wilsbacher J., Thomas J. L. J. Biol. Chem. 2010;285(5):3092–3102. doi: 10.1074/jbc.M109.064972. [DOI] [PMC free article] [PubMed] [Google Scholar]
- Zehorai E., Yao Z., Plotnikov A., Seger R. Mol. Cell. Endocrinol. 2010;314(2):213–220. doi: 10.1016/j.mce.2009.04.008. [DOI] [PubMed] [Google Scholar]
- Cai X., Li M., Vrana J., Schaller M. D. Mol. Cell Biol. 2006;26(7):2857–2868. doi: 10.1128/MCB.26.7.2857-2868.2006. [DOI] [PMC free article] [PubMed] [Google Scholar]
- Folmer F., Blasius R., Morceau F., Tabudravu J., Dicato M., Jaspars M. Biochem. Pharmacol. 2006;71(8):1206–1218. doi: 10.1016/j.bcp.2005.12.032. [DOI] [PubMed] [Google Scholar]
- Shimoda L. M., Park C., Stokes A. J., Gomes H. H., Turner H. Phytother. Res. 2012;26(12):1934–1941. doi: 10.1002/ptr.4652. [DOI] [PMC free article] [PubMed] [Google Scholar]
- Galli S. J., Borregaard N., Wynn T. A. Nat. Immunol. 2011;12(11):1035–1044. doi: 10.1038/ni.2109. [DOI] [PMC free article] [PubMed] [Google Scholar]
- Biermasz N. R., van 't Klooster R., Wassenaar M. J., Malm S. H., Claessen K. M., Nelissen R. G. Eur. J. Endocrinol. 2012;166(3):407–413. doi: 10.1530/EJE-11-0795. [DOI] [PubMed] [Google Scholar]
- Pfeil A., Oelzner P., Bornholdt K., Hansch A., Lehmann G., Renz D. M. Arthritis Res. Ther. 2013;15(1):R27. doi: 10.1186/ar4163. [DOI] [PMC free article] [PubMed] [Google Scholar]
- Verbruggen G., Wittoek R., Vander Cruyssen B., Elewaut D. Ann. Rheum. Dis. 2010;69(5):862–867. doi: 10.1136/ard.2009.112714. [DOI] [PMC free article] [PubMed] [Google Scholar]


