

Abstract
Optical microcavities that confine light in high-Q resonance promise all of the capabilities required for a successful next-generation microsystem biodetection technology. Label-free detection down to single molecules as well as operation in aqueous environments can be integrated cost-effectively on microchips, together with other photonic components, as well as electronic ones. We provide a comprehensive review of the sensing mechanisms utilized in this emerging field, their physics, engineering and material science aspects, and their application to nanoparticle analysis and biomolecular detection. We survey the most recent developments such as the use of mode splitting for self-referenced measurements, plasmonic nanoantennas for signal enhancements, the use of optical force for nanoparticle manipulation as well as the design of active devices for ultra-sensitive detection. Furthermore, we provide an outlook on the exciting capabilities of functionalized high-Q microcavities in the life sciences.
Keywords: biosensing, integrated photonics, microlasers, optical microcavities, optical trapping, plasmonics, optical resonator, nanoparticle detection
1. Label-free microsystems biodetection, down to single molecules
Recent years have seen tremendous progress in the development of micro- and nanoscale optical technologies for biodetection, with research activities mainly focused on developing highly sensitive detection schemes. The sensitive and label-free detection of biomolecules such as viruses, DNA and proteins, is particularly important for implementing next-generation clinical diagnostic assays. Such assays, implemented on chip-scale devices, will replace current labor-intensive and expensive laboratory tests. These next generation microchips are ultimately expected to boast ultimate single molecule detection capability, will be integrated with other electric and microfluidic components, and will be capable of stringent and selective detection of biomolecular markers – even against the background of a multitude of other molecular species. Here, it is essential to achieve single molecule detection capability in an aqueous environment since clinical samples are water based and rapid detection relies on transduction of single molecular interaction events.
Although there are many approaches to label-free biosensing only few technologies promise single molecule detection capability potentially integrated on a chip-scale platform. Figure 1 shows what we identify as the most prominent approaches: high-Q optical resonators, plasmon resonance sensors, nanomechanical resonators and nanowire sensors. In this review we will focus on high-Q optical resonator-based biosensors and discuss their various mechanisms for biodetection, possibly down to single molecules. Similar to the nanomechanical [6, 7], electrical [8, 9] and plasmonic [1] counterparts shown in Figure 1 and Table 1, the sensitivity of optical resonators scales inversely with size. In contrast, non-resonant optical detection schemes such as those based on Mach-Zehnder interferometers [2, 28] do not. The fabrication of miniature high-Q optical microcavities from different materials and in different geometries is therefore a particularly important engineering task as we will review in the following. Furthermore, nanotechnology-enabled optical microcavities are not only one of the most sensitive approaches to probing the biological world in solution, they also are multi-function sensing platforms and we will highlight various mechanisms for sizing, trapping, and manipulating at the nano-scale [29–32].
Figure 1.

Prominent microsystem biosensing technologies developed for label-free detection down to single molecules. From left to right: optical resonator, plasmon resonance biosensor, nanomechanical resonator and nanowire sensor. Reproduced with permission from [1–5].
Table 1.
Comparison of detection capabilities for optical resonator, plasmon resonance, nanomechanical resonator, and nanowire. MW, molecular weight.
| Optical microcavity | Plasmon resonance sensor | Nanomechanical resonator | Nanowire sensor | |
|---|---|---|---|---|
| Transduction scheme | Optical wavelength/phase shift [10] | Optical wavelength/phase shift [1] | Mechanical frequency/phase shift [4] | Conductance change [8] |
| Scaling of sensitivity (in applicable sensor size range) | Inversely proportional to microsphere radius R:~1/R for monolayers~1/R5/2 for nanoparticles | Inversely proportional to sensor size (local surface plasmon resonance) | Inversely proportional to effective sensor mass | Inversely proportional to effective nanowire diameter |
| Sensitive to | Polarizability of biomolecules, proportional to MW [11] | Polarizability of biomolecules [1] | MW [7] | Molecular charge [8] |
| Sensitive operation in water | Yes [10, 12, 13] | Yes [1] | Possible [14] | Yes [15] |
| Detection by molecular recognition in solution | Yes [16, 13] | Yes [1] | Possible [14] | Yes [15] |
| Single molecule detection capability | Possible [10] | Demonstrated [17, 18] | Demonstrated in vacuum [4] | Possible [8, 19] |
| Single virus detection | Demonstrated for Influenza A virus in solution [3] | Demonstrated by imaging [20] | Demonstrated for virus in air/vacuum [21] | Demonstrated for Influenza A virus in solution [5] |
| Microfluidic integration | Yes [22] | Yes [1] | Possible [14] | Yes [19] |
| Multiplexing | Yes [23] | Yes [1] | Yes [7] | Yes [8] |
| Fabrication | Bottom-up [13] as well as top down [24] | Bottom-up as well as top-down [1] | Top-down [7] | Bottom up as well as top-down [8] |
| Logic operation | Yes [25] | Not proposed | Yes (in vacuum) [26] | Yes [27] |
2. Optical resonator-based biomolecular sensors: mechanisms for detection
2.1. Light confinement in high-Q optical microcavities
For most single-pass optical devices, such as waveguide and optical interferometers, light interacts with the analyte molecules or proteins only once. Thus to enhance the interaction between the light and the sensing target usually one must increase the physical length of the sensor. However, in a resonator-based sensor where light is confined in a micron scale sensor element and where the light waves interfere constructively, we can increase the effective interaction length by increasing the optical quality factor (Q) of the resonant system. The quality factor (Q), which is used to quantify the temporal confinement of the electromagnetic energy is defined as
| (1) |
where U(t) is the total energy of the confined light field and −(dU(t)/dt)/ω0 is proportional to the energy that is lost for each electromagnetic oscillation. From this it follows that the energy of the charged cavity will decay over time with U(t)=U0 exp(−ω0t/Q) once the light source has been shut off. The ring-down time τ measured with a photodetector placed in close proximity to the microcavity, is τ=Q/ω0. The exponentially decay of the energy U(t) is characteristic of a resonant system. The energy U(t) is proportional to the electromagnetic field strength squared U(t)∞E(t)2, and it follows that the complex field evolves in time as: E(t)=exp(−ω0t/2Q)exp(−iω|t|). Time and frequency domains are linked by Fourier transforms:
and we therefore expect a spectral response that exhibits a Lorentzian line:
where ω0 is the resonance wavelength and Δω=ω0/Q is the linewidth (full width at half maximum, FWHM). The (total) intrinsic Q-factor of an optical mode is calculated from 1/Qtotal ≈ 1/Qabsorption + 1/Qscattering + 1/Qradiation, where 1/Qabsorption denotes losses of photons by material absorption, 1/Qscattering represents scattering losses due to surface inhomogeneities or surface defects, and 1/Qradiation is set by the radiative losses [33]. For optical resonators with negligible amount of losses from radiation such as for example ~100 μm silica microsphere, the ultimate material limited Q factor [33, 34] is close to
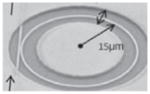
The reported optical attenuation coefficient of αglass~7 db/km (where ~5 dB is bulk Rayleigh scattering and ~2 dB is absorption). Low dissipation systems with high Q factors are particularly suitable for monitoring perturbations of the resonance signal [35] and thus for detecting biomolecules [10]. For example, in an optical microsphere-resonator (Figure 2) with a Q-factor of 108 a photon (with a wavelength of 600 nm) has a lifetime of ~30 ns and can travel in the cavity for ~10 meters before it is lost. If the round trip of the photon in the cavity is 100 μm, the photon will interact with a target molecule more than 105 times. This creates a “signal build-up process” inside the resonator that gives rise to significant signal amplification and allows ultra-sensitive detection of biomolecules.
Figure 2.

Left: total internal reflection of a whispering-gallery-mode (WGM) in a glass microsphere. Right: corresponding wave optics.
High-Q optical resonators have been investigated intensively over the past decade as a promising technology for ultra-sensitive and label-free biosensing [10, 36]. One of the most promising designs is the whispering-gallery-mode (WGM) resonator [37, 38], in which light is trapped in circular orbits by total internal reflections from the boundaries of the resonator (Figure 2). WGM resonators exhibit the highest Q factor [39], up to three orders of magnitude higher than other types of resonators. Other types of high-Q WGM-type microcavity biosensors are ring resonators [40], microtoroids [16], and glass capillaries – so called liquid-core optical-ring resonators (LCORR) [41]. The ultra-high-Q resonators possess many interesting properties, not available in other photonic devices, such as ultra-low loss, ultra-long photon lifetime and ultra-high intracavity power and intensity. Due to these unique attributes, the minimum detectable concentration of a target molecule, i.e., the detection limit, is significantly lower in the ultra-high-Q resonators than in other types of sensors. In fact, it has been demonstrated that a single virus or nanoparticle can be detected by a WGM resonator [3, 30].
As evidenced in Figure 3, few components are needed for an experimental realization of a WGM biosensor. In one implementation, a continuous-wave tunable distributed feedback laser (DFB), for example operating in the telecom band at 1.3 μm wavelength, excites high-Q optical resonances in a microsphere via a tapered optical fiber. The resonances are excited by evanescent coupling from a tapered section of a single mode optical fiber [43, 44], a method that transfers a high power fraction from the fiber to the microcavity. In fact it has been shown that even critical coupling (no transmission at the output of the waveguide on resonance) can be achieved if the coupling distance and the taper diameter is carefully controlled [45]. Moreover, tapers can be fabricated in automated setups [46]. Once coupled, the microsphere spectrum is recorded by sweeping the wavelength of the laser, typically over a narrow spectral range of ~0.3 nm. It is worth noting that the Q factor is now further modified by the coupling Q factor [47].
Figure 3.

Probing high Q resonances of different optical resonators in biosensor applications. (A–D) Reproduced with permission from [13, 24, 30, 42]. (reprinted with permission from [23]. Copyright (2002), American Institute of Physics. Reprinted from [42]. Copyright (2010), with permission from Elsevier.).
More recent biosensing demonstrations utilize other evanescent coupling schemes such as those based on prism coupling [48, 49] and coupling from integrated bus waveguides [24, 50–53]. Both approaches provide for better mechanical stability [54], improved signal-to-noise-ratio [52] and potential for multiplexed excitation, as well as referenced readout of several microcavities in parallel [49]. For a robust biosensor application the integration of such sensor components in a mechanically stable platform is essential. Ultimately, the laser source could be fully integrated on-chip [55], but for now different external lasers, such as DFB as well as external cavity lasers, must be used [13, 30, 56].
2.2. The reactive biosensing principle
Although the principle applies to any optical microcavity geometry, we will review the detection mechanism for a WGM microsphere sensor, where analytical results are most instructive. Like a nanomechanical resonator biosensor [4], the microsphere optical resonator detects the binding of analyte molecules as changes in the resonance frequency. A WGM exhibits a quite large sensitivity to such perturbations because the light field is confined close to the surface where the evanescent field interacts strongly with the surrounding medium.
The binding of a biomolecule will shift the WGM resonance frequency by a miniscule amount (Figure 4). The shift to longer resonance wavelength occurs because the bound biomolecule will effectively “pull” part of the optical field to the outside of the microsphere, thereby increasing the round-trip path length by 2πΔl. This increase in path length produces the shift (Δω) to lower frequency.
Figure 4.

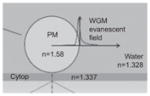
(A) Illustration of a Whispering Gallery Mode (WGM) optical resonance in a glass microsphere. The binding of a protein to the microsphere surface increases the WGM path length by Δl, which is detected as a resonance frequency shift Δω. (B) The reactive sensing principle. A molecule binding to the microsphere surface is polarized within the evanescent field (yellow ring) of a WGM. The energy that is needed to polarize the molecule causes the resonance frequency to shift.
The binding of a streptavidin molecule to a microsphere provides an example [13]. Note that a streptavidin molecule (~4 nm) is small with respect to the radial extension of the evanescent field associated with a WGM. Once bound at the surface where the evanescent field strength E(r) is high, the molecule will become polarized at the optical frequency ω. The overall induced dipole moment P is calculated as P=αex E, where αex is the excess polarizability of streptavidin, in excess of that of the water it displaces [12, 13]. The energy that is needed to polarize the molecule and induce this dipole moment is ½ αex |E(r0)|2, where E(r0) is the electric field strength at the streptavidin binding site r0, and αex,streptavidin ~4πε0×3.3×10−21 cm3. By first order perturbation theory, we can now estimate the frequency shift by comparing the energy that is needed to polarize the biomolecule to the total electromagnetic energy stored in the unperturbed resonator [12]:
| (2) |
where ε is the permittivity of the medium. Equation (2), the reactive biosensing principle, allows one to quantify the frequency shift of any optical resonator in response to molecule or nanoparticle binding events.
A large Q factor is necessary in order to resolve the fractional frequency shift Δω/ω predicted by Eq. (2). In practice one monitors the resonance wavelength shift Δλ, which is Δλ/λ= −Δω/ω. The limit of detection, i.e., the smallest detectable wavelength shift Δλmin is not simply the linewidth ΔλFWHM. A shift of only a fraction F of ΔλFWHM can be sensed [38], so that Δλmin/λ=F* ΔλFWHM/λ=F/Q, where the figure of merit F is typically [57] 1/50–1/100 and determined by noise sources such as thermal-refractive noise [58].
Importantly, the magnitude of the wavelength shift Δλ itself is inversely proportional to the mode volume Vmode given by the denominator in Eq. (2), which for a WGM in a microsphere is [59]
| (3) |
Reducing the size (modal volume) of the optical resonator thus boosts sensitivity. For the microsphere, the optimal resonator diameter can be calculated, because radiation loss limits the Q factor in very small microspheres as the diameter approaches the wavelength of the confined light [59].
2.3. The mode splitting biosensing principle
An alternative to the reactive biosensing principle is the mode-splitting effect, i.e., one resonant mode splitting into two resonances due to interaction of light with nanoscale objects, such as nanoparticles, in the mode volume. Because light can propagate clockwise (CW) or counterclockwise (CCW) in a WGM resonator with a circular boundary, the optical mode in such a resonator possesses a two-fold degeneracy. The degenerate modes share the same resonant frequency ωc and field distributions but propagate in opposite directions; a single resonance appears in the transmission spectrum of the resonator.
When a WGM field encounters a light scattering center, such as a molecule or particle, on its optical path, the light is scattered elastically from the particle/molecule. A portion of light is scattered and lost to the environment, while some is scattered back into the mode volume and takes the optical path of the counter-propagating frequency-degenerate mode, coupling between the CW and CCW modes. This lifts the degeneracy of the two modes. Two standing wave modes are formed in the cavity, and this is reflected in the splitting of the single resonance into a doublet structure, i.e., two resonances, in the transmission spectra of the resonator (see Figure 5). Because the two split modes reside in the same resonator, they share many noises sources, such as temperature variation, and since they are compared to one another, this is a self-referencing sensing technique [30].
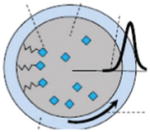
Figure 5.

Mode splitting in a WGM resonator. Left: WGM resonators supports degenerate counter-propagating modes: clockwise (CW) and counterclockwise (CCW). Light scattering from a scattering center introduces additional damping to the optical modes and couples the initially degenerate CW and CCW modes, lifting the mode degeneracy. Right: Experimentally obtained mode-splitting transmission spectrum (blue) after the deposition of a single nanoparticle in the mode volume of a microtoroid WGM resonator and the fitted curve (red) adapted from [30].
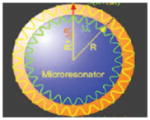
The mode-splitting effect in WGM resonators was first reported as an interesting phenomenon in high-Q microspheres [60, 61]. It has since been demonstrated in various WGM resonators with different geometries, including microspheres, microtoroids and microdisks [30, 62–64]. Many factors, such as surface defects, material inhomogenities, and nanoparticles, all of which can induce light scattering in the mode volume of a WGM, may cause mode splitting. Assuming a subwavelength scattering center (Rayleigh scatterer), and that the electric field of the coupled WGMs induces a dipole in the scatter, the interaction between the WGM and the scatterer can be modeled using a dipole approximation [30, 61, 62]. Polarizing the scatterer induces a coupling between the two counter-propagating WGMs. The coupling coefficient g depends strongly on the polarizability α of the scatterer and the location of the scatterer in the mode volume Vc with respect to the mode distribution. We can derive g as:
| (4) |
where ωc is the resonance frequency, f(r) accounts for the cavity mode distribution of the WGM at location r, α represents the polarizability of the scatterer which for a spherical scatterer of radius R can be expressed as α=4πR3(εp−εs)/(εp+2εs) in which εp and εs denote the electric permittivities of the particle (scatterer) and the surrounding medium, respectively.
Through the interaction of the scatterer with the WGM field, a portion of the field is lost to the environment, adding to the damping. Using a Weisskopf-Wigner approximation, the damping rates due to coupling to the reservoir via Rayleigh scattering is:
| (5) |
where is the velocity of light in the surrounding environment and c is the speed of light in vacuum.
The polarizability of a nanoparticle can be calculated from the mode-splitting transmission spectrum of WGM resonator after a nanoparticle is adsorbed on its surface. The coupling strength g is quantified by the doublet splitting g=πδ, where δ is the frequency detuning of the two split modes. The additional linewidth broadening is ΓR=π|γ1−γ2|, where γ1 and γ2 represent the linewidths of the split modes. The ratio of (γ1−γ2)/δ carries information about the polarizability of the particle, and hence on its size and permittivity (i.e., its refractive index). Comparing Eqs. (4) and (5) it is clear that the polarizability of the nanoparticle is then: α=4πR3(επ−2εσ)/(επ+2εσ)=−(3λ3/8π2)(ΓR/g). It is important to note here that the measurement of ΓR/g =(γ1−γ2)/δ is independent of the position of the particle on the resonator. The position-independence of the value of ΓR/g gives the mode-splitting technique advantages over schemes using single-resonance spectral shift, which are affected by the particle position.
Once mode-splitting is introduced by the first scatterer, two orthogonal standing-wave modes are formed by the superposition of the split modes in the resonator. The next scatterer deposited/adsorbed scatterer in the mode volume interacts with the two orthogonal modes differently, and subsequently the two standing waves re-distribute themselves to maximize the amount of mode splitting. Given this physical mechanism, we can derive the polarizability of the nth light scatterer by analyzing the relative changes in the linewidths and frequencies of the two split modes in two consecutive mode-splitting spectra. We do not need to record the whole history of the changes in the mode-splitting spectra to measure the size of the nanoparticle in the mode volume [65]. In fact Influenza A virions deposited on a microtoroid resonator have been measured one by one and the derived size distribution of the Influenza A virions agreed well with the size range of such virions as reported in the literature [66, 67].
The detection limit of the mode-splitting technique is set by the condition that the two split modes need to be resolved in the transmission spectra, which requires that the amount of splitting quantified as |2g| should be greater than the sum of the frequency linewidth ωc/Q of the WGM and the additional scattering-related damping rate ΓR [68], i.e.,
| (6) |
Otherwise, the two split modes will appear as a single resonance in the transmission spectrum. For small particles, ΓR is usually much smaller than ωc/Q, and therefore the detection limit of the mode splitting technique is mainly set by the Q-factor, which determines the smallest resolvable mode splitting. Once the mode splitting is observed and measured, polarizability and hence the size or refractive index of the scatterer can estimated.
Usually the mode-splitting spectrum is measured by scanning the wavelength of a tunable laser through the frequencies and, once the mode splits, recording the transmission spectrum. An interferometric setup introduced in Ref. [69] allows mode splitting to be detected even if |2g| is smaller than the linewidth of the modes. It also provides an alternative way to detect mode-splitting signals without requiring a tunable laser. Recently an optical gain medium, which helped narrow down the linewidths of the optical modes, was also used to recover mode-splitting from what initially appeared as a broad, single resonance [70].
The first experimental demonstration of size measurement of single nanoparticles utilized a high-Q microtoroid WGM resonator [30]. In this work, single potassium chloride (KCl) and polystyrene nanoparticle as small as 30 nm in radius were detected and measured by analyzing the mode-splitting spectra. Consecutive size measurement of nanoparticles deposited one by one into the mode volume of a high-Q resonator was also achieved by anaylzing the frequencies and linewidths of the resonances in the mode-splitting spectra right before and after the deposition of each particle [65].
When a resonator is in liquid solution, the smaller difference between the refractive indices of the resonator and surrounding medium degradates Q factor because it leads to increased radiation loss and decreased particle polarizability. Absorption loss in the surrounding medium is also greater, which further decreases the Q factor of resonant modes. As Eq. (6) suggests, sensing applications in an aquatic environement are more difficult than those in air. To address this issue, a resonator with a Q factor high enough to tolerate the Q degradation must be used [71, 72]. One strategy is to use a thermall-stabilized reference interferometer to reduce the frequency noise in the measurement of mode-splitting. By means of such a scheme, a high-Q microtoroid has been used to detect polystyrene nanoparticles with radii down to 12.5 nm and Influenza A virions in aquatic environment [67].
2.4. Detecting biomolecular mass loading
The detection capabilities of a spherical optical resonator biosensor can be predicted by analytic equations [12, 73–79]. For a single nanoparticle binding on the microsphere excited in the fundamental WGM mode Yll one predicts a resonance frequency shift of [3, 12, 38]
| (7) |
where rp is the particle binding site, L is the evanescent field length, R is the microsphere radius, ns and nm are the refractive indices of the sphere and the medium, respectively. For a biomolecule that is small compared to the wavelength the exponential factor is negligible. For N molecules binding at random locations to the microsphere surface with surface density dN/dΩ=σ4πR2/4π (Ω is the solid angle) Eq. (7) becomes [12]
| (8) |
where σ is the surface density of bound biomolecules (typically reported in units of cm−2). The excess polarizability of protein or DNA biopolymers is determined from measurements of the refractive index increment dn/dc of the pure biopolymer solution. The excess polarizability is then related to the refractive-index increment by
| (9) |
where ε0 is the vacuum permittivity, nm is the solvent (water) refractive index, m is the molecular weight of the biomolecule (streptavidin: ~1×10⁻¹⁹ g) and the dn/dc of protein [11] is ~0.183×10⁻⁹ mm3 pg−1, dn/dc of DNA ~0.166×10⁻⁹ mm3pg−1. With this Eq. (9) in hand, we can calculate the mass loading (mass.l.) associated with the resonance frequency shift and plot the sensor response (sensogram) in units of picograms per millimieter squared sensor area [10]:
| (10) |
A similar analysis has been done for LCORRs where calculations for resonance wavelength shifts are calculated as [80]
| (11) |
where n2 refractive index of medium, n3 is the refractive index of the LCORR, and bulk index sensitivity S=δλ/δn3. For details of this derivation we refer to [80]. For other resonator geometries such as toroids, this analysis has do be done by simulation [81], because no analytic equations that describe the confined light fields are available. In practice, the sensor response is often experimentally determined (calibrated) for different solution concentration levels [51, 82–84]. Examples for this are shown in Figure 6. In surface-based biosensing the most physical and accurate figure of merit is the limit of detection (LOD) in units of pg/mm2 mass loading, see Eq. (10). Very often, researchers also report the sensitivity to bulk index change in units of nm wavelength shift per refractive index unit (RIU): nm/RIU. Although the field has accepted measurements of bulk index change as a form of biosensing we would like to point out that a high sensitivity to bulk index change is not always directly correlated with a high sensitivity to mass loading at the microcavity surface. We also emphasize that label-free and specific detection by molecular recognition has thus far only been achieved in sensitive surface-based detection schemes.
Figure 6.

Examples of biorecognition schemes utilized in microresonator biosensing applications: (A) antibody-based detection of a cancer biomarker carcinoembryonic antigen (CEA) with silicon rings in serum (adapted with permission from [85], copyright (2009) American Chemical Society), (B) detection of DNA oligonucleotides by hybridization to dextran-functionalized microspheres (reprinted from [57], copyright (2003), with permission from Elsevier), (C) breast cancer biomarker HER2 detection in LCORRs functionalized with antibody (reprinted from [42], copyright (2010), with permission from Elsevier), (D) silane-based bioconjugation techniques that have been explored for achieving high surface densities in DNA detection [86].
The mass loading reached at a given time depends on the concentration of the analyte (Figure 6). By fitting of the time response of the sensor to a kinetic binding model, such as the Langmuir model, one can determine on (kon) and off rates (koff) as well as the dissociation constant Kd=koff/kon which characterizes the affinity of the analyte towards its binding site on the resonator surface [11, 23, 84, 87–89]. More complicated models can account for conformational change or denaturation that may occur after analyte binding at the resonator surface [87]. Alternatively, the dissociation constant Kd can be determined from an equilibrium plot of mass loading or percentage surface coverage versus solution concentration level. Such a plot is called Langmuir isotherm and the dissociation constant Kd equals the concentration level at which surface coverage is 50% [11]. In practice one often plots the mass loading divided by analyte concentration versus mass loading. The slope of this linear plot is just −1/Kd [90]. Although binding kinetics are typically measured by stepwise titration of analyte concentrations, researchers recently reported a method for determining kinetic rates and equilibrium binding affinities in a single experiment during which analyte concentration increased in a nonlinear gradient [91].
Once the sensor response for different solution concentrations has been experimentally determined or analytically calculated, the sensor can then be used to determine unknown concentrations of an analyte. To ensure only the molecules of interest are detected, the resonator surface is modified (“functionalized”) with elements that recognize the analyte, such as antibodies [82, 84, 92], DNA oligonucleotides [57, 89, 93–96], aptamers [97] or other receptors [13, 98–101]. A few examples are shown in Figure 6 and Table 2 gives an overview of the recognition elements and the sensitivity levels that have been obtained with each element. Opto-fluidic ring resonators (OFRR, LCORR) in particular have been used extensively in various biosensing tasks, such as the detection of organophosphorus pesticide [109], label-free DNA methylation analysis [100], detection of breast cancer biomarker CA15-3 in serum samples [110], and detection of the HER2 breast cancer biomarker [42]. Also silicon, silicon nitrate and polymer ring resonators have been used to detect: antigen (PSA), alpha-fetoprotein (AFP), carcinoembryonic antigen (CEA), tumor necrosis factor-alpha (TNF-alpha), and interleukin-8 [51]; single nucleotide polymorphisms [90], DNA and mRNA [88, 96] as well as tmRNA [105], C-reactive protein (CRP) [84], cytokines interleukin-2 (IL-2), interleukin-4 (IL-4), interleukin-5 (IL-5), and tumor necrosis factor alpha (TNF alpha) [83]; IL-2 [82]; avidin [53, 111]; cadaverine [52] and antibodies [92]. In combination with nanoparticles, different kinetic modalities for sensing have been demonstrated in toroidal cavities [112] and enhancement of sensitivity in a nanoparticle-sandwich assay was demonstrated on silicon ring resonators [84].
Table 2.
Overview of some of the biomarkers that have been detected using recognition elements immobilized on the resonator surface. The minimal detectable mass loading and concentration levels are indicated. Experiments were performed in buffer solutions except where otherwise indicated.
| Biomarker, approx. MW in kDa | Optical resonator type | Recognition element | Detection limit mass loading | Detection limit concentration |
|---|---|---|---|---|
| Streptavidin [13, 102, 103] 56 kDa | Glass microsphere, folded ring resonator | Biotin | 1 pg/mm2 | 1 nM |
| Thrombin enzyme [97] 38 kDa | Glass microsphere | Aptamer | 1–10 pg/mm2 | 1 U/ml |
| Glucose oxidase enzyme 160 kDa | Glass microsphere | None | 1–10 pg/mm2 | 1 nM |
| Bacteriorhodopsin [104] 26 kDa | Glass microsphere | None | 1 pg/mm2 | n/a |
| DNA [57, 80, 94] 5–10 kDa | Glass microsphere, LCORR | DNA | 6 pg/mm2 | <1 nM |
| Methylated DNA [100] 5–10 kDa | Glass capillary (LCORR) | Methyl binding protein | n/a | 1 nM |
| tmRNA, 26–40 kDa [105] | Silicon ring resonator | DNA | n/a | 0.524 nM |
| Prostate specific antigen PSA [51] 28 kDa | Silicon ring resonator | Antibody | n/a | 0.4 nM |
| IgG antibody ~150 kDa [106] | 2D photonic crystal cavity | Antibody | 0.8 pg/mm2 | ~ 0.1 nM |
| Breast cancer biomarker HER2 [42] 138 kDa | Glass capillary (LCORR) | Antibody | n/a | 0.1 nM (spiked in serum) |
| Interleukin 2,4,5 [82, 83, 107] 15 kDa, 15 kDa, 43 kDa | Silicon ring resonator, toroid | Antibody | n/a | 6–100 pM |
| Tumor necrosis factor TNF [83] 51 kDa | Silicon ring resonator | Antibody | n/a | 100 pM |
| Alpha-fetoprotein (AFP) [51] 70 kDa | Silicon ring resonator | Antibody | n/a | 100 pM |
| Fibronectin [87] 440 kDa | Glass microsphere | None | 1–10 pg/mm2 | 1–10 pM |
| Carcinoembrionic antigen (CEA) [85] 185 kDa | Silicon ring resonator | Antibody | n/a | 10 pM (in serum) |
| Streptavidin56 kDa [106] | 2D photonic crystal cavity | Biotin | 0.8 pg/mm2 | ~ 1 pM |
| TAMRA-Cadaverine517 D [52] | SU8 racetrack resonator | None (covalently bound) | n/a | <1 pM |
| Influenza A virus [3, 66, 67] 300 000 kDa, MS2 virus [108] | Glass microsphere, glass toroid | None | 6–500 attogram | 10–100 fM |
Crucial to achieving specificity is the chemical modification of resonator surfaces, which strongly depends on their material properties. For example, for the modification of glass (and the thermal oxide layer on silicon) one can use silanization of the glass-silanol groups [13, 16] or physisorption of proteins and hydrogels [57, 107]. In multiplexed arrays, each sensor element can be individually functionlized, by, for example fluids controlled with microfluidics [23, 24], or ink-jet printing [113] or patterning with silicon etchants [114]. Also very recently, one and two-dimensional photonic crystal resonators have been explored to detect biomolecules, including interleukins 4, 6 and 8 [115] and bovine serum albumin [116] as well as immunoglobulins [106]. Table 2 gives an overview on molecules that have been detected with optical microcavities, as well as the reported detection limits. Detection limits in the 10 pM range rival those of conventional enzyme-linked-immunosorbent assays (ELISAs).
3. Optical resonator biosensors: materials and geometries
The material and geometry of a microcavity affects its Q factor as well as modal volume V and the optical field’s overlap with analyte molecules. Table 3 gives an overview of the Q and V values for a variety of optical resonators that are currently being championed for biosensing applications. In the following chapter we will focus on the most prominent candidates and review the most recent materials, geometries and sensing approaches.
Table 3.
Examples for microcavities that have been utilized or proposed for utilization in biosensing applications.
| Optical resonator | Device example | Q in air/in water | Diameter | Fabrication |
|---|---|---|---|---|
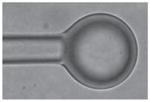
| Microsphere waveguide coupled [13, 32, 38, 75, 87, 102, 117, 118] |
|
8×10⁹/107–108 | 50–500 μm | Usually formed by melting a fiber tip |
| Microsphere, prism coupled [48, 119] (reprinted with permission from [48], copyright (2008), American Institute of Physics) |
|
/9×105 | 30~40 μm | Arrayed from a batch of polystyrene microspheres in solution |
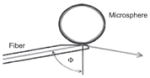
| Microsphere, angle polished fiber coupled [120, 121] (reproduced with permission, © (1999) Optical Society of America) |
|
1×10⁸ | ~500 μm | Microspheres fabricated by fusing high-purity silica preforms in a hydrogen-oxygen flame |
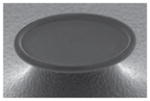
| Microtoroid, fiber coupled [16, 66, 67, 70] |
|
8×10⁸/107–108 | 30~200 μm | CO2 reflow of an under-cut silica micro-disk on silicon wafer |
| Ring resonator, waveguide coupled [24, 52, 53, 111, 122–125] (image reproduced with permission from the publisher, [24]) |
|
/4×104–2×105 | ~20–200 μm | Ring resonator sensor arrays fabricated by lithography technology |
| Fluorescent microsphere [93, 101, 126–129] (image reproduced with permission from the publisher, [127]) |
|
/5000 | ~8–15 μm | Microspheres doped with optical gain medium, such as dye |
| Capillary, fiber coupled (LCORR) [42, 56] (reproduced with permission, ©(2006) Optical Society of America) |
|
/105–107 | ~150 μm | Softening (CO2 laser) and stretching a fused silica capillary |
| Disk resonator [130, 131], waveguide coupled (reprinted from [131], copyright (2010), with permission from Elsevier) |
|
~104 | 10 μm–100 μm | Fabricated from silicon oxy-nitride film on a silicon wafer by lithography technology |
| Bottleneck resonator [132] |
|
~108 | 30–40 μm | Fabricated from standard optical glass using a two-step heat-and-pull process |
| Microtube ring resonators [133, 134] (reprinted with permission from [133], copyright (2011) American Chemical Society) |
|
/100~300 | <10 μm | Roll up of a strained SiO/nanomembrane to SiO2 form a micro-tube with thin wall |
| Photonic crystal resonator [115, 116, 106, 135–137] (reproduced with permission, © (2007) Optical Society of America) |
|
106 | Micron-scale | e-beam lithography and reactive ion etching |
| Fabry perot resonator [138] |
|
Finesse: 38 | 40 μm | Resonator is formed between two highly reflecting reflectors composed of Bragg two period Si/SiO2 structures |
| Fiber-based [139, 140] (reprinted with permission from [139], copyright (2005), American Institute of Physics) |
|
104~106 | 20~200 μm | Resonator is formed beween the plane tip of a fiber and a concave micro-mirror fabricated by standard silicon etching and optical coating techniques |
| Microbubble [141–143] (reproduced with permission, © (2011) Optical Society of America) |
|
103~107 | 70~500 μm | Heating a glass capillary with a CO2 laser |
| Micro-coil [144–146] |
|
106 | 500 μm | Wind a microfiber coil on a cylindrical rod with lower refractive index |
| Photonic-plasmonic WGM: microsphere coupled to nanoantenna [58, 147–149] (reprinted with permission from [147], copyright (2011), American Institute of Physics) |
|
/106 | Light localized at the nanoantenna site | Nanoparticle layer deposition, nanoparticle WGM trapping |
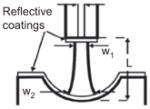
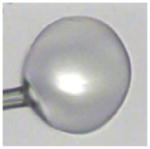
3.1. High-Q microsphere cavities
Perhaps the simplest example for an optical resonator is a ~100 μm-diameter silica microsphere, where light remains confined due to total internal reflection [150], see Figure 7. Although glass has low dissipation, light confined inside the microsphere is eventually lost due to absorption and scattering. The high-Q microspheres are simple to fabricate. They can be made by melting spheres at the end of high quality optical fiber with a hydrogen torch [33] or a CO2 laser beam [34]. Microspheres fabricated from a standard single mode optical fiber and immersed in a liquid have been used in many biosensor experiments [13, 48, 57, 87, 97, 101, 117, 152], including the first biosensor demonstration in 2002 [13]. Placing the sphere in a liquid limits Q-factor to ~107–8 [71, 153], however, because the liquid absorbs light.
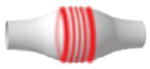
Figure 7.

Equatorial WGM. The green ring, which traces the trajectory of the fundamental equatorial WGM, is due to the luminescence of the erbium ions with which the microsphere is doped image taken from [151].
Among the resonances of the high-Q micro-spheres, the modes localized along the equator are of particular interest [34]. These WGMs combine a good spatial confinement of the field with the very high-Q factors (Q), two features which are of great importance for sensitive biodetection. Figure 7 illustrates an equatorial mode in an erbium-doped microsphere excited by light transferred from a tapered fiber.
The transverse electric and transverse magnetic fields confined in a microsphere are described by
| (12) |
where Ynm(θ,φ) are the vector spherical harmonics, and jn(nkr) represent the spherical Bessel functions, with k=2π/λ. These resonances can also be viewed as quasi-bound states of a Schroedinger-like equation that describes a complex angular-momentum particle in an effective potential well that occurs due to the refractive index contrast between the higher index of refraction of the sphere and lower index of refraction of the surrounding medium. The Bohr atom thus seems a reasonable analogy, and microsphere resonances are often called “photonic atom modes” [154, 155]. For the Bohr as well as the photonic atom, wave functions are indexed by three quantum numbers n,l,m, where n represents the number of nodes in radial directions, l is the angular-mode number proportional to the number of wavelengths in one orbit, and m is the azimuthal mode number. Modes with the same l-number but different m values are degenerate in a perfect sphere, however, for spheres made by melting of a fiber tip this degeneracy is typically removed and instead they exhibit a spectrum rich with modes of different m numbers. By observing different TE and TM modes in a microsphere it is possible to detect the orientation of molecules bound at the microsphere surface [104, 156]. Furthermore, wavelength multiplexing of several WGMs simultaneously can provide information on the thickness of an adsorbed layer [157].
Microspheres are particularly suitable for table-top experiments since they are easily fabricated [33, 34, 120] and their mode structure is amenable to rigorous theoretical analysis [73, 76–78, 158, 159], as well as simulations based on Mie theory [147, 160]. Recent demonstrations of high-Q micro-spheres include studies of protein adsorption [87], thrombin detection [97] and refractive index sensing [48, 117]. Very high sensitivity allows the detection of single particles such as polystyrene nanospheres and virus particles [3, 32]. Recent developments include efforts to further improve the sensitivity [58, 81, 147, 152, 161], multiplexing capability [49] and functionalization strategies [16, 54].
3.2. Ring and disk resonators
Ring and disk resonator geometries were among the first to be proposed for biosensing applications, and they have since become the most prominent resonators in biosensing. They are fabricated on-chip with photolithographic techniques in different materials systems and in large sensor arrays [24, 40, 50, 52, 53, 89, 130, 131, 162–168]. For example, ring, racetrack and disk resonators can be fabricated in silica, silicon [24, 50, 89, 111, 166, 168] and organic polymers [52, 165, 167, 169, 170]. Early biosensing demonstrations proposed a high-finesse (low loss) WGM disk resonator [130] and utilized a vertically coupled glass microring resonator with Q of about 12000 [111] as well an integrated silicon nitride (SixNy/SiO2) ring resonator [53]. Within arrays, individual sensors can be used as internal reference, thereby eliminating noise due to thermal fluctuations and nonspecific molecular binding events [24]. Often compatible with CMOS techniques, ring and disk resonators are ideal candidates for integration into portable electronic devices and commercial bench-top systems [92] and indeed silicon ring resonator biosensors are already on the market. Microfabricated ring/disk resonator arrays are also quite easily incorporated with microfluidics because they are fabricated on planar substrates.
One interesting approach to integration is an electrical tracing-assisted dual-microring resonator-based optical sensor system fabricated on silicon-on-insulator (SOI) wafer. The resonance wavelength shift of a sensing microring is measured by the electric power needed for a second, tracing microring to match the resonance shift. The electrically tunable tracing microring thus eliminates the need for wavelength scanning of a laser source [171]. Nanoporous polymer ring resonators reportedly increase device sensitivity by 40% because bioanalyte enter pores and interact with electromagnetic energy in the core of the ring, not just its surface [169]. Cascaded microrings that exploit the Vernier effect have also recently been proposed to increase sensitivity [172, 173]. In addition, it was found that for certain sensing schemes extending the ring cavity length of SOI microring sensors increases the resonator quality factor, and can thereby enhance the sensor resolution and minimum level of detection [103]. Vertically stacked microracetrack made from the photoresist SU8 have low noise and are exceptionally stable, although prone to temperature fluctuations [52].
In the meantime, the applications for these sensors have also been expanding. A commercial silicon ring resonator biosensor has been used for the first time to detect a biomarker (the cancer biomarker carcinoembryonic antigen) in the complex media of undiluted serum [85]. The same group used silicon ring resonators to detect single-nucleotide polymorphisms via kinetic DNA dissociation measurements [89]. They also used silicon ring resonators to simultaneously measure several protein biomarkers secreted from cells in cell culture media [82]. SOI ring resonator arrays with one output port that rely on wavelength division multiplexing have shown excellent sensitivity (0.3 pg/mm2) monitoring multiple molecular-binding events [168].
Silicon nitride waveguides have also found applications in biomolecular detection [53]. Because silicon nitride is resistant to the diffusion of moisture and sodium ions, it can maintain a stable refractive index when operating in biological liquids. A packaged array of optical-slot-waveguide silicon-nitride ring-resonator sensors demonstrated high sensitivity of 0.9 pg/mm [174]. Another approach using slot-waveguide-based ring resonators on SOI demonstrated a refractive-index sensitivity of 2×10⁻⁵ RIU within a small footprint [122].
Microring resonators made of high index glass have been developed as a platform for detecting whole bacterial cells, proteins and nucleic acids [123]. Finally, ring resonators made from silicon nanowire optical waveguide (SNOW) have also shown promise for biosensing [175].
3.3. Liquid-core optical ring resonators
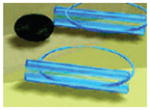
WGM resonances are also sensitive to biomolecules binding to the interior of thin-walled microcapillaries, and this is the basis for liquid-core optical ring resonator (LCORR) [56, 94, 176, 177]. The capillaries are fabricated by pulling the capillary while softening the glass with a CO2 laser [56, 178]. The hollow-core cylindrical devices are easily integrated with microfluidics; indeed one of the main advantages of this approach is the ease of fluid handling as shown in Figure 3C. Theory and experiment put the protein detection capability of the LCORR in the sub-pg/mm2 range [80]. LCORRs have been used in various sensing applications including the detection of DNA, viruses, proteins and biomarkers of cancer [80, 94, 179, 180]. Theoretical analysis shows that the thickness of capillary wall can be optimized to minimize or eliminate thermal drift, which could help stabilize the resonant modes in the presence of temperature fluctuations [181]. Recently a fluorescence based refractometric sensing was demonstrated in a glass capillary coated on the interior with fluorescent silicon nanocrystals [182].
LCORRs can be arranged in parallel on integrated waveguides to create a sensor arrays already integrated with microfluidics [183]. By positioning multiple waveguides along a single capillary, it is possible to interrogate the region of the capillary near each waveguide independently. This linear configuration is well suited to such applications such as capillary electrophoresis [184].
Although LCORRs have found diverse applications in biosensing, they have not yet demonstrated single particle/molecule resolution. Recent analysis has showed, however, that optofluidic ring resonators (OFRRs), which resemble LCORRs but which confine the WGM in three rather than two dimensions (by creating a bubble in capillary) are capable of detecting nanoparticles <20 nm in radius [185].
3.4. Toroids
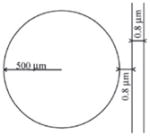
Silica toroidal resonators are fabricated from layers of silica (glass) grown on crystalline silicon substrates by thermal oxidation. The silica is etched into discs with hydrofluoric acid, and the discs are then undercut with a xenon difluoride etch to form silica discs on silicon posts [186]. The disc are transformed into toroids (donuts) by heating the silica with a CO2 laser, a self-terminating process. The modal volumes of toroidal resonators are smaller than those of microspheres of comparable diameter, and the resonators also have ultrahigh Q factors [186] because of the almost atomically smooth surface produced by reflowing glass. Thus, the toroid geometry boasts a sensitivity comparable to that of the microsphere and is a good candidate for achieving single molecule detection [30, 66, 67, 70, 81]. Toroids could potentially be produced in arrays like those described for disks and rings. However, integrating the resonators with waveguides or optical fibers requires secondary fabrication steps and remains a challenge. This challenge may be addressed by avoiding the secondary fabrication step yet obtaining high-Q microcavities of up to 875 million for on-chip applications, for diameters larger than 500 μm [187]. Toroids are increasingly used in biosensor demonstrations [16, 65, 102, 112].
Researchers have recently used microcavity ring down spectroscopy to track the Q factor and wavelength shift during a biodetection event in order to make the resonator less susceptible to noise [98]. Computational schemes can also be employed to calculate the toroid response to detection events in order to achieve higher sensitivitys [81].
An interesting variant of the toroidal microcavity is the goblet resonator, made of a thermoplastic polymer that assumes a cupped shape on reflowing [188]. Finally, another modification of the fabrication scheme produces high-Q toroids with beveled edges, called wedge resonators [187].
3.5. Fluorescent beads, capillaries and tubes
Mie resonances in microspheres or capillaries doped with fluorescent dyes can be identified by epifluorescence microscopy and spectroscopy. These are lower-Q sensors, but they still provide a reasonably small modal volume for biosensing [101, 189, 190]. Fluorescent beads a few μm in diameter are capable of detecting proteins [126, 127, 191, 192]. They can also be used to detect the forces during endocytosis because microbead deformation induces azimuthal mode splitting [128]. In addition, a new detection scheme using clusters of fluorescent microresonators was introduced recently [191]. Each clusters of microresonators has a specific WGM spectrum that serves as its “fingerprint” and would allow clusters on a chip to be read out properly without knowing their exact locations.
Another recent innovation is the use of flexible split-wall fluorescent microtube resonator sensors to detect mouse fibroblast cells [133]. The same authors then discussed the integration of this device with others to constitute a lab-on-a-tube [193]. Quantum dots embedded in polystyrene microspheres can also serve as fluorescent sensors; the wavelengths of their resonant modes shifts as the bulk index of refraction is changed in ethanol-water mixtures [194]. Another approach combines fluorescence imaging with WGM resonators for multiplexed detection of biomolecules [49].
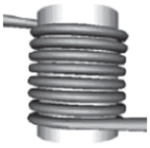
3.6. Other resonator geometries: coils, bubbles and photonic crystals
Optical fiber nanowires can be coiled-up to form microcoil resonators where a microfluidic channel runs through the inside of the coil for biosensing applications [144–146]. Recently a novel refractometric sensor based on a coated all-coupling optical-fiber-nanowire microcoil resonator with device sensitivity as high as 700 nm/RIU was reported [146, 195]. An entire review is dedicated to the subject of microcoil resonators and we refer the interested reader to [144]. Also, controlling the melting of a capillary microbubble resonator has been shown to have potential in biosensing by filling the bubble with analyte solution [141–143]. Another fiber-based high-Q cavity with potential applications in biosensing is the bottleneck resonator fabricated by melting a standard single mode fiber [132].
A very promising planar platform for biosensing applications is based on two-dimensional silicon photonic crystals where light can be confined by Bragg reflection and within the photonic bandgap [115, 116, 196, 197]. Photonic crystal cavities can offer ultra-low modal volumes combined with high-Q factors which continue to improve as the design files and the nanofabrication recipes advance [198, 199]. The highest sensitivity for detection with a Q~9300 photonic crystal microcavity has recently been demonstrated at mass loading sensitivity of 0.8 pg/mm2, and with a concentration of only 0.1 μg/ml protein in the pico-molar range [106]. Also recently, a one-dimensional photonic crystal resonator array was introduced for significantly enhancing the light-matter interaction. It was shown that spatially localized optical fields down to mode volumes of a wavelength cubed improve the detection limits of previous designs [115].
Extended photonic crystal membranes without cavities have also been proposed as biosensing elements for detecting particles by “dark field” imaging [200]. In another fundamental study it has been shown that by disordering of the photonic crystal lattice, very high-Q cavities with various modal volumes can be introduced, for example along the length of a photonic crystal waveguide [201]. The random cavities can be potentially used in multiplexed detection and are more easily to fabricate as compared to highly-engineered defect cavities.
We also note that photonic crystal structures that effectively form 1D gratings have been used extensively in biosensing [135]. Because of the low Q, large modal volume and resulting lower sensitivity for detecting a limited number of molecules, such reflectivity filters fall outside the scope of this review and we refer the reader to [202, 203].
4. Active resonators for sensing enhancement
A narrow resonance can help to resolve a small resonant shift caused by trace amount of molecules attached to the resonator, which could have been missed by a broad resonance. The resonance linewidth of a passive optical resonator, i.e., a resonator without optical gain, is affected by fabrication process, geometry, materials absorption, radiation loss and scattering loss of the resonator. Appropriate design and optimization of the fabrication process could help increase the passive Q-factor, and therefore decrease the linewidth, by minimizing the radiation and scattering induced loss, but the loss from materials absorption will set the limit of the Q-factor, i.e., the linewidth, for a passive resonator. However, in an active optical resonator, i.e., a resonator with optical gain, where the loss can be compensated by the gain medium, the effective loss felt by the photon is decreased dramatically, which will increase the effective Q-factor, subsequently decrease the linewidth, and hence improve the sensitivity and detection limit.
The active resonator can operate in either below-threshold and above-threshold regime; in both cases, the detection limit and resolution is significantly improved. The above-threshold regime, also termed as lasing region, in particular, is very attractive for detection purposes since the lasing line usually has much narrower linewidth than the resonance linewidth of the cold cavity (i.e., the gain medium is not pumped). According to Schawlow-Townes formula, the fundamental linewidth of a lasing mode in a resonator is
| (13) |
where Δνcold is the resonance linewidth calculated from “cold” cavity Q factor Plaser is the power of the lasing mode and ν is the resonant frequency. For an active resonator with cold Q-factor of 108 and lasing wavelength wavelength at 1550 nm, the laser linewith is at the Hertz level, which is almost six orders of magnitude narrower than the cold resonance linewidth of 2 MHz. In principle, it suggests that the microcavity laser as a sensing element could provide a much lower detection limit than its passive counterpart.
The sensing performance of the reactive shift method can be enhanced through optical gain by improving the minimum detectable resonant shift (Figure 8). Active WGM resonators have been proposed to enhance the sensitivity in spectral shift technique. With gain medium doped polymer microspheres it is possible to detect effective refractive index change of the order of 10−9 RIU [129]. Nile red has been used to improve Q factors of polystyrene microspheres to enhance the sensitivity in both the spontaneous (i.e., below threshold) and stimulated emission (i.e., above threshold) regimes. The active microspheres have demonstrated eight-fold SNR improvement and three-fold Q enhancement which helps monitor the real-time adsorption kinetics of bovine serum albumin in phosphate buffered saline (PBS) [126]. Active microspheres doped with quantum dots have been used for biosensing with the minimum detection limit of 260 pg/mm2 for a minimum detectable mass of ~80 fg protein [194] and the minimum detectable refractive index change of 2.5×10⁻⁴ RIU [204]. Using tetramethylrhodamine as gain medium, active silica microspheres were also demonstrated to achieve detection of oligonucleotides [93]. Recently a new active sensor composed of a ring laser and an optofluidic tube has achieved sensitivity of 5930 nm/RIU, which is around one order of magnitude higher than what has been demonstrated by a sensor based on passive ring resonator [205]. Microlaser in liquid form is naturally compatible for sensing in solution. It has been shown that millimolar of surfactant can be detected by measuring the lasing spectrum of a liquid-crystal droplet in water [206]. Also other structures, such as gratings and photonic crystals have been utilized recently in active cavity sensing [207].
Figure 8.

The binding of molecules on the surface of a resonator shifts the resonant frequency. (A) For a passive resonator (resonator without gain medium), too much overlap with the original resonant mode makes it difficult to distinguish the shifted resonance since the resonant frequency shift induced by the attached molecule is smaller than the linewidth. (B) For an active resonator (resonator gain medium), the resonant shift is clearly resolved due to large separation of the shifted resonance from its original position in the spectrum. The narrow linewidth due to the optical gain (g) improves the sensor resolution by reducing the smallest detectable shift in the resonance.
Optical gain also improves the sensitivity and detection limit of mode splitting by decreasing the resonance linewidth which help resolve the two split modes which could have otherwise appeared as one broad resonance in the spectrum. For example, Figure 9 shows that gain medium helps decrease the resonance linewidth and reveal the mode splitting, which would otherwise remain unresolved without narrowing the linewidth using optical gain. A new self-heterodyne measurement of mode-splitting signals for nanoparticle and biomolecule detection has been demonstrated by operating the active resonator in lasing regime [66]. When a nanoparticle enters the mode volume of an active resonator pumped above lasing threshold, the single lasing mode splits into two, which generate a heterodyne beat note signal when mixed in a photo-receiver. The heterodyne beat note signals carry the information of mode splitting and vary with time as particles or molecules enter the resonant mode consecutively. Since the lasing mode has a linewidth much narrower than a passive mode by several orders of magnitude, it could resolve smaller mode-splitting. Moreover, in contrast to a passive resonator in which only one mode is monitored at one time, multiple lasing modes can be utilized simultaneously in an active resonator to achieve multi-wavelength sensing with single-wavelength pump. Thus, it relieves the requirement on laser source with multiple wavelengths to achieve multi-wavelength sensing. Moreover, in resonators with multiple lasing modes, one of the modes can capture an event (e.g., change in heterodyne beat frequency due to a binding particle) which is missed by the other one(s). This shows that multi-mode sensing not only provides extra information obtained at different wavelength but also improves the sensing response of the resonator since different modes cover different areas of the devices.
Figure 9.

Optical gain to enhance the sensing performance of optical resonators. (A) Typical transmission spectra of an active resonator (resonator doped with optical gain medium) when the excitation pump for the gain medium is off (left: a broad resonance) and on (right: two distinct narrow resonance [70]). (B) Detection of nanoparticles using mode-splitting in a microcavity laser. A beatnote is generated by photo-mixing the split lasing modes in a photoreceiver. The changes in beat frequency with time reflect the scatterer induced frequency splitting in the microlaser which indicates a scatterer entering the laser mode volume. If a multimode microlaser is used, each lasing mode undergoes splitting with the splitting amount depending on the overlap of the scatterer with the volume of the lasing mode. Using a multimode laser reduces the possibility of missing a binding scatterer since one splitting signal could capture a binding event that might have been missed by the other one (lower right panel) adapted from [66].
5. Enhancement mechanisms by localizing the resonant light field
5.1. Plasmon enhancements
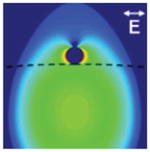
An entirely new approach to enhancing the sensitivity of WGM biosensors utilizes the fact that the frequency shift signal produced by a protein or nanoparticle binding to the microcavity is in proportion to the intensity ~E2(r0) encountered at the binding site r0 [147], see Eq (2). Any mechanism that can amplify the field intensity at the binding site while maintaining high Q factor will therefore produce a boost in the frequency shift signal, dramatically increasing the sensitivity in single molecule detection. Hot spots of high field intensities can be generated by evanescent coupling of the microcavity resonance to a plasmonic nanoantenna, Figure 10. WGM evanescent excitation of plasmon resonances, for example in a gold nanoparticle, can produce very large field enhancements. Many nanoantenna geometries can be explored for this purpose and their designs are similar to nanostructures that are investigated in surface enhanced Raman spectroscopy (SERS) [208]. Examples for nanoantennas commonly investigated in SERS are nanoparticle or nanoshell dimers [209] and bowtie antennas [210]. Different from SERS, which seeks to enhance the far-field scattering signal, WGM biosensing relies entirely on enhancing the near-field intensity. In fact it is necessary to minimize the scattering loss to maintain high-Q factor which is required for sensitive biomolecular detection. Through careful choice of WGM wavelength it is indeed possible to enhance the near field intensity at the nanoantenna site while minimizing scattering loss. Simulations, theory and experiments indicate that by detuning the microcavity resonance from the plasmon resonance an overall boost in sensitivity by several orders of magnitude is attainable [147, 148, 211, 212]. Indeed, first experimental reports indicate such dramatic sensitivity enhancements [108, 147–149].
Figure 10.

Plasmonic nanoantennas coupled to microcavities enhance sensitivity in biodetection. (A) A molecule binding to a plasmonic nanoantenna coupled to a WGM microcavity experiences field strengths that are enhanced in proportion to E2/E02, boosting the frequency shift upon binding [147]. (B) Up to three orders of sensitivity enhancement has been predicted for protein detection with a nanorod coupled to a toroidal cavity, reprinted with permission from [58], copyright (2011), American Institute of Physics.
The first demonstrations of this plasmon-enhanced microcavity detection scheme utilized a random nanoparticle layer to generate hot spots of high field intensity after coupling to a WGM microsphere cavity [147, 148]. High near-field enhancements were obtained by excitation of a WGM at optimal wavelength. It can be shown that the optimal WGM resonance wavelength is close to the plasmon resonance but significantly detuned from it to limit scattering loss. In theory, optimized plasmon coupling can produce near field enhancements up to three orders in magnitude, increasing the frequency shift signal for detecting a protein molecule and bringing label-free single molecule detection within reach [58, 213]. For example, a nanorod immobilized on a microtoroid will boost the frequency shift signal obtained for binding of a single BSA molecule into the MHz-range, which is more than an order of magnitude larger than the expected measurement noise [58]. Other demonstrations for plasmon enhanced frequency shifts have utilized plasmon nanoshells optically trapped with the WGM and delivered towards another gold nanoparticle for several-fold more sensitive detection of the nanoshell [149]. Recently it has also been shown that sensitivity for virus detection can be enhanced with a plasmon-coupled microcavity [108].
The large near field enhancements in a random nanoparticle layer were proposed to be capable of also optically trapping single protein molecules, producing femto-molar sensitivity levels in μl-scale sample volumes [148]. In other demonstrations, the high field strengths of WGMs [214, 215] as well as WGMs coupled to nanoparticles were used to enhance the far-field SERS scattering signal [216], without any utility in boosting the actual WGM frequency shift signal, however. Furthermore, enhanced evanescent coupling to a WGM with the help of a plasmonic nanoparticle has been reported [217]. Interestingly, hybrid photonic plasmonic microcavity structures promise ultra high sensitivity not only in biosensing but also in cavity-QED experiments [213].
It should be noted that microcavities have also been used for the excitation of surface plasmon polaritions (SPP) in a continuous metal film coated on a micodisc-shaped cavity [218]. Such high-Q SPP-WGM has also been predicted in a metal coated WGM resonator [219]. Here, an exterior surface mode possesses high quality factors at room temperature, and can be efficiently excited by a tapered fiber. Furthermore, metal films have been shown to enhance prism-based coupling to WGMs [220]. It was also shown theoretically that a nanosized scatterer immobilized on the microresonator surface enables the efficient coupling to WGMs from a free space beam [221]. Another configuration for realizing hybrid photonic plasmonic microcavities are microring silicon resonators optically coupled to a metal microdisk located inside the ring. Here, optical energy is greatly concentrated in the narrow gap between the metal and the silicon ring [222]. Also a microring resonator with a metal strip has been shown to efficiently couple to a plasmonic nanostrip [223].
5.2. Other enhancement mechanisms based on field confinement
Other non-plasmonic enhancements of microcavity biosensing rely for example on confining light in dielectric slotted ring resonators [224] and slotted photonic crystals where high field amplitudes at the slot are accessible for molecules. Slotted photonic crystal cavities were for example used to detect bound molecules at low surface mass densities [197]. Also, slotted ring resonators have been utilized for improved detection limits, for example within a 100 nm slot [122]. In a packaged slot-waveguide ring resonator sensor array, a surface mass density detection limit down to 0.9 pg/mm2 has been demonstrated [174]. Enhanced sensitivity of a spherical microcavity biosensor was demonstrated by confining the WGM near the surface using a subwavelength high refractive index coating [152].
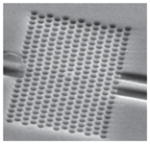
Multiple-hole defects have been used to improve the sensitivity in silicon slab photonic crystal cavities [196] by increasing the surface area available for label-free detection without degrading the quality factor. Compared to photonic crystals with L3 defects, adding multiple hole defects into photonic crystal cavities enabled a 44% increase in detection sensitivity. Refractive index sensitivity of guided resonances in photonic crystal slabs could be enhanced by three-fold for suspended slab designs, in contrast to designs with a slab resting over a substrate. Spectral sensitivity values are additionally shown to be unaffected by quality factor reductions, which are common to fabricated photonic crystal nanostructures [225].
A cluster of evanescently coupled 2D WGM optical microcavities (termed “photonic molecules”) were introduced for biosensing with enhanced sensitivity [211]. Here, photonic molecules supporting modes with narrow linewidths and wide mode spacing show enhanced sensitivity to the changes in the dielectric constant of their environment and to the presence of individual subwavelength-sized nano-particles in the evanescent-field region.
6. Optical manipulation for biosensing
WGM resonators exhibit strong evanescent field gradients which can be used for trapping of nanoparticles by optical forces. Using light to apply force has applications in biosensing for accurately determining the size of a trapped particle, extracting information about the particle-to-surface interaction and for speeding up detection by breaking diffusion limits [32]. For example, nanoparticles that diffuse within the reach of the evanescent field of the microsphere resonator are pulled towards the sensor surface by optical gradient forces similar to those in optical tweezers. The nanoparticles are drawn towards the equatorial region of the microsphere where the evanescent field intensity is maximal and where they tend to accumulate at the sensor surface. In the case of a low affinity or a low density of binding sites the nanoparticles do not bind but instead remain trapped within the evanescent field and are now propelled around the microsphere resonator. The driving force for this orbital motion is the absorption and scattering of light. While trapped, the nanoparticle visits the sensor surface many times due to Brownian motion during its circumnavigation. As a result, binding is essentially assured once trapped and this mechanism can be used to considerably speed up the binding rate at extremely low concentrations [32]. Furthermore by recording the resonance wavelength fluctuations of the trapped nanoparticle it is possible to accurately determine the trapping potential and the forces that arise at the sensor surface (Figure 11). Similar to an atomic force microscope (afm), the random tapping of an optically trapped nanoparticle (in afm: controlled tapping by a nanotip) is thus used to measure forces acting on the nanoparticle at the sensor interface [32]. The interaction between a trapped nanoparticle and a WGM can be complex due to modification of the WGM field with position of the nanoparticle [158]. Building up on these works, it has been shown recently that plasmon enhancements in WGM coupled nanoparticles can provide trapping potentials strong enough for trapping protein molecules at the sites of highest sensitivity [148].
Figure 11.

Trapping nanoparticles using gradient force stemming from highly localized field intensities in optical resonators. (A) A nanoparticle is trapped and propelled along the equatorial plane of a fiber taper coupled microsphere, where the fundamental WGM resides, adapted from [32]. (B) A waveguide coupled optofluidic ring resonator is used to manipulate, transport and trap nanoparticles; the particles either pass through the resonator (indicated by particles in green) under off-resonant condition or get trapped on the ring resonator under resonant condition (indicated by particles in red), with permission from [29], reproduced by permission of The Royal Society of Chemistry.
In other examples, effective trapping of 500 nm-diameter polystyrene beads at mW coupled power level was achieved with micron-sized silicon ring resonators propelling the particles along the resonator with velocities of up to 100 μm/s [226]. Moreover particles can be routed on and off the resonating structures with applications in developing all optical microintegrated particle switches and add drop devices [29, 227], see Figure 11.
In another report, direct measurement of the biomechanical stress induced by a live cell during endocytosis of a microcavity is reported [128]. Fluorescent dye-doped polystyrene microspheres were used as microscopic remote optical sensors applying WGMs as transducer mechanism. Monitoring of the WGMs throughout the incorporation of the microsphere into the cell enabled the determination of the deformation experienced by the microsphere.
Very recently, a photonic crystal microcavity was developed as “nanotweezer” that can trap and release on-command Wilson disease proteins, quantum dots, and 22 nm polymer particles with a temperature rise less than similar to 0.3 K, which is below the point where unwanted fluid mechanical effects will prevent trapping or damage biological targets [228].
7. Discussions and outlook
In this article we have reviewed the state-of-the-art sensing schemes using optical resonator for ultra-sensitive detection of molecules, viruses, and particles. Although still in the early stage of research and development, optical resonators may become very useful for many applications ranging from early disease diagnostics, environmental monitoring and pharmaceutical analysis. Thanks for the effort devoted to this emerging area, high-Q resonators have shown promise for commercialization with the superior sensitivity of single particle/molecule/virus detection. To further enhance the sensing performance of optical resonators, different enhancement mechanisms, such as plasmonic effect and active gain medium, have been pursued; detection of single virus and nanoparticle has been demonstrated. One of the other key issues to push such a promising sensing platform closer to application is the sample collection. An effective way to deliver trace amounts of samples to the proximity of the miniature resonator in various environments is of great importance to reduce the detection time and utilize the unprecedented sensing capability provided by the device. Integrating the resonators with appropriately designed fluidic channels or digital microfluidics [229] will become important in this respect. It is also possible to resolve such an issue by combining super-hydrophobic artificial structure, which can help drive and concentrate molecules over a sensing area in nano-scale, in the design of resonator based sensing system. Specifically the super-hydrophobic substrate enables low adhesion forces between the solution and surface, forcing the solution drop to slide on the surface. With appropriate design of the system, the resonator could be set in a position where ultimately the solution with molecules will concentrate on and precipitate after evaporation; subsequently, trace amount of molecules can be detected by the microresonator [230].
In order to achieve selective sensing, various surface functionalization techniques have been developed and used in optical resonators. Sometimes, the degradation of the Q-factor resulting from the surface funcationlization process deteriorates the sensitivity of the resonators. An effective method to recover the Q-factor using active gain medium could be one of the options to maintain the sensing performance provided by the high-Q micro-resonators.
The limit of detection for a microcavity biosensor is also governed, in part, by the accuracy of the surface chemistry, i.e., the number of accessible binding sites. Ideally, the number of binding sites should be determined by using the sensor itself to monitor the functionalization procedure. We anticipate that future studies will use such and other calibration approaches to provide further insight into the chemical aspects of biodetection, especially when performed in complex samples such as serum or lysate [54].
As a self-referencing sensing scheme recently demonstrated for detection and measurement of individual nanoparticles and virions, mode-splitting method provides new capabilities, such as single-shot size measurement of individual nanoparticles, which has not been reported for single-resonance shift based sensing method following reactive sensing principle. There has been ongoing debate on mode splitting and reactive sensing principle referring to their advantages and the conditions under which one is favored over the other one. More investigation could be done to develop guideline making use of full advantages provided by optical resonators for future studies and applications.
Until now most optical resonators utilized for sensing applications are usually fabricated from silica or silicon. Investigating WGM resonators made from other materials could benefit the sensing field. For example, the small index contrast between silica (~1.46) and water (~1.33) increase the radiation loss of the resonators in aqueous environment and makes it challenging to achieve high-Q which is critical to maintain the ultra-high sensitivity. One remedy is to increase the size of the resonator, which, however, increases the volume of the optical mode and decrease the sensitivity. Replacing silica with some high refractive-index materials will help achieve high-Q resonators with small size. In this respect, the engineering of planar photonic crystal cavities in silicon or silicon-nitrate material systems will become more and more prevalent as fabrication tools and protocols for making high Q/V cavities become more pervasive. In the future one may even see 3D photonic crystal cavities [231] (or 2D disordered photonic crystals [201, 232]) that localize light in ultra-high Q/V resonators for biosensing applications.
Moreover, integrating WGM resonator with other existing technique, such as microfluidic platforms and silicon photonics will provide more advance functionalities for biosensing. In contrast to conventional enzyme-linked-immunosorbent assays (ELISAs), a sensing technique relying on labeling and often fluorescent readout by imaging, the emerging WGM resonators have been approved as a simple, ultra-sensitive and stand-alone sensing platform without request for external labeling and imaging systems. The diversity of the designs of WGM resonators has made it possible to tailor the geometries of the sensors for different applications. The developments of WGM resonators have paved the way for label-free detection at the single molecule level with the potential to replace or complement other existing sensing platforms. A very important task of any integrated microfluidics platform will be the rejection of noise due to temperature and refractive index fluctuations. Here, differential measurements for example within the same microcavity might be a solution.
The combination of plasmonic nanoantennas with the local density of states provided in microcavities promise novel physics that will guide the development of a highly sensitive approach [10]. In particular, we believe that hybrid photonic-plasmonic microcavities will provide the ability to observe and manipulate single biomolecules in real-time. This will enable groundbreaking experiments in the life sciences, allowing studies on the mechanisms of molecular machines. We also believe that hybrid photonic-plasmonic biosensor systems based on random nanoparticle assemblies [148] will be used to study more complex biological reactions such as DNA transcription and protein translation reactions. Using a random approach for such assays guarantees signal readout where otherwise matching a single nanoantenna with a complex biological reaction might be difficult to achieve. Ultimately we envision the use of molecular machines such as DNA polymerases or Ribosomes in photonic-plasmonic devices that sequence or even manufacture DNA and protein molecules. The high field intensities at the site of a nanoantenna coupled to a microcavity can further enable the observation of non-linear effects in biomaterials. It is also conceivable that mechanical resonances in biological structures could be probed with plasmon-coupled microcacvities given their superior sensitivity.
In clinical diagnostics, the integration of photonic-plasmonic optical resonators on microchips will enable the next-generation label-free biosensors envisioned in the introduction of this article. By exploring various resonator geometries in combination with free space coupling, we foresee many applications including the monitoring of live cells and engineered tissue [233].
We also anticipate that light field and temperature gradients of plasmon-coupled microcavities will enable technologies to control flow fields in lab-on-chip devices and manipulate analyte molecules [234, 235]. We also believe that new materials such as graphene will find applications in plasmon-enhanced detection. In the future we also predict that not only antibody+antigen reactions will be used for molecular detection. Instead, complete networks of interacting molecules will be designed to produce specific pathways that mimic the specificity and sensitivity of the cell. The output of such networks will be monitored with microcavities, implementing various cellular functions on chip-scale devices [236].
Acknowledgments
Frank Vollmer acknowledges support from the Max Planck Society as well as NIH R01 Grant No. 1R01GM095906-01 awarded through the National Institutes of General Medicine. Lan Yang acknowledges support from the U.S. National Science Foundation (Grant No. 0954941) and the U. S. Army Research Office (Grant number W911NF1210026).
References
- 1.Anker JN, Hall WP, Lyandres O, Shah NC, Zhao J, Van Duyne RP. Biosensing with plasmonic nanosensors. Nat Mater. 2008;7:442–53. doi: 10.1038/nmat2162. [DOI] [PubMed] [Google Scholar]
- 2.Ymeti A, Greve J, Lambeck PV, Wink T, van Hovell S, Beumer TAM, Wijn RR, Heideman RG, Subramaniam V, Kanger JS. Fast, ultrasensitive virus detection using a young interferometer sensor. Nano Lett. 2007;7:394–7. doi: 10.1021/nl062595n. [DOI] [PubMed] [Google Scholar]
- 3.Vollmer F, Arnold S, Keng D. Single virus detection from the reactive shift of a whispering-gallery mode. Proc Natl Acad Sci USA. 2008;105:20701–4. doi: 10.1073/pnas.0808988106. [DOI] [PMC free article] [PubMed] [Google Scholar]
- 4.Naik AK, Hanay MS, Hiebert WK, Feng XL, Roukes ML. Towards single-molecule nanomechanical mass spectrometry. Nat Nanotechnol. 2009;4:445–50. doi: 10.1038/nnano.2009.152. [DOI] [PMC free article] [PubMed] [Google Scholar]
- 5.Patolsky F, Zheng GF, Hayden O, Lakadamyali M, Zhuang XW, Lieber CM. Electrical detection of single viruses. Proc Natl Acad Sci USA. 2004;101:14017–22. doi: 10.1073/pnas.0406159101. [DOI] [PMC free article] [PubMed] [Google Scholar]
- 6.Arlett JL, Myers EB, Roukes ML. Comparative advantages of mechanical biosensors. Nat Nanotechnol. 2011;6:203–15. doi: 10.1038/nnano.2011.44. [DOI] [PMC free article] [PubMed] [Google Scholar]
- 7.Waggoner PS, Craighead HG. Micro- and nanomechanical sensors for environmental, chemical, and biological detection. Lab Chip. 2007;7:1238–55. doi: 10.1039/b707401h. [DOI] [PubMed] [Google Scholar]
- 8.Patolsky F, Zheng G, Lieber CM. Nanowire sensors for medicine and the life sciences. Nanomedicine. 2006;1:51–65. doi: 10.2217/17435889.1.1.51. [DOI] [PubMed] [Google Scholar]
- 9.Li J, Lu YJ, Ye Q, Cinke M, Han J, Meyyappan M. Carbon nanotube sensors for gas and organic vapor detection. Nano Lett. 2003;3:929–33. [Google Scholar]
- 10.Baaske M, Vollmer F. Optical resonator biosensors: molecular diagnostic and nanoparticle detection on an integrated platform. ChemPhysChem. 2012;13:427–36. doi: 10.1002/cphc.201100757. [DOI] [PubMed] [Google Scholar]
- 11.Wilson K, Vollmer F. Whispering Gallery Mode Resonator Biosensors. Springer Verlag; Dordrecht, Netharlands: 2012. [Google Scholar]
- 12.Arnold S, Khoshsima M, Teraoka I, Holler S, Vollmer F. Shift of whispering-gallery modes in microspheres by protein adsorption. Opt Lett. 2003;28:272–4. doi: 10.1364/ol.28.000272. [DOI] [PubMed] [Google Scholar]
- 13.Vollmer F, Braun D, Libchaber A, Khoshsima M, Teraoka I, Arnold S. Protein detection by optical shift of a resonant microcavity. Appl Phys Lett. 2002;80:4057–9. [Google Scholar]
- 14.Burg TP, Godin M, Knudsen SM, Shen W, Carlson G, Foster JS, Babcock K, Manalis SR. Weighing of biomolecules, single cells and single nanoparticles in fluid. Nature. 2007;446:1066–9. doi: 10.1038/nature05741. [DOI] [PubMed] [Google Scholar]
- 15.Patolsky F, Zheng GF, Lieber CM. Fabrication of silicon nanowire devices for ultrasensitive, label-free, real-time detection of biological and chemical species. Nat Protoc. 2006;1:1711–24. doi: 10.1038/nprot.2006.227. [DOI] [PubMed] [Google Scholar]
- 16.Hunt HK, Soteropulos C, Armani AM. Bioconjugation strategies for microtoroidal optical resonators. Sensors. 2010;10:9317–36. doi: 10.3390/s101009317. [DOI] [PMC free article] [PubMed] [Google Scholar]
- 17.Zijlstra P, Paulo PMR, Orrit M. Optical detection of single non-absorbing molecules using the surface plasmon resonance of a gold nanorod. Nat Nanotechnol. 2012;7:379–82. doi: 10.1038/nnano.2012.51. [DOI] [PubMed] [Google Scholar]
- 18.Ament I, Prasad J, Henkel A, Schmachtel S, Sonnichsen C. Single unlabeled protein detection on individual plasmonic nano-particles. Nano Lett. 2012;12:1092–5. doi: 10.1021/nl204496g. [DOI] [PubMed] [Google Scholar]
- 19.Curreli M, Zhang R, Ishikawa FN, Chang HK, Cote RJ, Zhou C, Thompson ME. Real-time, label-free detection of biological entities using nanowire-based FETs. IEEE Trans Nanotechnol. 2008;7:651–67. [Google Scholar]
- 20.Wang SP, Shan XN, Patel U, Huang XP, Lu J, Li JH, Tao NJ. Label-free imaging, detection, and mass measurement of single viruses by surface plasmon resonance. Proc Natl Acad Sci USA. 2010;107:16028–32. doi: 10.1073/pnas.1005264107. [DOI] [PMC free article] [PubMed] [Google Scholar]
- 21.Ilic B, Yang Y, Craighead HG. Virus detection using nano-electromechanical devices. Appl Phys Lett. 2004;85:2604–6. [Google Scholar]
- 22.Fan XD, White IM. Optofluidic microsystems for chemical and biological analysis. Nat Photonics. 2011;5:591–7. doi: 10.1038/nphoton.2011.206. [DOI] [PMC free article] [PubMed] [Google Scholar]
- 23.Qavi AJ, Washburn AL, Byeon JY, Bailey RC. Label-free technologies for quantitative multiparameter biological analysis. Anal Bioanal Chem. 2009;394:121–35. doi: 10.1007/s00216-009-2637-8. [DOI] [PMC free article] [PubMed] [Google Scholar]
- 24.Iqbal M, Gleeson MA, Spaugh B, Tybor F, Gunn WG, Hochberg M, Baehr-Jones T, Bailey RC, Gunn LC. Label-free biosensor arrays based on silicon ring resonators and high-speed optical scanning instrumentation. IEEE J Sel Top Quantum Electron. 2010;16:654–61. [Google Scholar]
- 25.Roy S, Prasad M, Topolancik J, Vollmer F. All-optical switching with bacteriorhodopsin protein coated microcavities and its application to low power computing circuits. J Appl Phys. 2010;107:053115-1–9. [Google Scholar]
- 26.Guerra DN, Bulsara AR, Ditto WL, Sinha S, Murali K, Mohanty P. A noise-assisted reprogrammable nanomechanical logic gate. Nano Lett. 2010;10:1168–71. doi: 10.1021/nl9034175. [DOI] [PubMed] [Google Scholar]
- 27.Huang Y, Duan XF, Cui Y, Lauhon LJ, Kim KH, Lieber CM. Logic gates and computation from assembled nanowire building blocks. Science. 2001;294:1313–7. doi: 10.1126/science.1066192. [DOI] [PubMed] [Google Scholar]
- 28.Lukosz W. Principles and sensitivities of integrated optical and surface-plasmon sensors for direct affinity sensing and immunosensing. Biosens Bioelectron. 1991;6:215–25. [Google Scholar]
- 29.Yang AHJ, Erickson D. Optofluidic ring resonator switch for optical particle transport. Lab Chip. 2010;10:769–74. doi: 10.1039/b920006a. [DOI] [PubMed] [Google Scholar]
- 30.Zhu JG, Ozdemir SK, Xiao YF, Li L, He LN, Chen DR, Yang L. On-chip single nanoparticle detection and sizing by mode splitting in an ultrahigh-Q microresonator. Nat Photonics. 2010;4:46–9. [Google Scholar]
- 31.Lin SY, Crozier KB. Planar silicon microrings as wavelength-multiplexed optical traps for storing and sensing particles. Lab Chip. 2011;11:4047–51. doi: 10.1039/c1lc20574a. [DOI] [PubMed] [Google Scholar]
- 32.Arnold S, Keng D, Shopova SI, Holler S, Zurawsky W, Vollmer F. Whispering gallery mode carousel – a photonic mechanism for enhanced nanoparticle detection in biosensing. Opt Express. 2009;17:6230–8. doi: 10.1364/oe.17.006230. [DOI] [PubMed] [Google Scholar]
- 33.Gorodetsky ML, Savchenkov AA, Ilchenko VS. Ultimate Q of optical microsphere resonators. Opt Lett. 1996;21:453–5. doi: 10.1364/ol.21.000453. [DOI] [PubMed] [Google Scholar]
- 34.Collot L, Lefevreseguin V, Brune M, Raimond JM, Haroche S. Very high-Q whispering-gallery mode resonances observed on fused-silica microspheres. Europhys Lett. 1993;23:327–34. [Google Scholar]
- 35.Braginsky VB, Mitrofanov VP, Panov VI. Systems with Small Dissipation. University of Chicago Press; Chicago, USA: 1985. [Google Scholar]
- 36.Yoshie T, Tang LL, Su SY. Optical microcavity: sensing down to single molecules and atoms. Sensors. 2011;11:1972–91. doi: 10.3390/s110201972. [DOI] [PMC free article] [PubMed] [Google Scholar]
- 37.Chiasera A, Dumeige Y, Feron P, Ferrari M, Jestin Y, Conti GN, Pelli S, Soria S, Righini GC. Spherical whispering-gallery-mode microresonators. Laser Photon Rev. 2010;4:457–82. [Google Scholar]
- 38.Vollmer F, Arnold S. Whispering-gallery-mode biosensing: label-free detection down to single molecules. Nature Meth. 2008;5:591–6. doi: 10.1038/nmeth.1221. [DOI] [PubMed] [Google Scholar]
- 39.Vahala KJ. Optical microcavities. Nature. 2003;424:839–46. doi: 10.1038/nature01939. [DOI] [PubMed] [Google Scholar]
- 40.Barrios CA. Integrated microring resonator sensor arrays for labs-on-chips. Anal Bioanal Chem. 2012;403:1467–75. doi: 10.1007/s00216-012-5937-3. [DOI] [PubMed] [Google Scholar]
- 41.Zhu H, White IM, Suter JD, Dale PS, Fan X. Analysis of biomolecule detection with optofluidic ring resonator sensors. Opt Express. 2007;15:9139–46. doi: 10.1364/oe.15.009139. [DOI] [PubMed] [Google Scholar]
- 42.Gohring JT, Dale PS, Fan XD. Detection of HER2 breast cancer biomarker using the opto-fluidic ring resonator biosensor. Sens Actuator B-Chem. 2010;146:226–30. [Google Scholar]
- 43.Knight JC, Cheung G, Jacques F, Birks TA. Phase-matched excitation of whispering-gallery-mode resonances by a fiber taper. Opt Lett. 1997;22:1129–31. doi: 10.1364/ol.22.001129. [DOI] [PubMed] [Google Scholar]
- 44.Laine JP, Little BE, Haus HA. Etch-eroded fiber coupler for whispering-gallery-mode excitation in high-Q silica micro-spheres. IEEE Photonics Technol Lett. 1999;11:1429–30. [Google Scholar]
- 45.Cai M, Painter O, Vahala KJ. Observation of critical coupling in a fiber taper to a silica-microsphere whispering-gallery mode system. Phys Rev Lett. 2000;85:74–7. doi: 10.1103/PhysRevLett.85.74. [DOI] [PubMed] [Google Scholar]
- 46.Warken F, Rauschenbeutel A, Bartholomaus T. Fiber pulling profits from precise positioning. Photon Spect. 2008;42:73–5. [Google Scholar]
- 47.Vanier F, La Mela C, Hayat A, Peter YA. Intrinsic quality factor determination in whispering gallery mode microcavities using a single Stokes parameters measurement. Opt Express. 2011;19:23544–53. doi: 10.1364/OE.19.023544. [DOI] [PubMed] [Google Scholar]
- 48.Lutti J, Langbein W, Borri P. A monolithic optical sensor based on whispering-gallery modes in polystyrene microspheres. Appl Phys Lett. 2008;93:151103-1–4. [Google Scholar]
- 49.Huckabay HA, Dunn RC. Whispering gallery mode imaging for the multiplexed detection of biomarkers. Sens Actuator B-Chem. 2011;160:1262–7. [Google Scholar]
- 50.De Vos K, Bartolozzi I, Schacht E, Bienstman P, Baets R. Silicon-on-Insulator microring resonator for sensitive and label-free biosensing. Opt Express. 2007;15:7610–5. doi: 10.1364/oe.15.007610. [DOI] [PubMed] [Google Scholar]
- 51.Washburn AL, Luchansky MS, Bowman AL, Bailey RC. Quantitative, label-free detection of five protein biomarkers using multiplexed arrays of silicon photonic microring resonators. Anal Chem. 2010;82:69–72. doi: 10.1021/ac902451b. [DOI] [PMC free article] [PubMed] [Google Scholar]
- 52.Delezoide C, Salsac M, Lautru J, Leh H, Nogues C, Zyss J, Buckle M, Ledoux-Rak I, Nguyen CT. Vertically coupled polymer microracetrack resonators for label-free biochemical sensors. IEEE Photonics Technol Lett. 2012;24:270–2. [Google Scholar]
- 53.Ksendzov A, Lin Y. Integrated optics ring-resonator sensors for protein detection. Opt Lett. 2005;30:3344–6. doi: 10.1364/ol.30.003344. [DOI] [PubMed] [Google Scholar]
- 54.Washburn AL, Bailey RC. Photonics-on-a-chip: recent advances in integrated waveguides as enabling detection elements for real-world, lab-on-a-chip biosensing applications. Analyst. 2011;136:227–36. doi: 10.1039/c0an00449a. [DOI] [PMC free article] [PubMed] [Google Scholar]
- 55.Jokerst N, Royal M, Palit S, Luan L, Dhar S, Tyler T. Chip scale integrated microresonator sensing systems. J Biophotonics. 2009;2:212–26. doi: 10.1002/jbio.200910010. [DOI] [PubMed] [Google Scholar]
- 56.White IM, Oveys H, Fan X. Liquid-core optical ring-resonator sensors. Opt Lett. 2006;31:1319–21. doi: 10.1364/ol.31.001319. [DOI] [PubMed] [Google Scholar]
- 57.Vollmer F, Arnold S, Braun D, Teraoka I, Libchaber A. Multiplexed DNA quanti. cation by spectroscopic shift of two micro-sphere cavities. Biophys J. 2003;85:1974–9. doi: 10.1016/S0006-3495(03)74625-6. [DOI] [PMC free article] [PubMed] [Google Scholar]
- 58.Swaim JD, Knittel J, Bowen WP. Detection limits in whispering gallery biosensors with plasmonic enhancement. Appl Phys Lett. 2011;99:243109–3. [Google Scholar]
- 59.Braginsky VB, Gorodetsky ML, Ilchenko VS. Quality-factor and nonlinear properties of optical whispering-gallery modes. Phys Lett A. 1989;137:393–7. [Google Scholar]
- 60.Weiss DS, Sandoghdar V, Hare J, Lefevreseguin V, Raimond JM, Haroche S. Splitting of High-Q mie modes induced by light backscattering in silica microspheres. Opt Lett. 1995;20:1835–7. doi: 10.1364/ol.20.001835. [DOI] [PubMed] [Google Scholar]
- 61.Gorodetsky ML, Pryamikov AD, Ilchenko VS. Rayleigh scattering in high-Q microspheres. J Opt Soc Am B-Opt Phys. 2000;17:1051–7. [Google Scholar]
- 62.Mazzei A, Goetzinger S, Menezes LD, Zumofen G, Benson O, Sandoghdar V. Controlled coupling of counterpropagating whispering-gallery modes by a single Rayleigh scatterer: a classical problem in a quantum optical light. Phys Rev Lett. 2007;99:173603-1–4. doi: 10.1103/PhysRevLett.99.173603. [DOI] [PubMed] [Google Scholar]
- 63.Borselli M, Johnson TJ, Painter O. Beyond the Rayleigh scattering limit in high-Q silicon microdisks: theory and experiment. Opt Express. 2005;13:1515–30. doi: 10.1364/opex.13.001515. [DOI] [PubMed] [Google Scholar]
- 64.Kippenberg TJ, Tchebotareva AL, Kalkman J, Polman A, Vahala KJ. Purcell-factor-enhanced scattering from Si nanocrystals in an optical microcavity. Phys Rev Lett. 2009;103:027406-1–4. doi: 10.1103/PhysRevLett.103.027406. [DOI] [PubMed] [Google Scholar]
- 65.Zhu JG, Ozdemir SK, He L, Chen DR, Yang L. Single virus and nanoparticle size spectrometry by whispering-gallery-mode microcavities. Opt Express. 2011;19:16195–206. doi: 10.1364/OE.19.016195. [DOI] [PubMed] [Google Scholar]
- 66.He L, Ozdemir SK, Zhu J, Kim W, Yang L. Detecting single viruses and nanoparticles using whispering gallery microlasers. Nat Nano. 2011;6:428–32. doi: 10.1038/nnano.2011.99. [DOI] [PubMed] [Google Scholar]
- 67.Lu T, Lee H, Chen T, Herchak S, Kim JH, Fraser SE, Flagan RC, Vahala K. High sensitivity nanoparticle detection using optical microcavities. Proc Natl Acad Sci USA. 2011;108:5976–9. doi: 10.1073/pnas.1017962108. [DOI] [PMC free article] [PubMed] [Google Scholar]
- 68.Ozdemir SK, Zhu JG, He LN, Yang L. Estimation of Purcell factor from mode-splitting spectra in an optical microcavity. Phys Rev A. 2011;83:033817-1–5. [Google Scholar]
- 69.Knittel J, McRae TG, Lee KH, Bowen WP. Interferometric detection of mode splitting for whispering gallery mode biosensors. Appl Phys Lett. 2010;97:123704-1–3. [Google Scholar]
- 70.He LN, Ozdemir SK, Zhu JG, Yang L. Ultrasensitive detection of mode splitting in active optical microcavities. Phys Rev A. 2010;82:053810-1–4. [Google Scholar]
- 71.Kim W, Ozdemir SK, Zhu JG, He LA, Yang L. Demonstration of mode splitting in an optical microcavity in aqueous environment. Appl Phys Lett. 2010;97:071111-1–3. [Google Scholar]
- 72.Kim W, Ozdemir SK, Zhu JG, Yang L. Observation and characterization of mode splitting in microsphere resonators in aquatic environment. Appl Phys Lett. 2011;98:141106-1–3. [Google Scholar]
- 73.Teraoka I. Resonance shifts of transverse-electric whispering gallery modes in a spheroidal resonator. Appl Optics. 2012;51:1101–8. doi: 10.1364/AO.51.001101. [DOI] [PubMed] [Google Scholar]
- 74.Teraoka I, Arnold S, Vollmer F. Perturbation approach to resonance shifts of whispering-gallery modes in a dielectric micro-sphere as a probe of a surrounding medium. J Opt Soc Am B-Opt Phys. 2003;20:1937–46. [Google Scholar]
- 75.Teraoka I, Arnold S. Enhancing the sensitivity of a whispering-gallery mode microsphere sensor by a high-refractive-index surface layer. J Opt Soc Am B-Opt Phys. 2006;23:1434–41. [Google Scholar]
- 76.Teraoka I, Arnold S. Theory of resonance shifts in TE and TM whispering gallery modes by nonradial perturbations for sensing applications. J Opt Soc Am B-Opt Phys. 2006;23:1381–9. [Google Scholar]
- 77.Teraoka I, Arnold S. Resonance shifts of counterpropagating whispering-gallery modes: degenerate perturbation theory and application to resonator sensors with axial symmetry. J Opt Soc Am B. 2009;26:1321–9. [Google Scholar]
- 78.Yi X, Xiao YF, Liu YC, Li BB, Chen YL, Li Y, Gong QH. Multiple-Rayleigh-scatterer-induced mode splitting in a high-Q whispering-gallery-mode microresonator. Phys Rev A. 2011;83:023803-1–8. [Google Scholar]
- 79.Yi X, Xiao YF, Li Y, Liu YC, Li BB, Liu ZP, Gong QH. Polarization-dependent detection of cylinder nanoparticles with mode splitting in a high-Q whispering-gallery microresonator. Appl Phys Lett. 2010;97:203705-1–3. [Google Scholar]
- 80.Zhu HY, White IM, Suter JD, Dale PS, Fan XD. Analysis of biomolecule detection with optofluidic ring resonator sensors. Opt Express. 2007;15:9139–46. doi: 10.1364/oe.15.009139. [DOI] [PubMed] [Google Scholar]
- 81.Lopez-Yglesias X, Gamba JM, Flagan RC. The physics of extreme sensitivity in whispering gallery mode optical biosensors. J Appl Phys. 2012;111:084701-1–11. [Google Scholar]
- 82.Luchansky MS, Bailey RC. Silicon photonic microring resonators for quantitative cytokine detection and T-cell secretion analysis. Anal Chem. 2010;82:1975–81. doi: 10.1021/ac902725q. [DOI] [PMC free article] [PubMed] [Google Scholar]
- 83.Luchansky MS, Bailey RC. Rapid, multiparameter profiling of cellular secretion using silicon photonic microring resonator arrays. J Am Chem Soc. 2011;133:20500–6. doi: 10.1021/ja2087618. [DOI] [PMC free article] [PubMed] [Google Scholar]
- 84.Luchansky MS, Washburn AL, McClellan MS, Bailey RC. Sensitive on-chip detection of a protein biomarker in human serum and plasma over an extended dynamic range using silicon photonic microring resonators and sub-micron beads. Lab Chip. 2011;11:2042–4. doi: 10.1039/c1lc20231f. [DOI] [PMC free article] [PubMed] [Google Scholar]
- 85.Washburn AL, Gunn LC, Bailey RC. Label-free quantitation of a cancer biomarker in complex media using silicon photonic microring resonators. Anal Chem. 2009;81:9499–506. doi: 10.1021/ac902006p. [DOI] [PMC free article] [PubMed] [Google Scholar]
- 86.Goddard JM, Erickson D. Bioconjugation techniques for micro-fluidic biosensors. Anal Bioanal Chem. 2009;394:469–79. doi: 10.1007/s00216-009-2731-y. [DOI] [PMC free article] [PubMed] [Google Scholar]
- 87.Wilson KA, Finch CA, Anderson P, Vollmer F, Hickman JJ. Whispering gallery mode biosensor quantification of fibronectin adsorption kinetics onto alkylsilane monolayers and interpretation of resultant cellular response. Biomaterials. 2012;33:225–36. doi: 10.1016/j.biomaterials.2011.09.036. [DOI] [PMC free article] [PubMed] [Google Scholar]
- 88.Qavi AJ, Bailey RC. Multiplexed detection and label-free quantitation of MicroRNAs using arrays of silicon photonic microring resonators. Angew Chem-Int Edit. 2010;49:4608–11. doi: 10.1002/anie.201001712. [DOI] [PMC free article] [PubMed] [Google Scholar]
- 89.Qavi AJ, Mysz TM, Bailey RC. Isothermal discrimination of single-nucleotide polymorphisms via real-time kinetic desorption and label-free detection of DNA using silicon photonic microring resonator arrays. Anal Chem. 2011;83:6827–33. doi: 10.1021/ac201659p. [DOI] [PMC free article] [PubMed] [Google Scholar]
- 90.Lin S, Lee AS-Y, Lin C-C, Lee C-K. Determination of binding constant and stoichiometry for antibody-antigen interaction with surface plasmon resonance. Curr Proteomics. 2006;3:271–82. [Google Scholar]
- 91.Marty MT, Sloan CDK, Bailey RC, Sligar SG. Nonlinear analyte concentration gradients for one-step kinetic analysis employing optical microring resonators. Anal Chem. 2012;84:5556–64. doi: 10.1021/ac300478f. [DOI] [PMC free article] [PubMed] [Google Scholar]
- 92.De Vos K, Girones J, Claes T, De Koninck Y, Popelka S, Schacht E, Baets R, Bienstman P. Multiplexed antibody detection with an array of silicon-on-insulator microring resonators. IEEE Photonics J. 2009;1:225–35. [Google Scholar]
- 93.Nuhiji E, Mulvaney P. Detection of unlabeled oligonucleotide targets using whispering gallery modes in single, fluorescent microspheres. Small. 2007;3:1408–14. doi: 10.1002/smll.200600676. [DOI] [PubMed] [Google Scholar]
- 94.Suter JD, White IM, Zhu HY, Shi HD, Caldwell CW, Fan XD. Label-free quantitative DNA detection using the liquid core optical ring resonator. Biosens Bioelectron. 2008;23:1003–9. doi: 10.1016/j.bios.2007.10.005. [DOI] [PubMed] [Google Scholar]
- 95.Washburn AL, Gomez J, Bailey RC. DNA-encoding to improve performance and allow parallel evaluation of the binding characteristics of multiple antibodies in a surface-bound immunoassay format. Anal Chem. 2011;83:3572–80. doi: 10.1021/ac200317z. [DOI] [PMC free article] [PubMed] [Google Scholar]
- 96.Qavi AJ, Kindt JT, Gleeson MA, Bailey RC. Anti-DNA:RNA antibodies and silicon photonic microring resonators: increased sensitivity for multiplexed microRNA detection. Anal Chem. 2011;83:5949–56. doi: 10.1021/ac201340s. [DOI] [PMC free article] [PubMed] [Google Scholar]
- 97.Zhu HY, Suter JD, White IM, Fan XD. Aptamer based microsphere biosensor for thrombin detection. Sensors. 2006;6:785–95. [Google Scholar]
- 98.Cheema MI, Mehrabani S, Hayat AA, Peter YA, Armani AM, Kirk AG. Simultaneous measurement of quality factor and wavelength shift by phase shift microcavity ring down spectroscopy. Opt Express. 2012;20:9090–8. doi: 10.1364/OE.20.009090. [DOI] [PubMed] [Google Scholar]
- 99.Zhu HY, White IM, Suter JD, Fan XD. Phage-based label-free biomolecule detection in an opto-fluidic ring resonator. Biosens Bioelectron. 2008;24:461–6. doi: 10.1016/j.bios.2008.04.028. [DOI] [PubMed] [Google Scholar]
- 100.Suter JD, Howard DJ, Shi HD, Caldwell CW, Fan XD. Label-free DNA methylation analysis using opto-fluidic ring resonators. Biosens Bioelectron. 2010;26:1016–20. doi: 10.1016/j.bios.2010.08.050. [DOI] [PubMed] [Google Scholar]
- 101.Weller A, Liu FC, Dahint R, Himmelhaus M. Whispering gallery mode biosensors in the low-Q limit. Appl Phys B-Lasers Opt. 2008;90:561–7. [Google Scholar]
- 102.Soteropulos CE, Hunt HK, Armani AM. Determination of binding kinetics using whispering gallery mode microcavities. Appl Phys Lett. 2011;99:103703-1–3. doi: 10.1063/1.3634023. [DOI] [PMC free article] [PubMed] [Google Scholar]
- 103.Xu DX, Densmore A, Delage A, Waldron P, McKinnon R, Janz S, Lapointe J, Lopinski G, Mischki T, Post E, Cheben P, Schmid JH. Folded cavity SOI microring sensors for high sensitivity and real time measurement of biomolecular binding. Opt Express. 2008;16:15137–48. doi: 10.1364/oe.16.015137. [DOI] [PubMed] [Google Scholar]
- 104.Topolancik J, Vollmer F. Photoinduced transformations in bac-teriorhodopsin membrane monitored with optical microcavities. Biophys J. 2007;92:2223–9. doi: 10.1529/biophysj.106.098806. [DOI] [PMC free article] [PubMed] [Google Scholar]
- 105.Scheler O, Kindt JT, Qavi AJ, Kaplinski L, Glynn B, Barry T, Kurg A, Bailey RC. Label-free, multiplexed detection of bacterial tmRNA using silicon photonic microring resonators. Biosens Bioelectron. 2012;36:56–61. doi: 10.1016/j.bios.2012.03.037. [DOI] [PMC free article] [PubMed] [Google Scholar]
- 106.Chakravarty S, Yi Z, Wei-Cheng L, Chen RT. Slow light engineering for high Q high sensitivity photonic crystal microcavity biosensors in silicon. Biosens Bioelectron. 2012;38:170–6. doi: 10.1016/j.bios.2012.05.016. [DOI] [PMC free article] [PubMed] [Google Scholar]
- 107.Armani AM, Kulkarni RP, Fraser SE, Flagan RC, Vahala KJ. Label-free, single-molecule detection with optical microcavities. Science. 2007;317:783–7. doi: 10.1126/science.1145002. [DOI] [PubMed] [Google Scholar]
- 108.Dantham VR, Holler S, Kolchenko V, Wan Z, Arnold S. Taking whispering gallery-mode single virus detection and sizing to the limit. Appl Phys Lett. 2012;101:043704-1–3. [Google Scholar]
- 109.Yang GM, White IM, Fan XD. An opto-fluidic ring resonator biosensor for the detection of organophosphorus pesticides. Sens Actuator B-Chem. 2008;133:105–12. [Google Scholar]
- 110.Zhu HY, Dale PS, Caldwell CW, Fan XD. Rapid and label-free detection of breast cancer biomarker CA15-3 in clinical human serum samples with optofluidic ring resonator sensors. Anal Chem. 2009;81:9858–65. doi: 10.1021/ac902437g. [DOI] [PubMed] [Google Scholar]
- 111.Yalcin A, Popat KC, Aldridge JC, Desai TA, Hryniewicz J, Chbouki N, Little BE, King O, Van V, Chu S, Gill D, Anthes-Washburn M, Unlu MS. Optical sensing of biomolecules using microring resonators. IEEE J Sel Top Quantum Electron. 2006;12:148–55. [Google Scholar]
- 112.Shi C, Mehrabani S, Armani AM. Leveraging bimodal kinetics to improve detection specificity. Opt Lett. 2012;37:1643–5. doi: 10.1364/OL.37.001643. [DOI] [PubMed] [Google Scholar]
- 113.Kirk JT, Fridley GE, Chamberlain JW, Christensen ED, Hochberg M, Ratner DM. Multiplexed inkjet functionalization of silicon photonic biosensors. Lab Chip. 2011;11:1372–7. doi: 10.1039/c0lc00313a. [DOI] [PubMed] [Google Scholar]
- 114.Biggs BW, Hunt HK, Armani AM. Selective patterning of Si-based biosensor surfaces using isotropic silicon etchants. J Colloid Interf Sci. 2012;369:477–81. doi: 10.1016/j.jcis.2011.11.082. [DOI] [PMC free article] [PubMed] [Google Scholar]
- 115.Mandal S, Goddard JM, Erickson D. A multiplexed optofluidic biomolecular sensor for low mass detection. Lab Chip. 2009;9:2924–32. doi: 10.1039/b907826f. [DOI] [PubMed] [Google Scholar]
- 116.Lee M, Fauchet PM. Two-dimensional silicon photonic crystal based biosensing platform for protein detection. Opt Express. 2007;15:4530–5. doi: 10.1364/oe.15.004530. [DOI] [PubMed] [Google Scholar]
- 117.Hanumegowda NM, Stica CJ, Patel BC, White I, Fan XD. Refractometric sensors based on microsphere resonators. Appl Phys Lett. 2005;87:201107-1–3. [Google Scholar]
- 118.Ren HC, Vollmer F, Arnold S, Libchaber A. High-Q micro-sphere biosensor – analysis for adsorption of rodlike bacteria. Opt Express. 2007;15:17410–23. doi: 10.1364/oe.15.017410. [DOI] [PubMed] [Google Scholar]
- 119.Lutti J, Langbein W, Borri P. High Q optical resonances of polystyrene microspheres in water controlled by optical tweezers. Appl Phys Lett. 2007;91:141116-1–3. [Google Scholar]
- 120.Ilchenko VS, Yao XS, Maleki L. Pigtailing the high-Q micro-sphere cavity: a simple fiber coupler for optical whispering-gallery modes. Opt Lett. 1999;24:723–5. doi: 10.1364/ol.24.000723. [DOI] [PubMed] [Google Scholar]
- 121.Ilchenko VS, Matsko AB. Optical resonators with whispering-gallery modes – Part II: applications. IEEE J Sel Top Quantum Electron. 2006;12:15–32. [Google Scholar]
- 122.Claes T, Molera JG, De Vos K, Schacht E, Baets R, Bienstman P. Label-Free Biosensing With a Slot-Waveguide-Based Ring Resonator in Silicon on Insulator. IEEE Photonics J. 2009;1:197–204. [Google Scholar]
- 123.Ramachandran A, Wang S, Clarke J, Ja SJ, Goad D, Wald L, Flood EM, Knobbe E, Hryniewicz JV, Chu ST, Gill D, Chen W, King O, Little BE. A universal biosensing platform based on optical micro-ring resonators. Biosens Bioelectron. 2008;23:939–44. doi: 10.1016/j.bios.2007.09.007. [DOI] [PubMed] [Google Scholar]
- 124.Chao CY, Fung W, Guo LJ. Polymer microring resonators for biochemical sensing applications. IEEE J Sel Top Quantum Electron. 2006;12:134–42. [Google Scholar]
- 125.Nitkowski A, Baeumner A, Lipson M. On-chip spectrophotometry for bioanalysis using microring resonators. Biomed Opt Express. 2011;2:271–7. doi: 10.1364/BOE.2.000271. [DOI] [PMC free article] [PubMed] [Google Scholar]
- 126.Francois A, Himmelhaus M. Whispering gallery mode biosensor operated in the stimulated emission regime. Appl Phys Lett. 2009;94:031101-1–3. [Google Scholar]
- 127.Himmelhaus M, Krishnamoorthy S, Francois A. Optical sensors based on whispering gallery modes in fluorescent microbeads: response to specific interactions. Sensors. 2010;10:6257–74. doi: 10.3390/s100606257. [DOI] [PMC free article] [PubMed] [Google Scholar]
- 128.Himmelhaus M, Francois A. In-vitro sensing of biomechanical forces in live cells by a whispering gallery mode biosensor. Biosens Bioelectron. 2009;25:418–27. doi: 10.1016/j.bios.2009.07.021. [DOI] [PubMed] [Google Scholar]
- 129.Yang J, Guo LJ. Optical sensors based on active microcavities. IEEE J Sel Top Quantum Electron. 2006;12:143–7. [Google Scholar]
- 130.Boyd RW, Heebner JE. Sensitive disk resonator photonic biosensor. Appl Optics. 2001;40:5742–7. doi: 10.1364/ao.40.005742. [DOI] [PubMed] [Google Scholar]
- 131.Schweinsberg A, Hocde S, Lepeshkin NN, Boyd RW, Chase C, Fajardo JE. An environmental sensor based on an integrated optical whispering gallery mode disk resonator. Sens Actuator B-Chem. 2007;123:727–32. [Google Scholar]
- 132.Pollinger M, O’Shea D, Warken F, Rauschenbeutel A. Ultra-high-Q tunable whispering-gallery-mode microresonator. Phys Rev Lett. 2009;103:053901-1–4. doi: 10.1103/PhysRevLett.103.053901. [DOI] [PubMed] [Google Scholar]
- 133.Smith EJ, Schulze S, Kiravittaya S, Mei YF, Sanchez S, Schmidt OG. Lab-in-a-Tube: detection of individual mouse cells for analysis in flexible split-wall microtube resonator sensors. Nano Lett. 2011;11:4037–42. doi: 10.1021/nl1036148. [DOI] [PubMed] [Google Scholar]
- 134.Harazim SM, Quinones VAB, Kiravittaya S, Sanchez S, Schmidt OG. Lab-in-a-tube: on-chip integration of glass opto-fluidic ring resonators for label-free sensing applications. Lab Chip. 2012;12:2649–55. doi: 10.1039/c2lc40275k. [DOI] [PubMed] [Google Scholar]
- 135.Block ID, Chan LL, Cunningham BT. Photonic crystal optical biosensor incorporating structured low-index porous dielectric. Sens Actuator B-Chem. 2006;120:187–93. [Google Scholar]
- 136.Qimin Q, Frank V, Ian BB, Parag BD, Ian F, Sindy T, Rob I, Marko L. Ultrasensitive On-Chip Photonic Crystal Nanobeam Sensor using Optical Bistability. Optical Society of America. 2011;2011:QThH6. [Google Scholar]
- 137.Erickson D, Mandal S, Yang AHJ, Cordovez B. Nanobiosensors: optofluidic, electrical and mechanical approaches to biomolecular detection at the nanoscale. Microfluid Nanofluid. 2008;4:33–52. doi: 10.1007/s10404-007-0198-8. [DOI] [PMC free article] [PubMed] [Google Scholar]
- 138.Bergstein DA, Ozkumur E, Wu AC, Yalcin A, Colson JR, Needham JW, Irani RJ, Gershoni JM, Goldberg BB, DeLisi C, Ruane MF, Unlu MS. Resonant cavity imaging: a means toward high-throughput label-free protein detection. IEEE J Sel Top Quantum Electron. 2008;14:131–9. doi: 10.1109/JSTQE.2007.913397. [DOI] [PMC free article] [PubMed] [Google Scholar]
- 139.Trupke M, Hinds EA, Eriksson S, Curtis EA, Moktadir Z, Kukharenka E, Kraft M. Microfabricated high-finesse optical cavity with open access and small volume. Appl Phys Lett. 2005;87 [Google Scholar]
- 140.Vollmer F, Fischer P. Ring-resonator-based frequency-domain optical activity measurements of a chiral liquid. Opt Lett. 2006;31:453–5. doi: 10.1364/ol.31.000453. [DOI] [PubMed] [Google Scholar]
- 141.Henze R, Seifert T, Ward J, Benson O. Tuning whispering gallery modes using internal aerostatic pressure. Opt Lett. 2011;36:4536–8. doi: 10.1364/OL.36.004536. [DOI] [PubMed] [Google Scholar]
- 142.Sumetsky M, Dulashko Y, Windeler RS. Optical microbubble resonator. Opt Lett. 2010;35:898–900. doi: 10.1364/OL.35.000898. [DOI] [PubMed] [Google Scholar]
- 143.Watkins A, Ward J, Wu YQ, Chormaic SN. Single-input spherical microbubble resonator. Opt Lett. 2011;36:2113–5. doi: 10.1364/OL.36.002113. [DOI] [PubMed] [Google Scholar]
- 144.Scheuer J, Sumetsky M. Optical-fiber microcoil waveguides and resonators and their applications for interferometry and sensing. Laser Photon Rev. 2011;5:465–78. [Google Scholar]
- 145.Sumetsky M. Optical fiber microcoil resonator. Opt Express. 2004;12:2303–16. doi: 10.1364/opex.12.002303. [DOI] [PubMed] [Google Scholar]
- 146.Xu F, Horak P, Brambilla G. Optical microfiber coil resonator refractometric sensor. Opt Express. 2007;15:7888–93. doi: 10.1364/oe.15.007888. [DOI] [PubMed] [Google Scholar]
- 147.Santiago-Cordoba MA, Boriskina SV, Vollmer F, Demirel MC. Nanoparticle-based protein detection by optical shift of a resonant microcavity. Appl Phys Lett. 2011;99:073701-1–4. [Google Scholar]
- 148.Santiago-Cordoba MA, Cetinkaya M, Boriskina SV, Vollmer F, Demirel MC. Ultrasensitive detection of a protein by optical trapping in a photonic-plasmonic microcavity. J Biophotonics. 2012;5:629–38. doi: 10.1002/jbio.201200040. [DOI] [PubMed] [Google Scholar]
- 149.Shopova SI, Rajmangal R, Holler S, Arnold S. Plasmonic enhancement of a whispering-gallery-mode biosensor for single nanoparticle detection. Appl Phys Lett. 2011;98 [Google Scholar]
- 150.Richtmyer RD. Dielectric resonators. J Appl Phys. 1939;10:391–8. [Google Scholar]
- 151.Lan Y, Kerry V. Gain functionalization of silica microresonators. Opt Lett. 2003;28:592–4. doi: 10.1364/ol.28.000592. [DOI] [PubMed] [Google Scholar]
- 152.Gaathon O, Culic-Viskota J, Mihnev M, Teraoka I, Arnold S. Enhancing sensitivity of a whispering gallery mode biosensor by subwavelength confinement. Appl Phys Lett. 2006;89:223901-1–3. [Google Scholar]
- 153.Armani AM, Vahala KJ. Heavy water detection using ultra-high-Q microcavities. Opt Lett. 2006;31:1896–8. doi: 10.1364/ol.31.001896. [DOI] [PubMed] [Google Scholar]
- 154.Nussenzveig HM. Diffraction Effects in Semiclassical Scattering. NY, USA: Cambridge University Press; 1992. http://www.amazon.de/Diffraction-Semiclass-Montroll-Memorial-Mathematical/dp/0521025877/ref=sr_1_cc_1?s=aps&ie=UTF8&qid=1352643084&sr=1-1-catcorr. [Google Scholar]
- 155.Arnold S. Microspheres, photonic atoms and the physics of nothing. Am Sci. 2001;89:414–20. [Google Scholar]
- 156.Noto M, Keng D, Teraoka I, Arnold S. Detection of protein orientation on the silica microsphere surface using transverse electric/transverse magnetic whispering gallery modes. Biophys J. 2007;92:4466–72. doi: 10.1529/biophysj.106.103200. [DOI] [PMC free article] [PubMed] [Google Scholar]
- 157.Noto M, Vollmer F, Keng D, Teraoka I, Arnold S. Nanolayer characterization through wavelength multiplexing of a micro-sphere resonator. Opt Lett. 2005;30:510–2. doi: 10.1364/ol.30.000510. [DOI] [PubMed] [Google Scholar]
- 158.Rubin JT, Deych LI. Optical forces due to spherical microresonators and their manifestation in optically induced orbital motion of nanoparticles. Phys Rev A. 2011;84:023844-1–8. [Google Scholar]
- 159.Wiersig J. Structure of whispering-gallery modes in optical microdisks perturbed by nanoparticles. Phys Rev A. 2011;84:063828-1–9. [Google Scholar]
- 160.Boriskina SV, Dal Negro L. Self-referenced photonic molecule bio(chemical)sensor. Opt Lett. 2010;35:2496–8. doi: 10.1364/OL.35.002496. [DOI] [PubMed] [Google Scholar]
- 161.Arnold S, Shopova SI, Holler S. Whispering gallery mode biosensor?for label-free detection of single molecules: thermo-optic vs. reactive mechanism. Opt Express. 2010;18:281–7. doi: 10.1364/OE.18.000281. [DOI] [PubMed] [Google Scholar]
- 162.Hoon J, Shinyoung L, Gun Yong S, Shin JH. Design and fabrication of Tb 3+-doped silicon oxy-nitride microdisk for biosensor applications. IEEE Photonics Technol Lett. 2011;23:88–90. [Google Scholar]
- 163.Lee S, Eom SC, Chang JS, Huh C, Sung GY, Shin JH. Label-free optical biosensing using a horizontal air-slot SiN(x) microdisk resonator. Opt Express. 2010;18:20638–44. doi: 10.1364/OE.18.020638. [DOI] [PubMed] [Google Scholar]
- 164.Ostrowski M, Pignalosa P, Smith H, Yi Y. Higher-order optical resonance node detection of integrated disk microresonator. Opt Lett. 2011;36:3042–4. doi: 10.1364/OL.36.003042. [DOI] [PubMed] [Google Scholar]
- 165.Linghua W, Ren J, Xiuyou H, Claes T, Xigao J, Bienstman P, Baets R, Mingshan Z, Morthier G. A label-free optical biosensor built on a low-cost polymer platform. IEEE Photonics J. 2012;4:920–30. 19106-1–3. [Google Scholar]
- 166.Su BQ, Wang CX, Kan Q, Chen HD. Compact silicon-on-insulator dual-microring resonator optimized for sensing. J Lightwave Technol. 2011;29:1535–41. [Google Scholar]
- 167.Lei J, Mingyu L, Jian-Jun H. Highly-sensitive silicon-on-insulator sensor based on two cascaded micro-ring resonators with vernier effect. Opt Commun. 2011;284:156–9. [Google Scholar]
- 168.Xu DX, Vachon M, Densmore A, Ma R, Delage A, Janz S, Lapointe J, Li Y, Lopinski G, Zhang D, Liu QY, Cheben P, Schmid JH. Label-free biosensor array based on silicon-on-insulator ring resonators addressed using a WDM approach. Opt Lett. 2010;35:2771–3. doi: 10.1364/OL.35.002771. [DOI] [PubMed] [Google Scholar]
- 169.Mancuso M, Goddard JM, Erickson D. Nanoporous polymer ring resonators for biosensing. Opt Express. 2012;20:245–55. doi: 10.1364/OE.20.000245. [DOI] [PMC free article] [PubMed] [Google Scholar]
- 170.Cho SY, Jokerst NM. A polymer microdisk photonic sensor integrated onto silicon. IEEE Photonics Technol Lett. 2006;18:2096–8. [Google Scholar]
- 171.Junfeng S, Xianshu L, Xiaoguang T, MiKyoung P, Kee JS, Huijuan Z, Mingbin Y, Guo-Qiang L, Dim-Lee K. Electrical tracing-assisted dual-microring label-free optical bio/chemical sensors. Opt Express. 2011;20:4189–97. [Google Scholar]
- 172.Jin L, Li MY, He JJ. Highly-sensitive silicon-on-insulator sensor based on two cascaded micro-ring resonators with vernier effect. Opt Commun. 2011;284:156–9. [Google Scholar]
- 173.Claes T, Bogaerts W, Bienstman P. Experimental characterization of a silicon photonic biosensor consisting of two cascaded ring resonators based on the Vernier-effect and introduction of a curve fitting method for an improved detection limit. Opt Express. 2010;18:22747–61. doi: 10.1364/OE.18.022747. [DOI] [PubMed] [Google Scholar]
- 174.Carlborg CF, Gylfason KB, Kazmierczak A, Dortu F, Polo MJB, Catala AM, Kresbach GM, Sohlstrom H, Moh T, Vivien L, Popplewell J, Ronan G, Barrios CA, Stemme G, van der Wijngaart W. A packaged optical slot-waveguide ring resonator sensor array for multiplex label-free assays in labs-on-chips. Lab Chip. 2010;10:281–90. doi: 10.1039/b914183a. [DOI] [PubMed] [Google Scholar]
- 175.Khorasaninejad M, Clarke N, Anantram MP, Saini SS. Optical bio-chemical sensors on SNOW ring resonators. Opt Express. 2011;19:17575–84. doi: 10.1364/OE.19.017575. [DOI] [PubMed] [Google Scholar]
- 176.White IM, Fan XD. On the performance quantification of resonant refractive index sensors. Opt Express. 2008;16:1020–8. doi: 10.1364/oe.16.001020. [DOI] [PMC free article] [PubMed] [Google Scholar]
- 177.Sun YZ, Fan XD. Optical ring resonators for biochemical and chemical sensing. Anal Bioanal Chem. 2011;399:205–11. doi: 10.1007/s00216-010-4237-z. [DOI] [PubMed] [Google Scholar]
- 178.Sumetsky M, Windeler RS, Dulashko Y, Fan X. Optical liquid ring resonator sensor. Opt Express. 2007;15:14376–81. doi: 10.1364/oe.15.014376. [DOI] [PubMed] [Google Scholar]
- 179.Zhu HY, White IM, Suter JD, Zourob M, Fan XD. Opto-fluidic micro-ring resonator for sensitive label-free viral detection. Analyst. 2008;133:356–60. doi: 10.1039/b716834a. [DOI] [PubMed] [Google Scholar]
- 180.Gohring JT, Fan XD. Label free detection of CD4+ and CD8+T cells using the optofluidic ring resonator. Sensors. 2010;10:5798–808. doi: 10.3390/s100605798. [DOI] [PMC free article] [PubMed] [Google Scholar]
- 181.Lin N, Jiang L, Wang SM, Xiao H, Lu YF, Tsai HL. Design and optimization of liquid core optical ring resonator for refractive index sensing. Appl Optics. 2011;50:3615–21. doi: 10.1364/AO.50.003615. [DOI] [PubMed] [Google Scholar]
- 182.Manchee CPK, Veinot JGC, Meldrum A. Theory and demonstration of fluorescence-based refractometric sensing in glass micro-capillaries with a silicon nanocrystal-embedded film. 13th International Conference on Transparent Optical Networks; 2011; 2011. [Google Scholar]
- 183.White IM, Oveys H, Fan X, Smith TL, Zhang JY. Integrated multiplexed biosensors based on liquid core optical ring resonators and antiresonant reflecting optical waveguides. Appl Phys Lett. 2006;89 [Google Scholar]
- 184.Zhu HY, White IM, Suter JD, Zourob M, Fan XD. Integrated refractive index optical ring resonator detector for capillary electrophoresis. Anal Chem. 2007;79:930–7. doi: 10.1021/ac061279q. [DOI] [PubMed] [Google Scholar]
- 185.Hao L, Yunbo G, Yuze S, Reddy K, Xudong F. Analysis of single nanoparticle detection by using 3-dimensionally confined optofluidic ring resonators. Opt Express. 2010;18:25081–8. doi: 10.1364/OE.18.025081. [DOI] [PubMed] [Google Scholar]
- 186.Armani DK, Kippenberg TJ, Spillane SM, Vahala KJ. Ultra-high-Q toroid microcavity on a chip. Nature. 2003;421:925–8. doi: 10.1038/nature01371. [DOI] [PubMed] [Google Scholar]
- 187.Lee H, Chen T, Li J, Yang KY, Jeon S, Painter O, Vahala KJ. Chemically etched ultrahigh-Q wedge-resonator on a silicon chip. Nature Photonics. 2012;6:369–73. [Google Scholar]
- 188.Grossmann T, Hauser M, Beck T, Gohn-Kreuz C, Karl M, Kalt H, Vannahme C, Mappes T. High-Q conical polymeric microcavities. Appl Phys Lett. 2010;96:013303-1–3. [Google Scholar]
- 189.Silverstone JW, McFarlane S, Manchee CPK, Meldrum A. Ultimate resolution for refractometric sensing with whispering gallery mode microcavities. Opt Express. 2012;20:8284–95. doi: 10.1364/OE.20.008284. [DOI] [PubMed] [Google Scholar]
- 190.Manchee CPK, Zamora V, Silverstone JW, Veinot JGC, Meldrum A. Refractometric sensing with fluorescent-core microcapillaries. Opt Express. 2011;19:21540–51. doi: 10.1364/OE.19.021540. [DOI] [PubMed] [Google Scholar]
- 191.Francois A, Himmelhaus M. Optical biosensor based on whispering gallery mode excitations in clusters of microparticles. Appl Phys Lett. 2008;92:141107-1–3. [Google Scholar]
- 192.Himmelhaus M. Whispering gallery mode-microlasers embedded into a dense medium. Opt Commun. 2011;284:4843–6. [Google Scholar]
- 193.Smith EJ, Schulze S, Kiravittaya S, Mei YF, Sanchez S, Schmidt OG. Lab-in-a-tube: ultracompact components for on-chip capture and detection of individual micro-/nanoorganisms. Lab Chip. 2012;12:1917–31. doi: 10.1039/c2lc21175k. [DOI] [PubMed] [Google Scholar]
- 194.Beier HT, Cote GL, Meissner KE. Whispering gallery mode biosensors consisting of quantum dot-embedded microspheres. Ann Biomed Eng. 2009;37:1974–83. doi: 10.1007/s10439-009-9713-2. [DOI] [PubMed] [Google Scholar]
- 195.Xu F, Horak P, Brambilla G. Optical microfiber coil resonator refractometric sensor (vol 15, pg 7888, 2007) Optics Express. 2007;15:9385. doi: 10.1364/oe.15.009385. [DOI] [PubMed] [Google Scholar]
- 196.Kang C, Phare CT, Vlasov YA, Assefa S, Weiss SM. Photonic crystal slab sensor with enhanced surface area. Opt Express. 2010;18:27930–7. doi: 10.1364/OE.18.027930. [DOI] [PubMed] [Google Scholar]
- 197.Scullion MG, Di Falco A, Krauss TF. Slotted photonic crystal cavities with integrated microfluidics for biosensing applications. Biosens Bioelectron. 2011;27:101–5. doi: 10.1016/j.bios.2011.06.023. [DOI] [PubMed] [Google Scholar]
- 198.Quan QM, Loncar M. Deterministic design of wavelength scale, ultra-high Q photonic crystal nanobeam cavities. Opt Express. 2011;19:18529–42. doi: 10.1364/OE.19.018529. [DOI] [PubMed] [Google Scholar]
- 199.Takahashi Y, Tanaka Y, Hagino H, Sugiya T, Sato Y, Asano T, Noda S. Design and demonstration of high-Q photonic heterostructure nanocavities suitable for integration. Opt Express. 2009;17:18093–102. doi: 10.1364/OE.17.018093. [DOI] [PubMed] [Google Scholar]
- 200.Grepstad JO, Kaspar P, Solgaard O, Johansen IR, Sudbo AS. Photonic-crystal membranes for optical detection of single nano-particles, designed for biosensor application. Opt Express. 2012;20:7954–65. doi: 10.1364/OE.20.007954. [DOI] [PubMed] [Google Scholar]
- 201.Topolancik J, Vollmer F, Ilic R, Crescimanno M. Out-of-plane scattering from vertically asymmetric photonic crystal slab waveguides with in-plane disorder. Opt Express. 2009;17:12470–80. doi: 10.1364/oe.17.012470. [DOI] [PubMed] [Google Scholar]
- 202.Cunningham BT, Laing L. Microplate-based, label-free detection of biomolecular interactions: applications in proteomics. Expert Rev Proteomics. 2006;3:271–81. doi: 10.1586/14789450.3.3.271. [DOI] [PubMed] [Google Scholar]
- 203.Cunningham BT. Photonic crystal surfaces as a general purpose platform for label-free and fluorescent assays. Jala. 2010;15:120–35. 221108-1–3. doi: 10.1016/j.jala.2009.10.009. [DOI] [PMC free article] [PubMed] [Google Scholar]
- 204.Pang S, Beckham RE, Meissner KE. Quantum dot-embedded microspheres for remote refractive index sensing. Appl Phys Lett. 2008;92 doi: 10.1063/1.2937209. [DOI] [PMC free article] [PubMed] [Google Scholar]
- 205.Zhang XW, Ren LQ, Wu X, Li H, Liu LY, Xu L. Coupled opto-fluidic ring laser for ultrahigh-sensitive sensing. Opt Express. 2011;19:22242–7. doi: 10.1364/OE.19.022242. [DOI] [PubMed] [Google Scholar]
- 206.Humar M, Musevic I. Surfactant sensing based on whispering-gallery-mode lasing in liquid-crystal microdroplets. Opt Express. 2011;19:19836–44. doi: 10.1364/OE.19.019836. [DOI] [PubMed] [Google Scholar]
- 207.Tan YF, Ge C, Chu A, Tan YF, Ge C, Chu A, Lu M, Goldshlag W, Huang CS, Pokhriyal A, George S, Cunningham BT. Plastic-Based Distributed Feedback Laser Biosensors in Microplate Format. IEEE Sens J. 2012;12:1174–80. [Google Scholar]
- 208.Camden JP, Dieringer JA, Wang YM, Masiello DJ, Marks LD, Schatz GC, Van Duyne RP. Probing the structure of single-molecule surface-enhanced Raman scattering hot spots. J Am Chem Soc. 2008;130:12616. doi: 10.1021/ja8051427. [DOI] [PubMed] [Google Scholar]
- 209.Talley CE, Jackson JB, Oubre C, Grady NK, Hollars CW, Lane SM, Huser TR, Nordlander P, Halas NJ. Surface-enhanced Raman scattering from individual Au nanoparticles and nanoparticle dimer substrates. Nano Lett. 2005;5:1569–74. doi: 10.1021/nl050928v. [DOI] [PubMed] [Google Scholar]
- 210.Fromm DP, Sundaramurthy A, Kinkhabwala A, Schuck PJ, Kino GS, Moerner WE. Exploring the chemical enhancement for surface-enhanced Raman scattering with Au bowtie nanoantennas. J Chem Phys. 2006;124:061101-1–4. doi: 10.1063/1.2167649. [DOI] [PMC free article] [PubMed] [Google Scholar]
- 211.Boriskina SV. Spectrally engineered photonic molecules as optical sensors with enhanced sensitivity: a proposal and numerical analysis. J Opt Soc Am B-Opt Phys. 2006;23:1565–73. [Google Scholar]
- 212.Frimmer M, Koenderink AF. Superemitters in hybrid photonic systems: a simple lumping rule for the local density of optical states and its break-down at the unitary limit. arXiv:120416752012. [Google Scholar]
- 213.Xiao YF, Liu YC, Li BB, Chen YL, Li Y, Gong QH. Strongly enhanced light-matter interaction in a hybrid photonic-plasmonic resonator. Phys Rev A. 2012;85:031805-1–5. [Google Scholar]
- 214.Ausman LK, Schatz GC. Whispering-gallery mode resonators: surface enhanced Raman scattering without plasmons. J Chem Phys. 2008;129:054704-1–10. doi: 10.1063/1.2961012. [DOI] [PubMed] [Google Scholar]
- 215.Rakovich YP, Donegan JF, Gaponik N, Rogach AL. Raman scattering and anti-Stokes emission from a single spherical microcavity with a CdTe quantum dot monolayer. Appl Phys Lett. 2003;83:2539–41. [Google Scholar]
- 216.White IM, Oveys H, Fan XD. Increasing the enhancement of SERS with dielectric microsphere resonators. Spectroscopy. 2006;21:36. [Google Scholar]
- 217.Shopova SI, Blackledge CW, Rosenberger AT. Enhanced evanescent coupling to whispering-gallery modes due to gold nanorods grown on the microresonator surface. Appl Phys B-Lasers Opt. 2008;93:183–7. [Google Scholar]
- 218.Min BK, Ostby E, Sorger V, Ulin-Avila E, Yang L, Zhang X, Vahala K. High-Q surface-plasmon-polariton whispering-gallery microcavity. Nature. 2009;457:455–U3. doi: 10.1038/nature07627. [DOI] [PubMed] [Google Scholar]
- 219.Yun-Feng X, Chang-Ling Z, Bei-Bei L, Yan, Li, Chun-Hua D, Zheng-Fu H, Qihuang G. High-Q exterior whispering-gallery modes in a metal-coated microresonator. Phys Rev Lett. 2010;105:153902. doi: 10.1103/PhysRevLett.105.153902. (4 pp.)- (4 pp.) (4 pp.) [DOI] [PubMed] [Google Scholar]
- 220.Hon NK, Poon AW. Surface plasmon resonance-assisted coupling to whispering-gallery modes in micropillar resonators. J Opt Soc Am B. 2007;24:1981–6. [Google Scholar]
- 221.Liu YC, Xiao YF, Jiang XF, Li BB, Li Y, Gong QH. Cavity-QED treatment of scattering-induced free-space excitation and collection in high-Q whispering-gallery microcavities. Phys Rev A. 2012;85:013843-1–9. [Google Scholar]
- 222.Zhou LJ, Sun XM, Li XW, Chen JP. Miniature microring resonator sensor based on a hybrid plasmonic waveguide. Sensors. 2011;11:6856–67. doi: 10.3390/s110706856. [DOI] [PMC free article] [PubMed] [Google Scholar]
- 223.Chamanzar M, Adibi A. Hybrid nanoplasmonic-photonic resonators for efficient coupling of light to single plasmonic nanoresonators. Opt Express. 2011;19:22292–304. doi: 10.1364/OE.19.022292. [DOI] [PubMed] [Google Scholar]
- 224.Barrios CA. Optical slot-waveguide based biochemical sensors. Sensors. 2009;9:4751–65. doi: 10.3390/s90604751. [DOI] [PMC free article] [PubMed] [Google Scholar]
- 225.El Beheiry M, Liu V, Fan SH, Levi O. Sensitivity enhancement in photonic crystal slab biosensors. Opt Express. 2010;18:22702–14. doi: 10.1364/OE.18.022702. [DOI] [PubMed] [Google Scholar]
- 226.Lin SY, Schonbrun E, Crozier K. Optical manipulation with planar silicon microring resonators. Nano Lett. 2010;10:2408–11. doi: 10.1021/nl100501d. [DOI] [PubMed] [Google Scholar]
- 227.Cai H, Poon AW. Optical manipulation and transport of microparticles on silicon nitride microring-resonator-based add drop devices. Opt Lett. 2010;35:2855–7. doi: 10.1364/OL.35.002855. [DOI] [PubMed] [Google Scholar]
- 228.Chen YF, Serey X, Sarkar R, Chen P, Erickson D. Controlled photonic manipulation of proteins and other nanomaterials. Nano Lett. 2012;12:1633–7. doi: 10.1021/nl204561r. [DOI] [PMC free article] [PubMed] [Google Scholar]
- 229.Luan L, Royal MW, Evans R, Fair RB, Jokerst NM. Chip scale optical microresonator sensors integrated with embedded thin film photodetectors on electrowetting digital microfluidics platforms. IEEE Sens J. 2012;12:17984–800. [Google Scholar]
- 230.De Angelis F, Gentile F, Mecarini F, Das G, Moretti M, Candeloro P, Coluccio ML, Cojoc G, Accardo A, Liberale C, Zaccaria RP, Perozziello G, Tirinato L, Toma A, Cuda G, Cingolani R, Di Fabrizio E. Breaking the diffusion limit with super-hydrophobic delivery of molecules to plasmonic nano-focusing SERS structures. Nat Photonics. 2011;5:683–8. [Google Scholar]
- 231.Deubel M, Von Freymann G, Wegener M, Pereira S, Busch K, Soukoulis CM. Direct laser writing of three-dimensional photonic-crystal templates for telecommunications. Nat Mater. 2004;3:444–7. doi: 10.1038/nmat1155. [DOI] [PubMed] [Google Scholar]
- 232.Topolancik J, Vollmer F, Ilic B. Random high-Q cavities in disordered photonic crystal waveguides. Appl Phys Lett. 2007;91:201102-1–3. doi: 10.1103/PhysRevLett.99.253901. [DOI] [PubMed] [Google Scholar]
- 233.Khademhosseini A, Langer R, Borenstein J, Vacanti JP. Microscale technologies for tissue engineering and biology. Proc Natl Acad Sci USA. 2006;103:2480–7. 048102-1–4. doi: 10.1073/pnas.0507681102. [DOI] [PMC free article] [PubMed] [Google Scholar]
- 234.Serey X, Mandal S, Chen YF, Erickson D. DNA transport and delivery in thermal gradients near optofluidic resonators. Phys Rev Lett. 2012;108 doi: 10.1103/PhysRevLett.108.048102. [DOI] [PubMed] [Google Scholar]
- 235.Wang K, Crozier KB. Plasmonic trapping with a gold nanopillar. ChemPhysChem. 2012;13:2639–48. doi: 10.1002/cphc.201200121. [DOI] [PubMed] [Google Scholar]
- 236.Heyman Y, Buxboim A, Wolf SG, Daube SS, Bar-Ziv RH. Cell-free protein synthesis and assembly on a biochip. Nat Nanotechnol. 2012;7:374–8. doi: 10.1038/nnano.2012.65. [DOI] [PubMed] [Google Scholar]