Abstract
In this study, the temperature profiles of insulin pump reservoirs during normal wear conditions across multiple seasons were characterized. Thermocouples secured in reservoirs filled with insulin diluent were loaded in infusion pumps worn by volunteers. Reservoir and ambient environmental temperature data and activity levels were logged during the course of normal daily activities in February (winter), April (spring), and August (summer). Each seasonal data set comprised 7 to 14 days of wear from 3 to 5 volunteers. Reservoir temperature profiles were generally higher than ambient temperatures, likely due to heat transfer from the wearer when the pump was placed close to the body. Temperature conditions inside pump reservoirs fluctuated between 25°C and 37°C regardless of seasonal variations. The average reservoir temperature remained close to 30°C across all seasons, notably lower than used in previously published compatibility and stability protocols (37°C). Results from this study could be utilized to develop more accurate stability and compatibility testing procedures for new insulin formulations and/or delivery devices.
Keywords: continuous subcutaneous insulin infusion, insulin pump temperature, thermal monitoring, insulin delivery device testing
In real-world settings, insulin pumps and reservoirs are exposed to temperature fluctuations during the course of normal use. The stability of insulin and the compatibility with delivery devices may be affected by these temperature changes. To date, the temperature exposure range of pumped insulin has not been thoroughly characterized in a real-world setting.
Most stability and compatibility studies are performed at a single temperature, testing at or close to 37°C, with additional agitation or humidity control commonly employed.1-6 Testing based on worst-case temperature conditions (37°C) offers critical information to satisfy regulatory requirements, but provides no indication as to the actual product stability and compatibility lifetime under real-world settings. Shnek et al describe a method to characterize insulin stability by cycling exposure temperatures between 25°C and 37°C with agitation, and though more realistic than single-point testing, this was not correlated to patient usage patterns.7
This report details testing performed to examine insulin exposure temperatures based on real pump wear data from volunteers over winter, spring, and summer months. Results from this study could be utilized to develop more accurate stability and compatibility testing procedures for new insulin formulations and/or delivery devices.
Methods
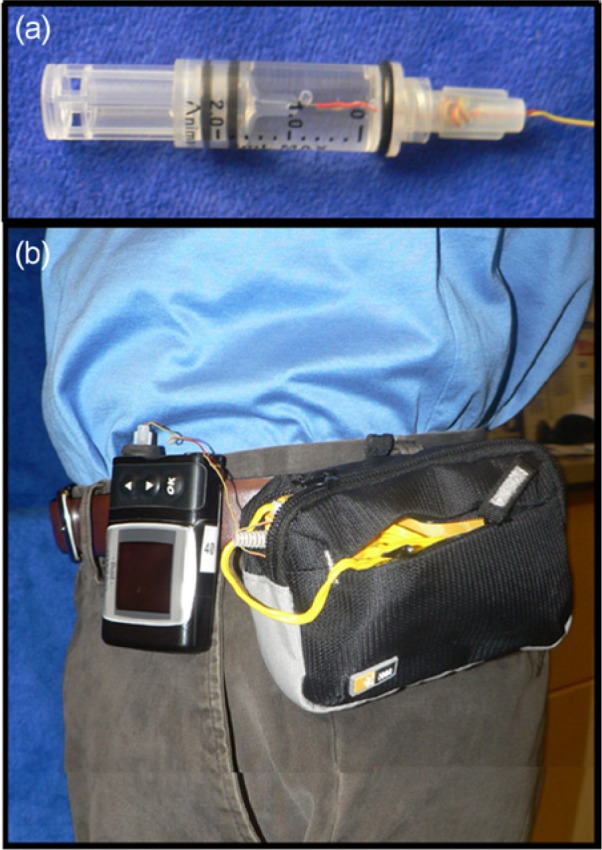
Wire thermocouples (part # 5SRTC-TT-K-30-36, Omega Engineering, Stamford, CT) were secured into a female Luer connector by epoxy, with the active element of the thermocouple extending past the connector by 1 inch. The Luer connector was then attached to a fluid reservoir (Part # 100-124-02, Animas, West Chester, PA) filled with 2.0 mL insulin diluent (part # ND 800, Lilly, Indianapolis, IN). The active element of the thermocouple was located inside the fluid reservoir as shown in Figure 1a. The electrical connector of the thermocouple was attached to the temperature logger (part # 177-T4, Omega Engineering, Stamford, CT). The reservoir with thermocouple was then loaded into an insulin pump (Animas OneTouch Ping).
Figure 1.

Real-time temperature logging configuration: (a) Omega wire thermocouple secured into an Animas 2.0 mL reservoir filled with insulin diluent. (b) Volunteer wearing pump/data logger pack on belt clip during 72-hour temperature logging study.
Volunteers were asked to wear pumps and temperature data loggers for a target wear period of 72 hours while continuing with their normal day-to-day activities (Figure 1b). Volunteers were nondiabetic, and no infusion set was applied nor was any diluent or insulin delivered. Temperature logging data were collected each minute for a minimum of 7 days for each seasonal data set. Volunteers wore the pump and a small equipment pack containing an exteriorized wire temperature thermocouple sensor for ambient air measurement and data logging apparatus for 24 hours each day. Certain short exceptions as expected during normal use (e.g., showering, changing clothes) were anticipated and allowed for removal of the pump. Volunteers were instructed to wear the pump in a location consistent with normal use (e.g., belt, pocket, or undergarment at night) and to keep it attached to the body while minimizing its relocation throughout the study except as necessary to accommodate normal daily activities. Volunteer physical activity level (including duration), environment, and pump location were recorded on a log sheet for the duration of the study. Volunteers had professional lifestyles, spending the majority of their work week inside a climate-controlled environment. To reduce systematic bias based on a 9 to 5 work schedule, a mix of weekday and weekend data were acquired over the course of each seasonal data set.
Results and Discussion
The study was conducted in the Raleigh-Durham, North Carolina area across several seasons. Five volunteers participated in this study and temperature data are summarized by seasons in Table 1. Data were collected for 14 days during the summer months, 14 days during the spring months, and 7 days during the winter months. The mean pump temperature ranged from 31.5°C during the summer to 27.4°C during the winter. The mean pump temperature during the spring was 30.3°C. Ambient temperatures were consistently lower than pump temperatures across all months. The maximum observed pump temperature was 36.8°C, which as expected, occurred during the summer months when the average ambient temperature was 43.8°C. The minimum observed pump temperature was 16.5°C, which again, as expected, occurred during the winter months when the average ambient temperature was 2.2°C.
Table 1.
Seasonal Temperature Logging Results for Pump Reservoir and Ambient Air Temperatures.
| Temperature (°C) | Summer (n = 14 wear days) |
Spring (n = 14 wear days) |
Winter (n = 7 wear days) |
All seasons (N = 35 wear days) |
||||
|---|---|---|---|---|---|---|---|---|
| Pump | Ambient | Pump | Ambient | Pump | Ambient | Pump | Ambient | |
| Mean | 31.5 | 25.8 | 30.3 | 24.5 | 27.4 | 22.8 | 30.1 | 24.6 |
| Median | 31.7 | 24.9 | 26.1 | 20.5 | 27.4 | 22.2 | 31.0 | 23.9 |
| Minimum | 20.1 | 13.3 | 20.1 | 7.4 | 16.5 | 2.2 | 16.5 | 2.2 |
| Maximum | 36.8 | 43.8 | 36.3 | 43.3 | 34.6 | 35.1 | 36.8 | 43.8 |
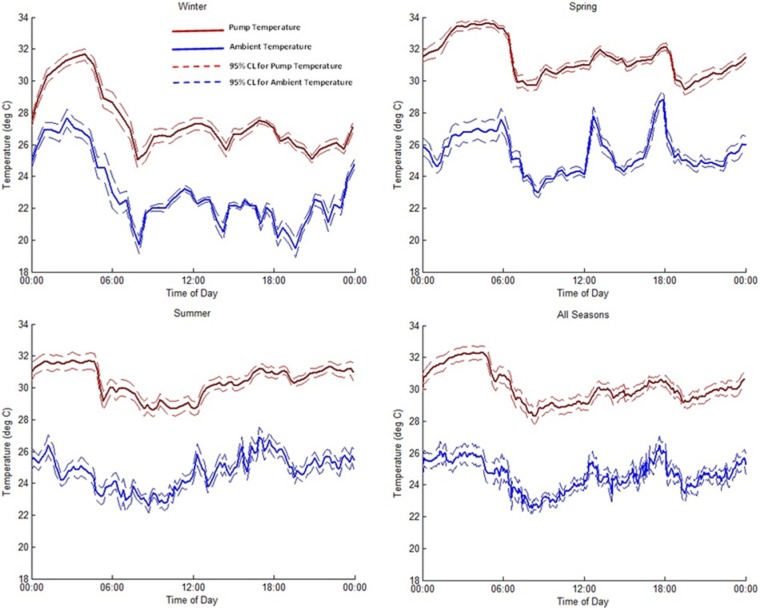
Average reservoir and ambient temperature profiles for each seasonal data set are shown in Figure 2. Average reservoir temperatures were between 25°C and 37°C across all seasons. Temperatures were lowest in the morning hours, immediately following the time volunteers woke up and showered. Interestingly, a consistent temperature increase was observed during the overnight hours, independent of season, during the time the volunteers were sleeping. This was presumably due to maintaining the location of the pump close to the body and under insulating coverlets overnight. Although not specifically discernible from logbook data, this hypothesis appears supported by parallel rises in overnight ambient temperatures, and is attributed to the mechanical tethering and requisite close proximity between the pump and equipment bag containing the data logger and ambient thermocouple. Throughout the day, temperature cycling was observed across all seasons, though there was no apparent correlation with specific physical activities recorded by volunteers. When examining winter and spring ambient temperature data, this cycling appears to be consistent with times of expected transitions between home and work environments (eg, leaving in the morning, midday lunch periods, and evening return home). Recorded temperatures diverge below and above the ambient seasonal mean respectively, as expected for these 2 seasons, with the exception of early spring mornings. Surprisingly, summer temperatures show less overall cycling, but slightly higher overall means, presumably due to greater use of climate controls in transportation, work, and home environments. These relatively consistent overall mean ambient temperatures despite the seasonal variation, reflect the trend of living and working in tightly climate-controlled environments.
Figure 2.
Mean pump reservoir (red) and ambient air (blue) temperatures (±95% CI) logged for each season across all volunteers and all days.
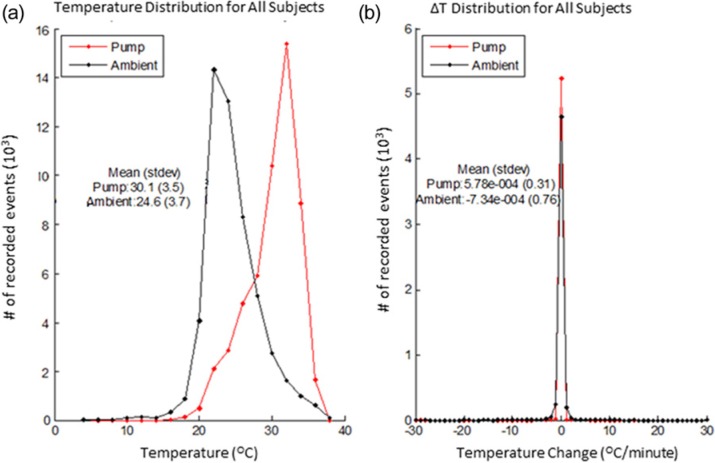
The temperatures inside the pump reservoir were consistently higher than the ambient air temperature and seasonally showed similar cycling patterns that were slightly damped in magnitude and time delayed relative to ambient temperature fluctuations (Figure 2). When examined in aggregate across all seasons (Table 1) mean reservoir temperatures were consistently about 5.5°C (4.6-5.7°C seasonal range) above mean ambient conditions. Overall temperature distributions across all seasons (Figure 3a) show a similar relative pattern and occurrence rate, with an offset temperature magnitude for pump temperatures, as well. These analogous trends are presumably due to heat transfer and temperature buffering from the body due to the close proximity of the pump. This biological proximity buffering effect helps to maintain the overall mean temperature of the reservoir around 30°C, despite the occurrence of larger ambient temperature fluctuations seen within each seasonal data set. Reservoir temperatures reached a maximum of 36.8°C and a minimum of 16.5°C across all seasons tested. In contrast, ambient air temperatures varied across all seasons and ranged from 43.8°C to 2.2°C.
Figure 3.
(a) Distribution for pump reservoir and ambient air temperatures across all seasons and subjects. (b) Temperature change distribution for all subjects across all seasons.
The magnitude and duration of ambient air temperature fluctuations also influenced the rate of temperature change, ΔT, seen in recorded reservoir temperatures; however, the majority of time ΔT was within ± 1°C/min for both reservoir and ambient air conditions (Figure 3b). A broader ΔT distribution was observed for ambient air temperatures (max recorded ΔT of 9.2, 8.1, and 8.0°C/min for winter, spring, and summer, respectively) compared to pump temperatures (max recorded ΔT of 2.25, 0.35, and 0.9°C/min for winter, spring and summer, respectively). Larger gradients in ambient temperature would be expected based on the lower heat capacity of air compared to insulin diluent contained in the pump reservoir. Similarly, pump ΔT gradients increased during periods with larger differentials between ambient air and average body temperatures.
Conclusions
In real-world settings, insulin pumps and reservoirs are exposed to temperature fluctuations during the course of normal use due to variations in ambient environmental conditions and activity levels. In this study, the temperature exposure range of pumped insulin was characterized during normal use across the winter, spring, and summer months, primarily in a climate-controlled indoor setting.
Mean reservoir temperatures were consistently about 5.5°C higher than ambient air temperature across all seasons. This temperature difference is likely caused by heat transfer due to the close proximity of the pump to the body. In addition, because body temperature is well regulated, the body also provides a thermal buffering effect that helps maintain the overall mean temperature of the reservoir around 30°C, independent of ambient temperatures and temperature cycling events.
Increased overnight temperatures were also consistently observed across seasonal data sets. Temperatures were lowest in the morning hours and rose throughout the day. However, although temperatures generally increased throughout the day, temperature cycling and fluctuations were consistently observed.
The key features from these seasonal data sets, mean temperature, increased overnight temperature, and daily temperature cycling, could be incorporated into a variable temperature testing profile to better replicate normal pump use conditions, as an alternative to standard single-point temperature testing. The effects of temperature cycling on insulin stability have received limited study to date7,8 and deserve additional investigation. An environmentally- controlled convection oven, incubator, or temperature block with variable temperature could be programmed to mimic the observed temperature profiles seen in this study and replicate the expected temperature fluctuations during normal pump use.
This testing is based on experimental data reflecting a professional lifestyle in central North Carolina, with few drastic variations in pump or ambient temperature, owing to an increasingly environmentally insulated existence. Similar testing could be performed across various geographic regions and lifestyle activities to generate broader representative data for more extreme ambient conditions that may occur in daily life. Likewise, testing in atypical environments could develop a more accurate characterization of potential worst case scenario pump reservoir temperatures. This is especially pertinent considering the dependence of insulin activity loss on increased temperatures. For testing of patch delivery systems where body temperature might have a more dramatic impact on insulin reservoir temperatures, skin temperature may prove to be a valuable reference in addition to ambient air measurement.
Previously described compatibility testing of formulations and/or devices at 37°C may represent worst- case conditions for the majority of users, but may not be fully representative of normal use. As such, implementing testing based on normal use conditions with temperature cycling could be more appropriate for the evaluation of new insulin formulations and devices intended for extended use.
Acknowledgments
The authors would like to thank Dr. Yongji Fu for his editorial and graphics assistance with this article.
Footnotes
Declaration of Conflicting Interests: The author(s) declared the following potential conflicts of interest with respect to the research, authorship, and/or publication of this article: All authors were employees and/or shareholders of Becton Dickinson Technologies at the time of the study.
Funding: The author(s) disclosed receipt of the following financial support for the research, authorship, and/or publication of this article: This study was funded and executed by Becton Dickinson Technologies.
References
- 1. Senstius J, Poulsen C, Hvass A. Comparison of in vitro stability for insulin aspart and insulin glulisine during simulated use in infusion pumps. Diabetes Technol Ther. 2007;9(6):517-522. [DOI] [PubMed] [Google Scholar]
- 2. Senstius J, Harboe E, Westermann H. In vitro stability of insulin aspart in simulated continuous subcutaneous insulin infusion using a MiniMed 508 insulin pump. Diabetes Technol Ther. 2007;9(1):75-79. [DOI] [PubMed] [Google Scholar]
- 3. Sharrow SD, Glass LC, Dobbins MA. 14-day in vitro chemical stability of insulin lispro in the MiniMed paradigm pump. Diabetes Technol Ther. 2012;14(3):1-7. [DOI] [PubMed] [Google Scholar]
- 4. Senesh G, Bushi D, Neta A, Yodfat O. Compatibility of insulin lispro, aspart, and glulisine with the solo micropump, a novel miniature insulin pump. J Diabetes Sci Technol. 2010;4(1):104-110. [DOI] [PMC free article] [PubMed] [Google Scholar]
- 5. Lougheed WD, Zinman B, Strack TR, et al. Stability of insulin lispro in insulin infusion systems. Diabetes Care. 1997;20(7):1061-1065. [DOI] [PubMed] [Google Scholar]
- 6. Kerr D, Morton J, Whately-Smith C, Everett J, Begley JP. Laboratory-based non-clinical comparison of occlusion rates using three rapid-acting insulin analogs in continuous subcutaneous insulin infusion catheters using low flow rates. J Diabetes Sci Technol. 2008;2(3):450-455. [DOI] [PMC free article] [PubMed] [Google Scholar]
- 7. Shnek DR, Hostettler DL, Bell MA, Olinger JM, Frank BH. Physical stress testing of insulin suspensions and solutions. J Pharm Sci. 1988;98(11):1459-1465. [DOI] [PubMed] [Google Scholar]
- 8. Chandler C, Gryniewicz CM, Pringle T, Cunningham F. Insulin temperature and stability under simulated transit conditions. Am J Health Syst Pharm. 2008;6:953-963. [DOI] [PubMed] [Google Scholar]


