Abstract
Background:
This study evaluated a novel technology for improving accuracy of self-monitoring of blood glucose (SMBG). The technology calibrates each and every test by measuring the response from a predetermined amount of glucose present in the sample chamber of each test strip.
Method:
SMBG test strips were modified to include a lid coated with a fast dissolving formulation containing glucose. These test strips were characterized for hematocrit (Hct) and temperature induced error response to develop a calibration algorithm. The modified test strips were used in a clinical evaluation involving fingerstick blood samples from 160 subjects.
Results:
Experiments involving Hct and temperature induced errors show that the technology generates a signal characteristic of the error conditions in any particular test, but independent of glucose concentration, allowing a correction algorithm to be derived. The approach substantially reduced Hct and temperature derived errors. Clinical evaluation using fingerstick blood directly applied to prototype strips showed the error (measured as MARD) was reduced from 11.1 to 5.9% by the on-strip correction approach and the number of outliers reduced by approximately 90%.
Conclusion:
This technology could improve the accuracy and precision of glucose monitoring systems and so reduce decision errors particularly in clinical situations where hematocrit and temperature may be significant confounders.
Keywords: blood glucose monitoring, accuracy, error, hematocrit
Self-monitoring of blood glucose (SMBG) is recommended as an integral component of diabetes therapy1,2 and studies have shown that its use is linked to better clinical outcomes and more effective control of blood glucose levels, reducing the risk of diabetes related complications.3,4
For SMBG to play a useful role in diabetes management, 3 criteria should be satisfied: (1) results generated by the test are a close approximation of the true value (the system is accurate and precise); (2) the system is convenient for the user, encouraging an appropriate frequency of testing since SMBG is consistently practiced less than is recommended by commonly supported guidelines;5 and (3) the overall cost of testing is aligned to the benefits accrued.
Since the introduction of SMBG systems in the 1980s, significant advances in these 3 areas have been made.6 Advances in convenience have been achieved by reducing blood sample volume requirement and time to result, and by enhancing the discreetness of testing through the introduction of smaller meters.7 Improvements in analytical performance have also been achieved,7-9 but further advances are still required.10
Recent studies show a mixed level of analytical performance for currently marketed SMBG systems.11-14 Freckmann et al in 2 reports of evaluations of 2711 and 4312 blood glucose monitoring systems concluded that 11 and 7 systems, respectively, did not meet minimum accuracy requirements of International Organization for Standardization (ISO) 15197:2003,15 which have since been made more demanding in ISO 15197:2013.16 These studies were performed by trained clinical personnel in a laboratory setting using single lots of test strips. Other studies have shown considerable lot-to-lot variability,17 poorer analytical performance in the hands of patients compared to trained technicians18 and significant effects on analytical performance when there are rapid shifts in ambient temperature.19
This article reports on the performance of a novel approach to reducing SMBG associated errors. The approach is based on the principle of “on-strip calibration” where each and every test is calibrated according to the response to a predetermined amount of glucose present in the capillary sample chamber of the strip. In the configuration tested, the glucose is presented as a coating on the underside of the capillary lid on the opposing surface and at a fixed distance from the working electrode. The coating dissolves, releasing glucose into the blood once the strip is filled. Dissolved added glucose (calibration glucose, Gc) diffuses from the lid to the working electrode in a finite time period, typically 2-4 seconds, during which time a measurement of the sample glucose (Gs) can be made prior to the arrival of calibration glucose. In this way independent measurements of both the sample glucose (Gs) and a calibration measurement can be made in the same capillary space within a 5-second total test time.
Moreover, the approach can be implemented at low cost since it uses inexpensive materials in the coating formulation applied using well established, high volume and precise commercial coating processes. In addition, this approach is compatible with existing common strip architectures where the electrodes are coplanar on the base and a novel architecture is not required (see for example Teodorczyk et al20). This, together with the potential to correct for manufacturing error associated with traditional strip construction techniques, means that the approach could form the basis of a high-accuracy, low-cost system based on existing strip designs and manufacturing infrastructure.
Here we report the results of a laboratory and clinical evaluation to demonstrate the performance of the novel approach.
Materials and Methods
Prototype Strip Fabrication
A formulation containing D-glucose, polymers, surfactant, and dye was coated onto polyester film. Prototype strips were fabricated by disassembling the capillary lid from a single batch of commercially available strips, then adhering the Gc coated film in place of the removed lid. The strips were chosen for their ease of disassembly and reassembly in this manner. In laboratory and clinical testing, control strips (unmodified commercial strips) were also used in a prototype meter system.
Measurement Systems
A custom 6-channel potentiostat designed and developed by PA Consulting Group was used in all studies and data were collected in the chronoamperometric mode after fill of the capillary was automatically detected. For both control and prototype strips, glucose concentrations were determined based on 5-second read time. For the prototype strips, calibration was achieved using an algorithm developed to utilize information from the on-strip calibration approach (described in the Results section).
We also analyzed the performance of prototype strips without application of the correction algorithm based on calibration of the signal from the time period before detection of the Gc. This is referred to as “noncorrected prototype” data. All systems were calibrated to give plasma glucose readings.
Prototype Strip Stability Assessment
To evaluate the effects of storage and transport on prototype strips, accelerated and real-time aging, and mechanical stability tests were carried out.
For the accelerated and real-time aging study, prototype strip samples were stored in standard desiccated vials at both room temperature and at 50°C for up to 196 days. Aged strips were tested (n = 6) using control solutions at 0, 75, and 350 mg/dl glucose.
To test mechanical stability, prototype test strips were subjected to prolonged vibration by placing in a closed desiccated vial which was vibrated by an oscillating vortex mixer (Whirlimixer, Fisons, UK) for a period of 1 hour at both room and refrigerated temperature (4°C). Strips were then tested using the same glucose control solutions.
Hematocrit and Reference Blood Glucose Measurement
Hematocrit (Hct) levels of blood samples were measured using a micro-Hct centrifuge. A YSI 2300 STAT Plus glucose analyzer (YSI, Yellow Springs, Ohio, USA) was the blood glucose reference method.
Venous Blood Collection and Sample Handling for Laboratory Hematocrit and Temperature Studies
The on-strip calibration approach was tested for its ability to correct for 2 well-known error sources,7,9 Hct and temperature variation, in a laboratory study. For these experiments, blood samples were collected by venepuncture and, where appropriate, were spiked with concentrated glucose solution to achieve concentrations between 36-540 mg/dl. For the Hct variability study, samples were adjusted to 20, 30, 40, 50, and 60% Hct level by removing or adding the appropriate amount of plasma following centrifugation. Samples were tested using prototype strips at room temperature (19-22°C), introducing the blood samples to the strips by pipette. For the temperature variability study, a blood sample at 43% Hct was tested and experiments were carried out at 16, 26, and 31°C.
Clinical Evaluation Protocol
An open label nontherapeutic study was conducted at Ipswich Hospital NHS Trust Diabetes Centre following a Protocol with Research Ethics Committee approval.
Fingertip blood from 160 participating adults with diabetes was directly applied to prototype and control strips in duplicate. Strips were preinserted into the potentiostat and measurements were triggered automatically when blood filled the capillary. A further volume of blood was collected from the same puncture site into an anticoagulant containing tube to determine Hct and the reference blood glucose concentration. Participants were asked if they had taken paracetamol, aspirin, or vitamin C within the previous 24 hours.
To fulfill the lower blood glucose stratification categories as described in ISO 15197:2013,16 blood samples were also taken from healthy volunteers.
Data Interpretation and Analysis
Duplicate measurements from participants’ blood samples were treated as separate data points in the analysis, except where the difference between duplicate values was calculated as a measure of strip to strip variability for prototype strips.
Accuracy was assessed by difference plots21 and mean absolute relative deviation (MARD22). Statistical significance of differences between systems was analyzed by Student’s t test.
In addition, the number and percentage of system results within ±5, 10, and 15% of the reference value was calculated for blood glucose concentrations of greater than 100 mg/dl and the number and percentage of system results within ±5, 10, and 15 mg/dl of the reference value was calculated for blood glucose concentrations of less than 100 mg/dl as per ISO 15197:2013.16 A specific analysis was also made on the subset of data points with a blood glucose value above 100 mg/dl and more than 20% different from the reference value (“outliers”). Finally, an assessment of the clinical significance of observed SMBG error was conducted by means of consensus error grid analysis.23
In the analysis of clinical data, a subset of the data comprising 100 participants (“the 100 participant subset”) was created to represent a better performing base strip, given that hand assembled strips are prone to variability, and to test whether the effectiveness of correction is affected by the starting quality of the data set. The subset was defined by determining the relative (%) difference between duplicate noncorrected prototype measurements (made before Gc is detected) and selecting those 100 participant data sets with the lowest values.
Results
Prototype Strip Stability Assessment
No significant change in the Gc response was observed after 196 days of storage at room temperature or 50°C, showing that the glucose-bearing coating is stable under these real-time and accelerated aging conditions.
Mechanical stability testing resulted in abrasions and wear on the outside surfaces of the test strips, but no significant change in the Gc response was observed. This shows that the coating adheres well to the polyester lid material, and is not subject to flaking or delamination even after exposure to high frequency vibrations for 1 hour.
Error Correction
Figure 1 superimposes chronoamperometric traces from an experiment using the same blood sample in either a prototype (Gc containing) strip or a control strip. For the control strip, a typical Cottrell type behavior24 is observed with the current signal decreasing after the peak value as diffusion of glucose to the electrode surface becomes limiting. The prototype strips show deviation from Cottrell behavior after 2-3 seconds as glucose molecules originating from the coated lid reach the electrode surface and contribute to the signal—we have termed this the Gc signal.
Figure 1.
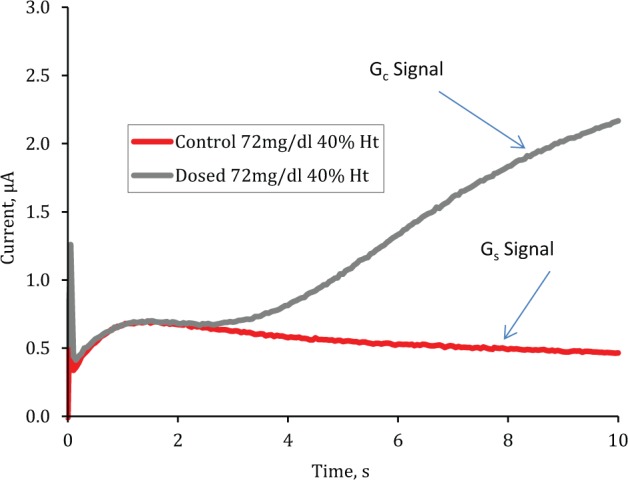
Superimposed raw chronoamperometric traces for control and prototype strips when filled with the same venous blood (72 mg/dl at 40% Hct).
Figure 2 shows how both the control strips and prototype strips respond to changes in Hct level in the blood sample where the glucose concentration is relatively constant.
Figure 2.
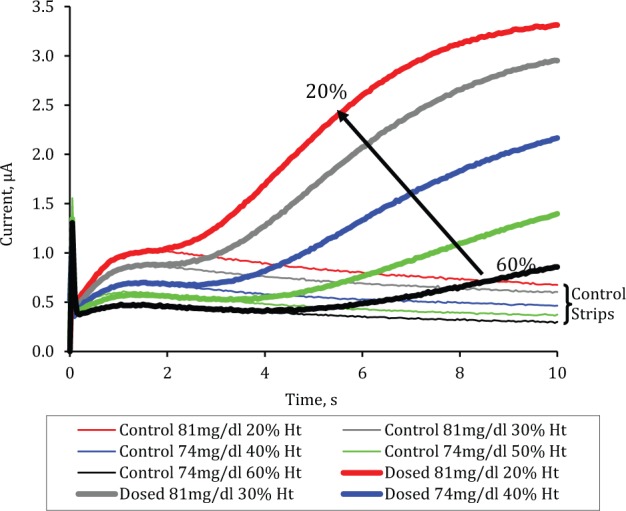
Chronoamperometric traces (average of n = 6) from prototype and control strips filled with venous blood samples of 74-81 mg/dl glucose at Hct levels varying from 20 to 60% in 10% increments.
The figure shows that in the initial period before Gc is detected at the working electrode, the signal is inversely related to the Hct level. With prototype strips the flux of Gc molecules through the sample, and hence the Gc signal, is also inversely dependent on the Hct level. Since the anticipated Gc molecular flux can be established a priori as part of the calibration process, measurement of the Gc signal can be used to establish a correction algorithm. The correction algorithm may be based on several features of the Gc signal; in this study we use the 4- to 5-second gradient to correct the provisional glucose concentration derived from the current in the period before Gc arrival at the electrode. Figure 3 shows how the 4- to 5-second Gc gradient on prototype strips is closely correlated (r2 = .71) to the bias of this provisional reading. The correction algorithm takes into account both the provisional blood glucose measurement and the estimated error associated with that measurement to produce a corrected measurement of blood glucose concentration in the sample.
Figure 3.
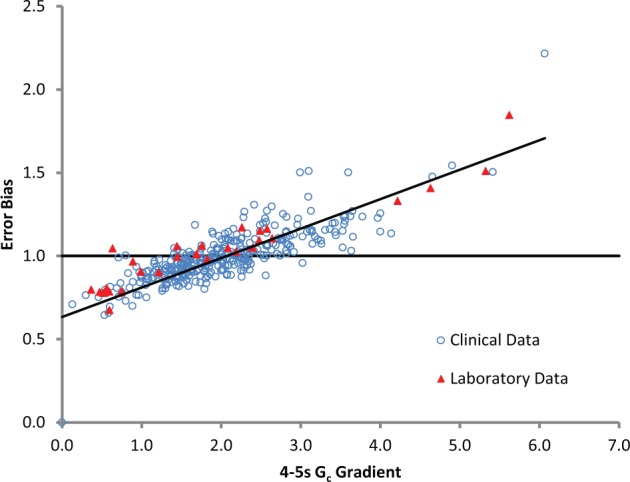
Relationship between on-strip calibration glucose response (measured as 4- to 5-second Gc gradient) and error bias (actual glucose concentration measured divided by reference measurement) of the provisional measurement for laboratory and clinical data.
Hematocrit Correction in Venous Blood
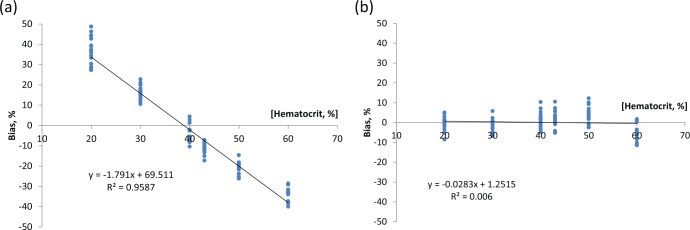
In Figure 4 the result of applying the on-strip calibration correction to a series of venous blood samples manipulated to Hct levels between 20% and 60% and sample glucose levels of 36-540 mg/dl are shown as bias plots versus Hct level. In this experiment noncorrected prototype strip data has an Hct dependency of 1.8% per percentage Hct change. This dependency is effectively eliminated on correction.
Figure 4.
Bias of blood glucose measurement over a hematocrit range of 20-60% for prototype strips without (a) and with (b) error correction.
Temperature Correction in Venous Blood
Glucose measurement variability induced by using ambient test temperatures of 16, 26, and 31°C and venous blood samples at glucose concentrations ranging from 18 mg/dl to 540 md/dl was 2.2%/°C for the noncorrected prototype system. For the corrected prototype (using the same method used for Hct correction and without meter based ambient temperature measurement), this was reduced to less than 0.4%/°C.
Clinical Data
Study Population
In all, 160 people with diabetes participated in this study and glucose levels ranged from 52 mg/dl to 457 mg/dl. To complete the target numbers in the low glucose ranges of <50 mg/dl and 50-80 mg/dl (as per ISO 15197: 201316), additional data points were collected from healthy volunteers using capillary blood allowed to glycolyse to reduce the glycemic level to hypoglycemic ranges. Hct levels of participants in the study followed a normal distribution between 30% and 54%, with a mean of 42% (SD 4.4% Hct).
Data were excluded from statistical analysis if: a full data set (ie, all control and prototype readings, reference glucose measurements and an Hct value) was not achieved; the reference measurements were more than 4 mg/dl apart for glucose values <100 mg/dl or more than 4% apart for glucose values >100 mg/dl; or a sample handling error occurred. This reduced the number of participant data sets from 183 to 169 (145 with diabetes and 24 healthy volunteers).
The medication most commonly cited by participants was aspirin (24.3%), followed by paracetamol (16.5%) and vitamin C (6.5%). Various combinations of these medications were reported by a small overall proportion (5.3%).
Accuracy Improvement—Full Patient Data Set
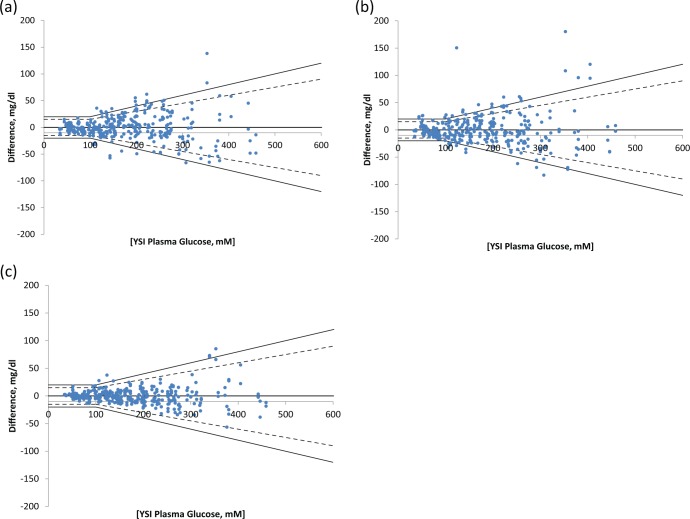
Figure 5 shows difference plots for control, noncorrected, and corrected prototype strips tested in the clinical study.
Figure 5.
Difference plots for (a) control, (b) noncorrected prototype, and (c) corrected prototype strips. The dashed line show accuracy limits of ISO 15197:2013.16
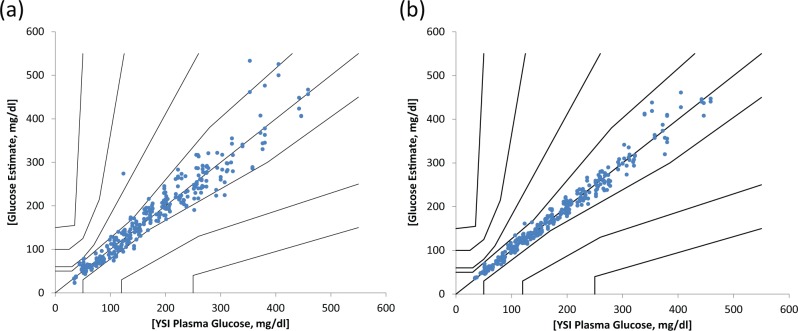
Consensus error grid analysis of the noncorrected and corrected prototype strip performance is shown in Figure 6.
Figure 6.
Consensus error grid showing clinical performance of (a) noncorrected prototype and (b) corrected prototype strips.
Note that there were 42 outliers (points with a bias of more than 20%) in the noncorrected prototype data and only 5 after correction. More than two-thirds (29) of the outliers were corrected to within ±10% of the reference value.
Table 1 shows for each of the tested “systems” the MARD and the percentage of measurement results within different deviation ranges according to ISO 15197:2013.16 Corrected prototype strips demonstrate a significantly lower amount of error compared to the same, uncorrected strips (noncorrected prototype MARD 11.1%, corrected prototype MARD 5.9%, P < .01).
Table 1.
Accuracy Results of Full Data Sets for Each of 4 Systems Tested According to ISO15197:201316 Criteria.
| DIN ISO15197:2013 |
|||||||||
|---|---|---|---|---|---|---|---|---|---|
| MARD |
Overall within accuracy limits |
<100 mg/dl |
>100 mg/dl |
||||||
| ±5 mg/dl | ±10 mg/dl | ±15 mg/dl | ±5% | ±10% | ±15% | ||||
| System | % | n | % | % | % | % | % | % | % |
| Control | 11.1 | 259/338 | 76.6 | 41.0 | 71.8 | 91.0 | 30 | 55.8 | 72.3 |
| Noncorrected prototype | 11.1 | 266/334 | 79.6 | 34.6 | 64.1 | 84.6 | 34.8 | 60.5 | 78.1 |
| Corrected prototype | 5.9 | 323/334 | 96.7 | 64.1 | 85.9 | 96.2 | 52.7 | 87.9 | 96.9 |
Data from patients who had stated taking any of aspirin, paracetamol, or vitamin C within the previous 24-hour period showed that for this group the error reduction for corrected prototype strips was similarly effective compared to the overall participant population (noncorrected prototype MARD 9.3%, corrected prototype MARD 5.5%, P < .01).
Prototype Strip to Strip Variability
The mean difference between duplicate measurements from single participant blood samples using separate prototype strips was determined as an indicator of strip to strip variability. The mean difference between noncorrected prototype duplicates was 8.1%, and mean difference between corrected prototype duplicates was 4.8% (P < .01).
Accuracy Improvement—100 Patient Data Set
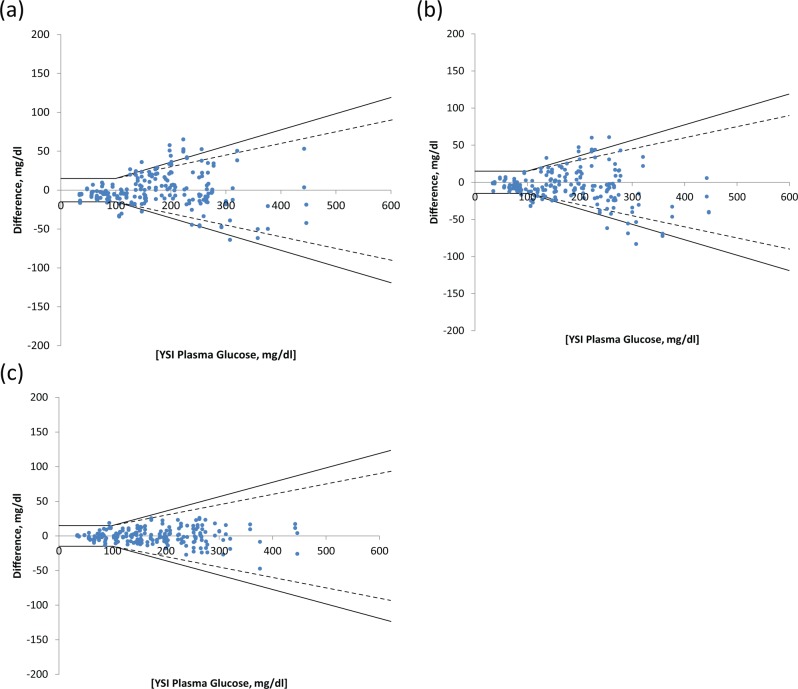
Figure 7 shows difference plots for the 100 participant subset for each of the “systems” tested.
Figure 7.
Difference plots for 100 patient data set for (a) control, (b) noncorrected prototype, and (c) corrected prototype strips.
Table 2 shows the MARD and the percentage of measurement results within different deviation ranges according to ISO 15197:201316 for the 100 participant data sub set (n = 2 per participant).
Table 2.
Accuracy Results of 100-Participant Subset for Each of 4 Systems Tested According to ISO15197: 201316 Criteria.
| DIN ISO15197:2013 |
|||||||||
|---|---|---|---|---|---|---|---|---|---|
| MARD |
Overall within accuracy limits |
<100 mg/dl |
>100 mg/dl |
||||||
| ±5 mg/dl | ±10 mg/dl | ±15 mg/dl | ±5% | ±10% | ±15% | ||||
| System | % | n | % | % | % | % | % | % | % |
| Control | 11.6 | 156/200 | 78.0 | 29.5 | 68.2 | 84.1 | 2.6 | 33.3 | 76.3 |
| Noncorrected prototype | 9.6 | 186/200 | 92.5 | 38.6 | 72.7 | 97.7 | 32.1 | 62.2 | 80.1 |
| Corrected prototype | 4.9 | 199/200 | 99.5 | 61.4 | 81.8 | 97.7 | 59.6 | 94.9 | 100 |
Results show significant improvement in accuracy with similar error correction performance as for the total patient population data set (noncorrected prototype 9.6% MARD, corrected prototype 4.9% MARD, P < .01).
Discussion
The aims of the current study were to determine whether the on-strip calibration approach corrects for common, known sources of errors in SMBG and to determine the effectiveness of the approach in correcting errors and improving clinical accuracy of SMBG from a representative population of people with diabetes.
Error Modeling and Mechanism
The diffusion-limited nature of most SMBG systems helps to reduce variability from the reagent chemistry, for example caused by change in the test temperature or enzyme instability, but can cause error due to factors, such as Hct, that impact the effective diffusion of the analyte.7
In systems without Hct correction, or means to reduce the Hct sensitivity, this error may be managed by placing a tight Hct specification on the system of, say, 30-55%. As data from the clinic show, this approach could cover the Hct range seen in a typical user population, but the Hct sensitivity even within this range would make a significant contribution to the overall error budget. For example, the uncorrected Hct sensitivity of 1.8% bias per percentage Hct change we observed in lab studies in prototype strips would give rise to a bias of over ±20%.
In the on-strip calibration approach, the correction is based on measurement of the signal from the actual analyte. Factors such as manufacturing and storage variability and diffusional variability caused by sample matrix changes that affect the calibration reading affect the sample glucose reading in a similar way. The use of the target species itself as the calibrant therefore allows for correction of errors arising from sample matrix and detector variability.
Data showing effective correction of temperature induced error were generated using the same correction algorithm and calibration as used in the initial Hct experiments. Significant deviation of the actual test temperature can cause error by altering the diffusion rate of glucose through the sample and the rate of reaction of the chemistry.7 Thus, the finding that the same correction algorithm derived from the Hct study is effective for correcting temperature induced errors supports the concept of using the actual target species as the calibrator. If required, it would also be possible to use meter based temperature measurement as an additional input into the overall correction.
Other experiments (not reported here) have shown that the on-strip calibration approach can correct coding error,9 where an inappropriate calibration code is applied to a batch, demonstrating that on-strip calibration using the target analyte corrects for multiple and diverse sources of BGM error.
Clinical BGM Error Correction
The relationship between bias and the Gc signal parameter is very similar for clinical testing as it was for laboratory based Hct and temperature error evaluation, as shown in Figure 3. This demonstrates that the concept of measuring and correcting error is valid for the varied error sources experienced in normal testing.
Analysis suggests that around 50% of the total error seen in the clinic setting was attributable to Hct variation (r2 = .5). This is a large component, especially given the relatively narrow range of Hct levels observed in the population. After correction, the Hct sensitivity was effectively eliminated (r2 = .02).
As noted previously, the error in clinic and lab testing attributable to manufacturing variability is likely to be substantially higher in our prototype strips than for commercialized strips where manufacturing processes are carefully controlled. However, the mean difference between duplicates was significantly reduced by applying the correction. This, together with the previously observed reduction of coding error, suggests that strip to strip differences can be reduced through the on-strip calibration approach.
Because of the fundamental nature of the on-strip calibration correction technique (ie, determining the error associated with a measurement of a predetermined amount of test analyte alongside unknown sample measurement), it seems likely that other error sources (such as altitude and oxygen tension) will be correctable, although we have not investigated these. We have separately shown that our approach is compatible with different chemistries (eg, glucose oxidase and glucose dehydrogenase based) and strip constructions (carbon ink and noble metal based). In addition, the low cost of the ingredients in the glucose coating formulation and the use of high volume, established coating processes means that the additional cost is very low (we have estimated this as less than 0.01 c/strip) and can be offset by choice of cheaper base sensor constructions.
It is interesting to note that according to the recent report of Tack et al13 the noncorrected performance of prototype strips is similar to the lowest performing of the leading commercially available systems tested in that study (as might be expected given the strip and meter developmental status), but the corrected performance is close to the leading end of those reported despite the strips being made by hand in our laboratories.
As discussed above, we created a subset of data from 100 participants to represent a better performing base strip to anticipate potential performance in a more developed system where strip to strip imprecision would be lower, but also to assess efficacy of the error correction approach with a “good standard” of base strip. Specifically, we wanted to determine whether the significant improvement in performance was maintained, when more variable data were removed, as it could be surmised that improvement was a consequence of correction of gross errors. In fact, results (Table 2) show significant and similar improvement in accuracy compared to the results for the total population. The corrected prototype performance for the 100 participant subset is at the leading end of the reported performance of the commercially available systems tested.13
Conclusions
In the on-strip calibration approach reported here for SMBG, glucose is incorporated within a BGM strip to provide a calibration of each and every test conducted. This study demonstrated a way to implement this approach using a standard strip design with no requirement for increased blood sample volume or time to result. Data show that this approach substantially and significantly reduces Hct and temperature induced errors. In clinical testing of fingerstick-derived blood samples from people with diabetes, error was shown to be reduced from MARD of 11.1% to 5.9%, and the number of outliers was reduced by approximately 90%.
This study has been conducted using manually fabricated prototype strips and we anticipate further improvements in analytical performance as the manufacturing approach is developed. Because it does not require the development of novel strip architectures or new manufacturing processes, we expect the approach to enable high performance at low cost. Finally, we believe that adoption of this novel approach has the potential to enhance significantly the analytical accuracy of BGM systems, while maintaining those features of low blood sample volume and fast time to result that are valued by users and conducive to frequent testing.
Acknowledgments
We thank Dr Anne Kilvert of Northampton General Hospital NHS Trust, for providing insightful peer review of the clinical protocol and the clinical staff at the Diabetes Centre, and the Research Office Staff of the Ipswich Hospital NHS Trust for help in developing and running the clinical study.
Footnotes
Abbreviations: BGMS, blood glucose monitoring system; Gc, calibration glucose; Gs, sample glucose; Hct, hematocrit; ISO, International Organization for Standardization; MARD, mean absolute relative deviation; SMBG, self-monitoring of blood glucose.
Declaration of Conflicting Interests: The author(s) declared the following potential conflicts of interest with respect to the research, authorship, and/or publication of this article: MN, JR, DE, SB, ZH, and SK are employees of PA Consulting Group. Exacsys Ltd is wholly owned by PA Consulting Group. GR and the research team at Ipswich Hospital were contracted by PA Consulting Group to provide expert advice and to recruit patients.
Funding: The author(s) disclosed receipt of the following financial support for the research, authorship, and/or publication of this article: This study was funded by PA Consulting Group.
References
- 1. American Diabetes Association. Standards of medical care in diabetes—2009. Diabetes Care. 2009;32(suppl 1):S13-S61. [DOI] [PMC free article] [PubMed] [Google Scholar]
- 2. IDF Clinical Guidelines Task Force. Global guideline for type 2 diabetes: recommendations for standard, comprehensive, and minimal care. Diabetes Med. 2006;23(6):579-593. [DOI] [PubMed] [Google Scholar]
- 3. UK Prospective Diabetes Study Group. UK Prospective Diabetes Study 16. Overview of 6 years’ therapy of type II diabetes: a progressive disease. Diabetes. 1995;44:1249-1258. [PubMed] [Google Scholar]
- 4. Diabetes Control and Complications Trial Research Group. The effect of intensive treatment of diabetes on the development and progression of long-term complications in insulin-dependent diabetes mellitus. N Engl J Med. 1993;329(14):977-986. [DOI] [PubMed] [Google Scholar]
- 5. Subramanian SL, Hirsch IB. The utility and recent advances in self-monitoring of blood glucose in type 1 diabetics. Diabetes Technol Ther. 2008;10(S1):S43-S50. [Google Scholar]
- 6. Heinemann L, Lodwig V, Freckmann G. Accuracy in blood glucose measurement: what will a tightening of requirements yield? J Diabetes Sci Technol. 2012;6(2):435-443. [DOI] [PMC free article] [PubMed] [Google Scholar]
- 7. Hones J, Müller P, Surridge N. The technology behind glucose meters: test strips. Diabetes Technol Ther. 2008;10(S1):S10-S26. [Google Scholar]
- 8. Deng Y, Jamison SJ. Methods for performing hematocrit adjustment in glucose assays and devices for same. World Intellectual Property Organization Pub. No. WO/2005/114163. Available at: http://patentscope.wipo.int/search/en/WO2005114163. Accessed July 9, 2013.
- 9. Ginsberg BH. Factors affecting blood glucose monitoring: sources of errors in measurement. J Diabetes Sci Technol. 2009;3(4):903-913. [DOI] [PMC free article] [PubMed] [Google Scholar]
- 10. FDA/CDRH Public Meeting: Blood Glucose Meters— March 16-17, 2010. Available at: http://www.fda.gov/MedicalDevices/NewsEvents/WorkshopsConferences/ucm187406.htm#transcripts. Accessed July 5, 2013.
- 11. Freckmann G, Baumstark A, Jendrike N, et al. System accuracy evaluation of 27 blood glucose monitoring systems according to DIN EN ISO 15197. Diabetes Technol Ther. 2010;12(3):221-231. [DOI] [PubMed] [Google Scholar]
- 12. Freckmann G, Schmid C, Baumstark A, Pleus S, Link M, Haug C. System accuracy evaluation of 43 blood glucose monitoring systems for self-monitoring of blood glucose according to DIN EN ISO 15197. 2012. J Diabetes Sci Technol. 2012;6(5):1060-1075. [DOI] [PMC free article] [PubMed] [Google Scholar]
- 13. Tack C, Pohlmeier M, Behnke M, et al. Accuracy evaluation of five blood glucose monitoring systems obtained from the pharmacy: a European multicentre study with 453 subjects. Diabetes Technol Ther. 2012;14(4):330-337. [DOI] [PMC free article] [PubMed] [Google Scholar]
- 14. Kuo CY, Hsu CT, Ho CS, Su TE, Wu MH, Wang CJ. Accuracy and precision evaluation of seven self-monitoring blood glucose systems. Diabetes Technol Ther. 2011:13(5):596-600. [DOI] [PubMed] [Google Scholar]
- 15. International Organization for Standardization. In vitro diagnostic test systems—requirements for blood-glucose monitoring systems for self-testing in managing diabetes mellitus. DIN EN ISO 15197:2003. [Google Scholar]
- 16. International Organization for Standardization. In vitro diagnostic test systems—Requirements for blood-glucose monitoring systems for self-testing in managing diabetes mellitus. DIN EN ISO 15197:2013 [Google Scholar]
- 17. Baumstark A, Pleus S, Schmid C, Link ME, Haug C, Freckmann G. Lot-to-lot variability of test strips and accuracy assessment of systems for self-monitoring of blood glucose according to ISO 15197. J Diabetes Sci Technol. 20126(5):1076-1086. [DOI] [PMC free article] [PubMed] [Google Scholar]
- 18. Skeie S, Thue G, Nerhus K, Sandberg S. Instruments for self-monitoring of blood glucose: comparisons of testing quality achieved by patients and a technician. Clin Chem. 2002;48(7):994-1003. [PubMed] [Google Scholar]
- 19. Nerhus M, Rustad P, Sandberg S. Effect of ambient temperature on analytical performance of self-monitoring blood glucose systems. Diabetes Technol Ther. 2011;13(9):883-892. [DOI] [PubMed] [Google Scholar]
- 20. Teodorczyk M, Cardosi M, Setford S. Hematocrit compensation in electrochemical blood glucose monitoring systems. J Diabetes Sci Technol. 2012;6(3):648-655. [DOI] [PMC free article] [PubMed] [Google Scholar]
- 21. Bland JM, Altman DG. Statistical methods for assessing agreement between two methods of clinical measurement. Lancet. 1986;1(8476):307-310. [PubMed] [Google Scholar]
- 22. Wilmoth DR. The relationships between common measures of glucose meter performance. J Diabetes Sci Technol. 2012;6(5):1087-1093. [DOI] [PMC free article] [PubMed] [Google Scholar]
- 23. Parkes JL, Slatin SL, Pardo S, Ginsberg BH. A new consensus error grid to evaluate the clinical significance of inaccuracies in the measurement of blood glucose. Diabetes Care. 2000;23(8):1143-1148. [DOI] [PubMed] [Google Scholar]
- 24. Bartlett PN, Toh CS. Kinetic modelling for biosensors. In: Biosensors: A Practical Approach. 2nd ed. Oxford, UK: Oxford University Press; 2003:59-96. [Google Scholar]


