Abstract
Background:
We have previously shown that intravascular microdialysis in a central vein is an accurate method for continuous glucose monitoring in patients undergoing cardiac surgery. However, no hypoglycemia occurred in our earlier studies, prompting further evaluation of the accuracy of intravascular microdialysis in the hypoglycemic range. Thus, this animal study was performed.
Method:
A porcine model was developed; hypoglycemia was induced using insulin injections. The pigs were monitored with intravascular microdialysis integrated in a triple-lumen central venous catheter. As reference, venous blood gas samples were taken every 5 minutes and analyzed in a blood gas analyzer. Ethical permission for the animal experiments was obtained from the Stockholm Regional Ethical Committee, reference no N397/09.
Results:
A total of 213 paired samples were obtained for analysis, and 126 (59.2%) of these were in the hypoglycemic range (<74 mg/dl). Using Clarke error grid analysis, 100% of the paired samples were in region AB and 99% in region A. The ISO standard (ISO15197) was met. Bland–Altman analysis showed bias (mean difference) ± limits of agreement was −0.18 ± 16.2 mg/dl. No influence from glucose infusions was seen. The microdialysis monitoring system was found to be very responsive in rapid changes in blood glucose concentration.
Conclusions:
This study shows that intravascular microdialysis in a central vein is an accurate method for continuous glucose monitoring in hypoglycemia in a porcine experimental model. Furthermore, the system was not influenced by glucose administration and was found to be responsive in rapid blood glucose fluctuations.
Keywords: continuous glucose monitoring, critically ill patients, hypoglycemia, microdialysis
Critically ill patients frequently develop hyperglycemia,1 which is associated with increased mortality.2 This has resulted in several studies investigating a tight glycemic control (TGC) in patients admitted to intensive care units (ICU),3-7 with diverging results. The Normoglycemia in Intensive Care Evaluation–Survival Using Glucose Algorithm Regulation (NICE-SUGAR) trial suggested that critically ill patients assigned to TGC had an increased risk of death.7 However, the reason for this increased mortality has yet to be determined. Patients receiving TCG is at an increased risk of hypoglycemia,4,6-8 which may be 1 possible explanation. Hence, glucose control is of importance in the ICU both to treat hyperglycemia but also to detect and avoid hypoglycemia, which has independently been associated with increased mortality in critically ill patients9-11 and increased intensive care unit length of stay.12 Improved glycemic control may also reduce glucose variability, another factor associated with adverse outcomes in critically ill patients.13,14
Today continuous glucose monitoring (CGM) is being used in critically ill patients with promising results.15 CGM may provide improved glucose control in this patient category since the detection of both hypo- and hyperglycemia is simplified.16,17 We have previously evaluated CGM using intravascular microdialysis,18 a technique that provides CGM without blood sampling using a triple-lumen catheter (TLC) placed in a central vein. The TLC is a central venous catheter with an integrated microdialysis function, thus enabling both drug administration and blood sampling while simultaneously providing CGM using microdialysis. We found intravascular microdialysis to be accurate and clinically feasible when comparing microdialysis glucose values with reference arterial blood gas glucose values.18 However, no hypoglycemic glucose values were obtained in our earlier study population consisting of patients undergoing cardiac surgery. Thus, the microdialysis system was not adequately evaluated in the hypoglycemic range. This study was designed to test the accuracy of the intravascular microdialysis method in the hypoglycemic range by inducing hypoglycemia in a porcine model. Furthermore, we studied the potential influence of glucose administration through the TLC and the system’s responsiveness to fluctuating blood glucose concentrations.
Methods
A porcine model was developed to test the intravascular microdialysis system in hypoglycemia. In total 10 pigs were used in the study. The first pig was used as a pilot to establish the animal model and study protocol, and the results from this animal were not included for analysis. Ethical permission for the animal experiments was obtained from the Stockholm Regional Ethical Committee, application N397/09 with acceptance 2009-12-17. All animals received humane care in compliance with the European Convention on Animal Care, and the investigation conforms with the care and use of Laboratory Animals published by the US National Institute of Health (NIH Publication 85-23, revised 1985).
The animals were subjected to general anesthesia and monitored using the Eirus™ microdialysis system (Maquet Critical Care, Solna, Sweden), consisting of a microdialysis TLC (length 16 cm, diameter 7 Fr) connected to a sensor and monitor. The TLC is a radiopaque central venous catheter (CVC) with a microdialysis membrane proximal to the infusion holes; thus the catheter functions as a regular CVC while integrating the microdialysis function. The TLC has 3 infusion channels: 1 end hole and 2 side holes. The end hole is situated 20 mm from the side holes, which are placed 10 mm from each other. All infusion channels are distal to the microdialysis membrane. During the study, the end hole was used for all drug administration (both infusions and injections).
The microdialysis membrane is perfused with sodium chloride and diffusion creates a dialysate with the same glucose concentration as the blood. The catheter is connected to a sensor and monitor system that continuously (every second) measure and display the blood glucose value. The glucose values displayed on the monitor had a lag time of 5 minutes corresponding to the time it takes to perfuse the microdialysis system.
The electrochemical sensor (disposable) used for analysis of the dialysate from the microdialysis catheter is a low-volume flow-through sensor. Glucose is oxidized by the enzyme glucose oxidase and the thereby produced H2O2 is subsequently oxidized at a platinum electrode. The sensor is connected to a sensor reader, which converts the currents from the electrodes to digital signals that is handled by the monitor. The monitor converts the sensor signals to concentration values and presents the values to the user (as a trend graph and a numerical value) on the screen. The monitor has configurable alarms for hypoglycemia and target glucose interval (optional). The pump for delivery of perfusion fluid to the catheter is an integrated part of the monitor.
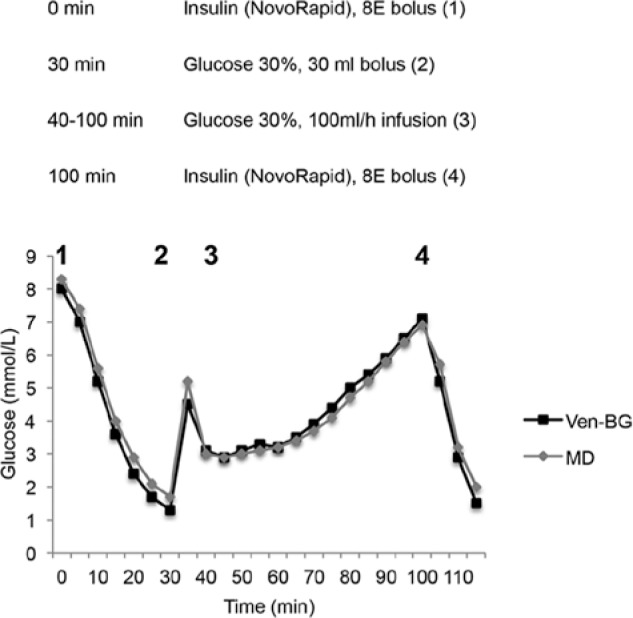
The TLC was placed in the superior vena cava at the entrance to the right atrium, and was used for all drug administration and blood sampling. Hypoglycemia was induced with an insulin bolus dose (8 units NovoRapid®; Novo Nordisk Scandinavia AB, Bagsvaerd, Denmark), marking the initiation of the analysis period (time 0). After 30 minutes, a 30 ml glucose bolus dose of 30% glucose was given to reverse the hypoglycemia and at 40 minutes, a glucose infusion at 100 ml/h was initiated. At 100 min another insulin bolus dose of 8 units NovoRapid was given and blood glucose was followed for another 20 minutes. The general protocol and a typical glucose curve from 1 of the animals are shown in Figure 1. After the end of the analysis period the animals were terminated. The position of the TLC was controlled postmortem.
Figure 1.

Study protocol and typical glucose graph over time. MD, microdialysis glucose value from triple-lumen catheter in superior vena cava position; Ven-BG, venous blood gas glucose.
As reference, both arterial and venous blood was drawn every 5 minutes and analyzed in a blood gas analyzer (ABL800 FLEX®, Radiometer Medical, Copenhagen, Denmark). The corresponding microdialysis glucose value was registered from the monitor. The arterial blood was drawn from an arterial line in the right femoral artery and the venous blood was drawn from the TLC (the most proximal side hole). The microdialysis glucose values were then paired with arterial/venous blood gas glucose values for comparing analysis. The microdialysis system was calibrated once at the beginning of the monitoring period before provoking hypoglycemia, using arterial blood gas glucose values in all animals.
Data Analysis
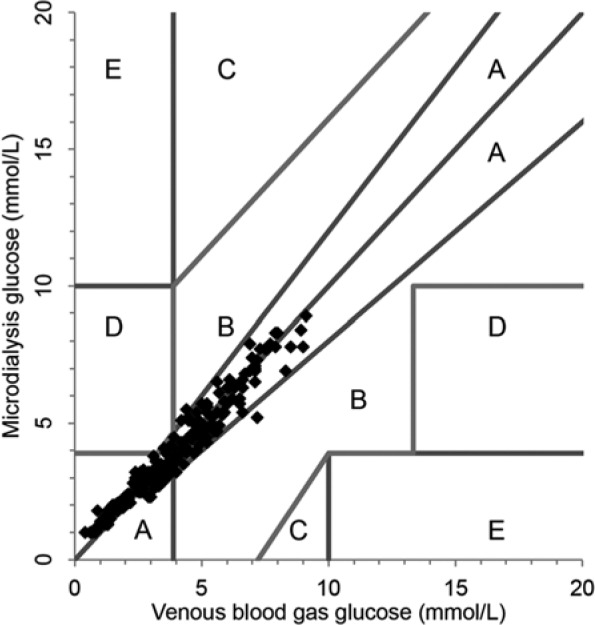
Venous blood gas glucose values were chosen as reference to the microdialysis glucose values in the comparative analyses. Clarke error grid analysis (EGA) was made to evaluate the clinical accuracy. The EGA plots paired samples in 5 distinct zones of different significance.19 Values in zone A are within 20% of the reference value and have no clinical implications. Values in zone B exceed 20% difference from reference value but lead to appropriate clinical decisions. Values in zone C may lead to unnecessary but harmless corrections. Values in zones D and E represent overestimation of hypoglycemia (failure to detect) or underestimation of hyperglycemia that may lead to incorrect clinical actions. In short, the more values in zones A and B, the more clinical accuracy of the method.
The accuracy of intravascular microdialysis was further evaluated according to the criteria of the International Organization for Standardization (ISO15197),20 in which 95% of the test glucose values have to be within ±20% of reference values if the reference value is >74 mg/dl (>4.1 mmol/L) or within ±14.4 mg/dl (±0.8 mmol/L) if the reference value is <74 mg/dl (4.1 mmol/L). Bland–Altman analysis21 was used to compare the bias (mean of difference) and limits of agreement (bias ± 1.96SD).
Results
Data from 9 pigs were included for analysis. A total of 213 paired venous blood gas and microdialysis glucose values (TLC placed in superior vena cava) were obtained. Of these, 59.2% (n = 126) were in the hypoglycemic range, that is, <74 mg/dl (<4.1 mmol/L).
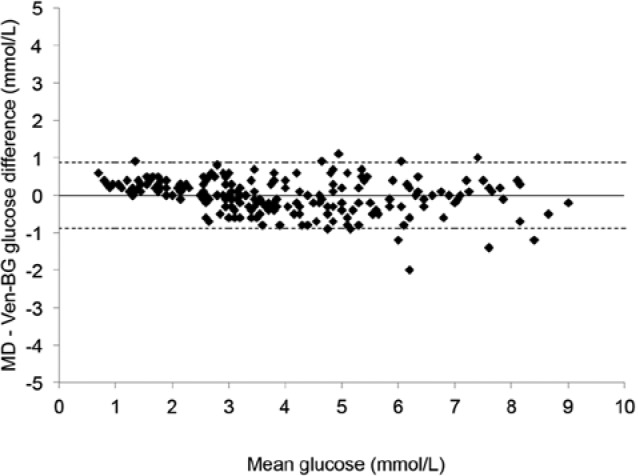
Mean microdialysis glucose was 70 ± 33 mg/dl (3.89 ± 1.84 mmol/L), and mean venous blood gas glucose was 70.5 ± 35 mg/dl (3.91 ± 1.96 mmol/L). Mean difference (bias) was −0.18 ± 8.1 mg/dl (−0.01 ± 0.45 mmol/L) and absolute difference was 6.3 ± 5 mg/dl (0.35 ± 0.29 mmol/L). Mean absolute difference was 11.8%. Using Clarke EGA, 100% of the paired samples were in region AB and 99% in region A (Figure 2). Bland–Altman analysis showed bias ± limits of agreement (± 1.96 SD) were −0.18 ± 16.2 mg/dl (−0.01 ± 0.9 mmol/L) (Figure 3). The ISO standard (ISO15197) was met, as 97.7% of the paired samples were within ±20% (if >74 mg/dl) or ±14.4 mg/dl (if <74 mg/dl). Pearson correlation coefficient was .97 (P < .0001).
Figure 2.

Clarke error grid analysis of paired microdialysis glucose values with reference venous blood gas glucose values. All paired values in zones A and B.
Figure 3.

Bland–Altman analysis of microdialysis glucose values with reference venous blood gas glucose values, plotting the difference between the 2 methods against the mean glucose value. The straight line represents bias (mean difference), and the dotted lines represent lines of agreement (± 1.96 SD). MD, microdialysis glucose value from triple-lumen catheter in superior vena cava position; Ven-BG, venous blood gas.
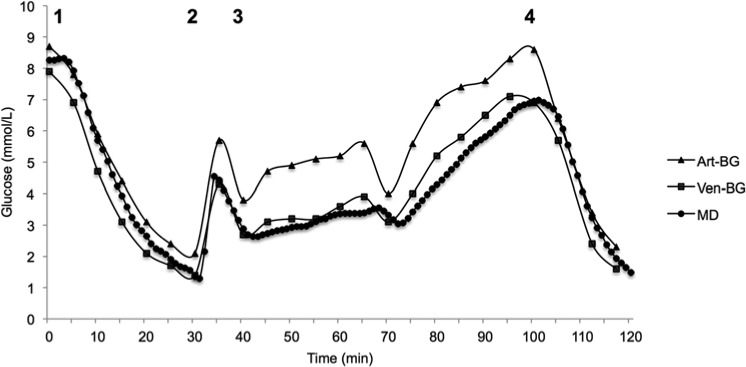
A graph plotting the blood glucose concentrations (reference venous blood gas glucose concentration, arterial blood gas glucose concentration as well as the continuous microdialysis glucose concentration) against time during the experiment for 1 typical animal displays how well the microdialysis technique follows fast fluctuations in blood glucose concentration (Figure 4). Figure 4 also highlights a recurrent finding in all the animals; arterial blood gas glucose values were consistently higher than microdialysis and venous blood gas glucose values during glucose administration (bolus dose and infusion). This is further illustrated by a higher mean arterial blood gas glucose, 90 ±37.5 mg/dl (5 ± 2.1 mmol/L), compared to mean microdialysis and venous blood gas glucose concentrations. Bland–Altman analysis comparing arterial blood gas and venous blood gas glucose concentrations yielded bias ± limits of agreement (± 1.96 SD) of −7 ± 19.8 mg/dl (−0.39 ± 1.1 mmol/L) during insulin administration and −26.8 ± 23.4 mg/dl (−1.49 ± 1.3 mmol/L) during glucose administration. Of all arterial blood gas glucose values, 33.7% were within the hypoglycemic range.
Figure 4.
Graph displaying the different blood glucose concentrations from 1 animal over time during the experiment. Arterial blood gas glucose values are higher during glucose administration (numbers in the figure represent the different study phases as described in Figure 1). Art-BG, arterial blood gas; MD, microdialysis glucose value from triple-lumen catheter in superior vena cava position; Ven-BG, venous blood gas.
No major influence during glucose administration (bolus dose and infusion) was seen. Mean glucose difference (microdialysis – venous blood gas glucose) during (1) first insulin administration, (2) glucose bolus dose, (3) glucose infusion, and (4) second insulin administration was (1) 5 ± 4.8 mg/dl, (2) 7.4 ± 6.3 mg/dl, (3) −4.9 ± 6.5 mg/dl, and (4) 1.1 ± 9.2 mg/dl. There was no significant difference between venous blood gas glucose concentration and microdialysis glucose concentration during the 4 different phases mentioned above (P value > .05 for all).
Discussion
In this study we have evaluated the accuracy of intravascular microdialysis for CGM in hypoglycemia, the responsiveness in rapid fluctuating glucose concentrations, and potential influence of glucose administration in an animal model using pigs. The agreement between microdialysis glucose values and reference values using venous blood gas analysis was satisfactory. The mean difference between the methods was low; all values were within region AB in the Clarke EGA, and the ISO criteria (ISO15197) were met.
In the present study no influence from bolus injections or infusions of high concentration glucose in the TLC could be seen. We conclude this from the fact that there was no statistical significance between glucose values measured by microdialysis or venous blood gas during either insulin or glucose administration. This is further noteworthy since glucose was administered in high concentration. In addition, the microdialysis system was responsive in rapid glucose fluctuations and no lag time (expect for the perfusion lag time of 5 minutes) was seen.
One advantage of the intravascular microdialysis method is that no blood sampling is required for the continuous monitoring of blood glucose. The microdialysis membrane is integrated in a TLC that functions as a normal CVC (for drug administration and blood sampling when needed) besides the microdialysis function. For critically ill patients requiring a CVC, intravascular microdialysis may be an appealing option.
Reference glucose values in this study were chosen to be venous blood gas glucose values. In previous studies we have used arterial blood gas glucose values as reference. The reason for this inconsistency was that in this animal study we wanted to investigate rapid fluctuations and the responsiveness of the microdialysis system, indicating that measuring glucose at the same site (central vein) would be preferable. However, arterial blood gas is by many clinicians considered the standard method for blood glucose concentration analysis in critically ill patients.
One interesting finding in this study was that arterial blood glucose concentration was consistently higher during glucose administration (Figure 4). We hypothesize that this is due to the fact that glucose administered in an artery has not yet been processed by the body. Once the administered glucose has passed through the capillaries and is returned with venous blood the glucose concentration will be lower. To what extent this has clinical implications in ICUs that monitor blood glucose concentration using only arterial blood gas remains unclear, among patients with ongoing high concentration glucose infusions. However, we have in our previous studies demonstrated good agreement between central vein blood glucose concentration (measured by microdialysis) and arterial blood glucose concentration (measured by arterial blood gas).18 This finding is nonetheless noteworthy.
We used EGA to evaluate the clinical accuracy of the intravascular microdialysis system for CGM. The EGA has been suggested to be of limited use in critically ill patients since it was not developed for use in this patient category and it does not consider the rate at which blood glucose concentration is changing. Neither does it consider whether blood glucose is measured intermittently or continuously. However, since the EGA is widely used in studies comparing blood glucose measurements by 2 techniques, this analysis were made nonetheless.
In view of the ongoing discussion regarding the danger of hypoglycemia occurring in patients with TGC and the lack of ability to detect this, an accurate CGM system seems essential. As was previously shown, intravascular microdialysis can be used in critically ill patients.18,22 This study adds the evaluation of this method in hypoglycemia and during high-concentration glucose administration. Thus we found the intravascular microdialysis to be accurate in all scenarios. To what extent this is clinically beneficial to critically ill patients remains to be further studied.
Conclusion
We have in this study shown that intravascular microdialysis is an accurate method for CGM in hypoglycemia in a porcine animal model. Furthermore, the accuracy of intravascular microdialysis does not seem to be affected by glucose administration or rapid changes in blood glucose. Intravascular microdialysis may thus be beneficial for critically ill patients in need of a CVC to achieve improved glycemic control and avoidance of glycemic variability and hypoglycemia.
Acknowledgments
We thank the Mats Kleberg Foundation and the Signe and Olof Wallenius Foundation for financially supporting this study.
Footnotes
Abbreviations: CGM, continuous glucose monitoring; CVC, central venous catheter; EGA, error grid analysis; ICU, intensive care unit; ISO, International Organization for Standardization; SLC, single-lumen catheter; TGC, tight glycemic control; TLC, triple-lumen catheter.
Declaration of Conflicting Interests: The author(s) declared the following potential conflicts of interest with respect to the research, authorship, and/or publication of this article: JL and AF have a royalty agreement with Maquet Critical Care, Solna, Sweden. MW is employed by Maquet Critical Care, Solna, Sweden.
Funding: The author(s) disclosed receipt of the following financial support for the research, authorship, and/or publication of this article: This work was funded by the Mats Kleberg Foundation and the Signe and Olof Wallenius Foundation.
References
- 1. Inzucchi SE. Clinical practice. Management of hyperglycemia in the hospital setting. N Engl J Med. 2006;355(18):1903-1911. [DOI] [PubMed] [Google Scholar]
- 2. Krinsley JS. Association between hyperglycemia and increased hospital mortality in a heterogeneous population of critically ill patients. Mayo Clin Proc. 2003;78(12):1471-1478. [DOI] [PubMed] [Google Scholar]
- 3. Van den Berghe G, Wilmer A, Hermans G, et al. Intensive insulin therapy in the medical ICU. N Engl J Med. 2006;354(5):449-461. [DOI] [PubMed] [Google Scholar]
- 4. van den Berghe G, Wouters P, Weekers F, et al. Intensive insulin therapy in the critically ill patients. N Engl J Med. 2001;345(19):1359-1367. [DOI] [PubMed] [Google Scholar]
- 5. Arabi YM, Dabbagh OC, Tamim HM, et al. Intensive versus conventional insulin therapy: a randomized controlled trial in medical and surgical critically ill patients. Crit Care Med. 2008;36(12):3190-3197. [DOI] [PubMed] [Google Scholar]
- 6. Brunkhorst FM, Engel C, Bloos F, et al. Intensive insulin therapy and pentastarch resuscitation in severe sepsis. N Engl J Med. 2008;358(2):125-139. [DOI] [PubMed] [Google Scholar]
- 7. Finfer S, Chittock DR, Su SY, et al. Intensive versus conventional glucose control in critically ill patients. N Engl J Med. 2009;360(13):1283-1297. [DOI] [PubMed] [Google Scholar]
- 8. Preiser JC, Brunkhorst F. Tight glucose control and hypoglycemia. Crit Care Med. 2008;36(4):1391; author reply 1391-1392. [DOI] [PubMed] [Google Scholar]
- 9. Egi M, Bellomo R, Stachowski E, et al. Hypoglycemia and outcome in critically ill patients. Mayo Clin Proc. 2010;85(3):217-224. [DOI] [PMC free article] [PubMed] [Google Scholar]
- 10. Krinsley JS, Grover A. Severe hypoglycemia in critically ill patients: risk factors and outcomes. Crit Care Med. 2007;35(10):2262-2267. [DOI] [PubMed] [Google Scholar]
- 11. Krinsley JS, Schultz MJ, Spronk PE, et al. Mild hypoglycemia is independently associated with increased mortality in the critically ill. Crit Care. 2011;15(4):R173. [DOI] [PMC free article] [PubMed] [Google Scholar]
- 12. Krinsley J, Schultz MJ, Spronk PE, et al. Mild hypoglycemia is strongly associated with increased intensive care unit length of stay. Ann Intensive Care. 2011;1:49. [DOI] [PMC free article] [PubMed] [Google Scholar]
- 13. Egi M, Bellomo R. Reducing glycemic variability in intensive care unit patients: a new therapeutic target? J Diabetes Sci Technol. 2009;3(6):1302-1308. [DOI] [PMC free article] [PubMed] [Google Scholar]
- 14. Krinsley JS. Glycemic variability: a strong independent predictor of mortality in critically ill patients. Crit Care Med. 2008;36(11):3008-3013. [DOI] [PubMed] [Google Scholar]
- 15. Brunner R, Kitzberger R, Miehsler W, Herkner H, Madl C, Holzinger U. Accuracy and reliability of a subcutaneous continuous glucose-monitoring system in critically ill patients. Crit Care Med. 2011;39:659-664. [DOI] [PubMed] [Google Scholar]
- 16. Joseph JI, Hipszer B, Mraovic B, Chervoneva I, Joseph M, Grunwald Z. Clinical need for continuous glucose monitoring in the hospital. J Diabetes Sci Technol. 2009;3(6):1309-1318. [DOI] [PMC free article] [PubMed] [Google Scholar]
- 17. Kavanagh BP, McCowen KC. Clinical practice. Glycemic control in the ICU. N Engl J Med. 2010;363(26):2540-2546. [DOI] [PubMed] [Google Scholar]
- 18. Schierenbeck F, Owall A, Franco-Cereceda A, Liska J. Evaluation of a continuous blood glucose monitoring system using a central venous catheter with an integrated microdialysis function. Diabetes Technol Ther. 2013;15(1):26-31. [DOI] [PubMed] [Google Scholar]
- 19. Clarke WL. The original Clarke error grid analysis (EGA). Diabetes Technol Ther. 2005;7(5):776-779. [DOI] [PubMed] [Google Scholar]
- 20. ISO15197 (2003). Requirements for in vitro blood glucose monitoring systems for self-testing in managing diabetes mellitus. [Google Scholar]
- 21. Bland JM, Altman DG. Comparing methods of measurement: why plotting difference against standard method is misleading. Lancet. 1995;346(8982):1085-1087. [DOI] [PubMed] [Google Scholar]
- 22. Blixt C, Rooyackers O, Isaksson B, Wernerman J. Continuous on-line glucose measurement by microdialysis in a central vein. A pilot study. Crit Care. 2013;17(3):R87. [DOI] [PMC free article] [PubMed] [Google Scholar]


