Abstract
Understanding how biological molecules are generated, metabolized and eliminated in living systems is important for interpreting processes such as immune response and disease pathology. While genomic and proteomic studies have provided vast amounts of information over the last several decades, interest in lipidomics has also grown due to improved analytical technologies revealing altered lipid metabolism in type 2 diabetes, cancer, and lipid storage disease. Mass spectrometry (MS) measurements are currently the dominant approach for characterizing the lipidome by providing detailed information on the spatial and temporal composition of lipids. However, interpreting lipids’ biological roles is challenging due to the existence of numerous structural and stereoisomers (i.e. distinct acyl chain and double-bond positions), which are often unresolvable using present approaches. Here we show that combining liquid chromatography (LC) and structurally-based ion mobility spectrometry (IMS) measurement with MS analyses distinguishes lipid isomers and allows insight into biological and disease processes.
Keywords: Lipidomics, Isomers, Ion Mobility Spectrometry, Mass Spectrometry
INTRODUCTION
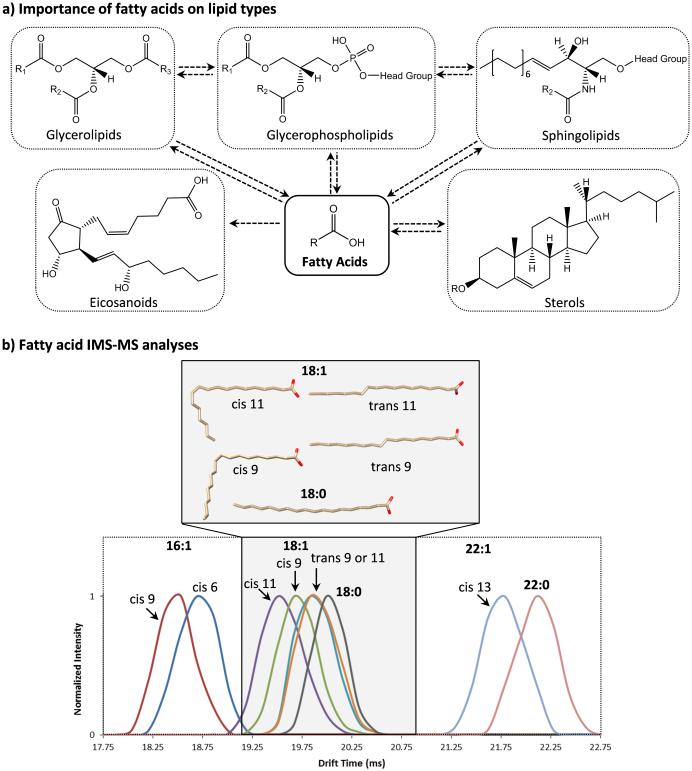
Lipids are the primary component of the cell membrane and play a vital role in regulating many cellular processes. While traditional lipidomic research has focused on characterizing cell membranes to determine their various biological roles, more recent studies have centered on unraveling lipid functions for development of novel disease treatment therapies [1, 2]. Understanding the biological mechanisms of lipids however, has proven to be quite difficult since lipids are not polymers with distinct repeating subunits like many other biomolecules such as carbohydrates, nucleic acids and proteins which have monosaccharide, nucleotide and amino acid subunits. Instead, lipids are composed of simple hydrocarbon backbones and fatty acid chains arranged at distinct positions (i.e. sn-1 versus sn-2) with intra-structural orientation differences in double bonds and functional groups (Figure 1). A vast array of lipid stereoisomers results from these small variations in structure with unique roles in lipid homeostasis and pathology [3]. However, the physiological roles and functions of these many structural and stereospecific lipid isomers remain understudied and largely unknown.
Figure 1.
a) A schematic illustrating fatty acids are essential components of the different lipid categories as well as eicosanoids. b) IMS analyses of fatty acid standards with different double bond locations and orientations illustrating that double bonds with a cis-orientation have a smaller structure than those with trans-orientations, while saturated FAs have the largest structure. The 3D lowest energy structures of the 18:1 and 18:0 FAs show how the double bond position and orientation impact the size of the FA chain.
Most lipidomic studies currently leverage the sensitivity and specificity of LC-MS and LC-MS/MS measurements [4]. LC-MS analyses have been somewhat successful in resolving isomeric standards, such as those that differ by only a sn-1/sn-2 fatty acid position [5, 6] or have cis/trans alkenes [7]. However, confidently discerning lipid isomers in complex biological matrices has often been problematic since many cannot be effectively distinguished [8], consequently, hindering our understanding of the mechanisms by which lipid structures affect biological processes. Significant advancements have been made in the MS-based characterization of lipid isomers using charge reversal and switching techniques [9, 10], radical-directed dissociation [11], low-energy collision induced dissociation [12], electron impact excitation of ions from organics (EIEIO) [13], and ozone induced dissociation [14, 15], but improved isomer separations are still needed. One appealing technique for lipidomic analyses is integrating ion mobility spectrometry (IMS) between LC and MS separations to obtain a third analytical dimension and add new structural information to the measurements. IMS-MS studies have previously been utilized to show differences in lipid categories, subclasses and isomeric standards [16-23], but have been less successful at distinguishing double bond positions or fatty acid orientations in complex mixtures since some need adducts for separation or are slow and can’t be coupled with LC gradients, restricting the total measurement peak capacity. Herein, we utilize multidimensional LC-IMS-MS measurements to effectively distinguish lipid isomers in standards, tissue extracts, and cell lines and to identify isomeric changes occurring under distinct biological conditions.
RESULTS
Separation of double bond locations and orientations in fatty acid isomers
To understand how the IMS structural separation aids in distinguishing lipid isomers, distinct double bond locations and orientations were studied in free fatty acid (FA) standards having 16, 18 and 22 carbons. FAs were chosen for the initial analyses since they are the simplest lipid components, yet exist in the structure of each lipid categories (Figure 1a) [24]. In all IMS-MS measurements, monounsaturated FAs were observed to be more compact (smaller) than saturated FAs, and FAs with cis-double bond orientations were smaller than those with trans-orientations. Gas phase structures of the 18 carbon FA isomers were modeled using AMBER14 [25] to understand their IMS structural data. The lowest energy family of each isomer clearly showed how the double bond kinks the backbone in monounsaturated FAs, generating more compact structures than the saturated FAs (Figure 1b). The cis- and trans-orientations for the monounsaturated FAs were also distinguishable as the cis-orientation double bonds curved the backbone more than those with trans-orientations. IMS also distinguished cis-double bonds at different positions on the FA backbone as those further from the carboxyl end curled the backbone more, causing smaller FA conformations. However, the trans-positional double bonds separated by 2 mid-chain carbons could not be distinguished since the small kink induced by the trans-double bond did not generate enough change in the FA size.
Isomer separation of sn-positions, cis/trans orientations, and R/S hydroxyl groups
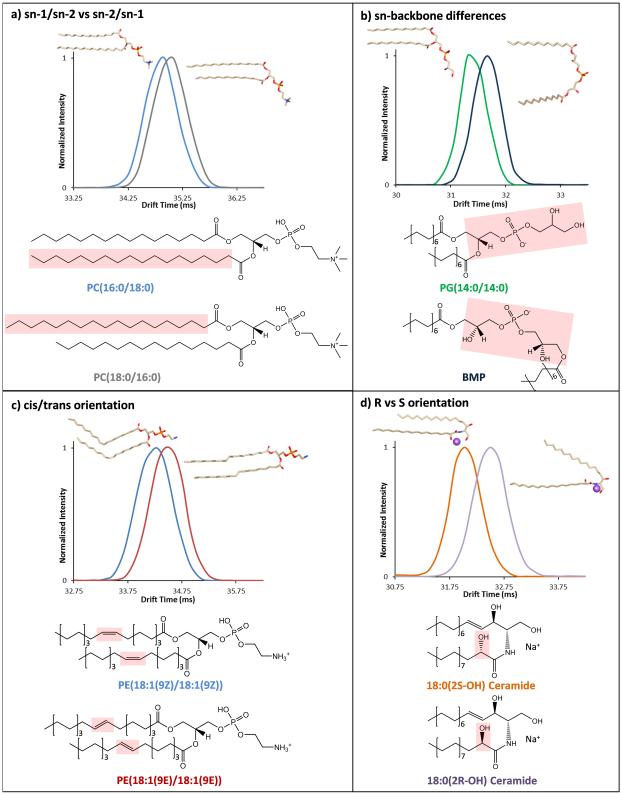
Since IMS-MS was able to distinguish FA isomers, more complex and biologically relevant lipid isomer standards were studied. A majority of lipid isomers occur when the acyl chains are at distinct locations along the lipid backbone (sn-1, sn-2, or sn-3), the double bonds have different positions and orientations (cis or trans), or functional groups along the backbone have unique orientations (R versus S). To further understand these lipid isomers with IMS-MS, pairs having sn-1/sn-2 versus sn-2/sn-1 acyl differences (Figures 2a); distinct sn-backbone structures (Figure 2b); cis- and trans-oriented double bonds (Figure 2c); and ceramides with R and S orientations of the 2-hydroxyl group (Figure 2d) were studied. The schematics in Figure 2 highlight the differences in each pair, and the 3D lowest energy structures generated with AMBER simulated annealing and molecular dynamics represent the predicted gas phase conformations.
Figure 2.
IMS separation of lipid isomers representing a) sn-1/sn-2 and sn-2/sn-1 acyl chain positions, b) sn-backbone differences, c) cis- and trans-double bond orientations and d) R and S orientations of the 2-hydroxyl group on ceramides. The chemical differences in each isomer pairs are highlighted with red boxes on the 2D schematics and 3D structures of each lipid species represent their lowest energy gas phase conformations. The sodium ion on the ceramides is shown as a purple ball.
Initially, lipids with transposed sn-1/sn-2 FA positions (i.e. PC(16:0/18:0) versus PC(18:0/16:0)) were analyzed since the acyl position in membrane lipids is known to influence the type of enzymes (e.g., phospholipase A2) that act upon the structure [26]. IMS-MS analyses of the different structural pairs illustrated that when the longer acyl chain is in the sn-1 position, the lipid is more elongated (larger) due to the additional carbon from the glycerol subunit on the sn-1 chain, i.e. PC(18:0/16:0) > PC(16:0/18:0) as shown in Figure 2a. This was consistent for all pairs studied when no double bonds were present PC(16:0/14:0) > PC(14:0/16:0) and PC(20:0/18:0) > PC(18:0/20:0). However, a double bond’s presence introduced a different trend as monounsaturated double bonds decreased the acyl chain size compared to the saturated version. For example, PC(16:0/18:1(9Z)) > PC(18:1(9Z)/16:0) since 18:1(9Z) is smaller in size than 16:0 due to the cis-oriented double bond kinking the backbone, which also agrees with the protonated work by [23]. Thus, if the FA in the sn-1 position is longer than the FA in the sn-2 position, the total IMS lipid size is greater. The total number of FA carbons can be used to determine the acyl chain size if there are no double bonds present or if both acyl chains have the same number and orientation of double bonds. Next, we studied the sn-positional isomers, diacylglycerophosphoglycerol (PG) and bis(monoacylglycero)phosphate (BMP), which are indistinguishable by LC-MS/MS (Figure 2b). Differentiating PGs and BMPs is essential since both are present in mammalian tissues but each has a different biological role and cellular location [27]. BMPs play an important role in endosomal pathways and differ from all animal phospholipids since they have two glycerol groups and an atypical sn-1-glycerophospho-sn-1′-glycerol (sn1:sn1′) backbone configuration. This backbone difference causes a wider spread in the acyl chains of BMPs and allows separation from the PGs in the IMS measurements (Figure 2b).
Following the sn-backbone analyses, cis- and trans-double bond orientations for complex lipids were studied since they influence the fluidity and thickness of lipid bilayers. It is known that a majority of mammalian lipids have mainly cis-double bond orientations for more fluidic and thinner lipid membranes [1]. IMS readily separated the cis- and trans-isomers since the acyl chains with cis-double bonds curled more, inducing smaller structures (Figure 2c). The final standards studied were the R and S orientations of the 2-hydroxyl group in ceramides (i.e. Cer(d18:1/18:0(2R-OH)) and Cer(d18:1/18:0(2S-OH))) which are thought to be formed from different hydroxylases and be important in membrane fluidity [28]. In the IMS-MS analyses, the R and S isomers did not separate in the negative mode, but in positive mode upon sodium ion binding, structural differences were observed. When the sodium binds to the hydroxyl groups of the S oriented ceramide, the 2-OH group points away from the long acyl chain allowing the acyl chains to be close and have a compact structure, whereas the R 2-OH group points toward the long acyl chain repelling the chains and creating a larger structure (Figure 2d).
LC-IMS-MS separates lipid classes and subclasses
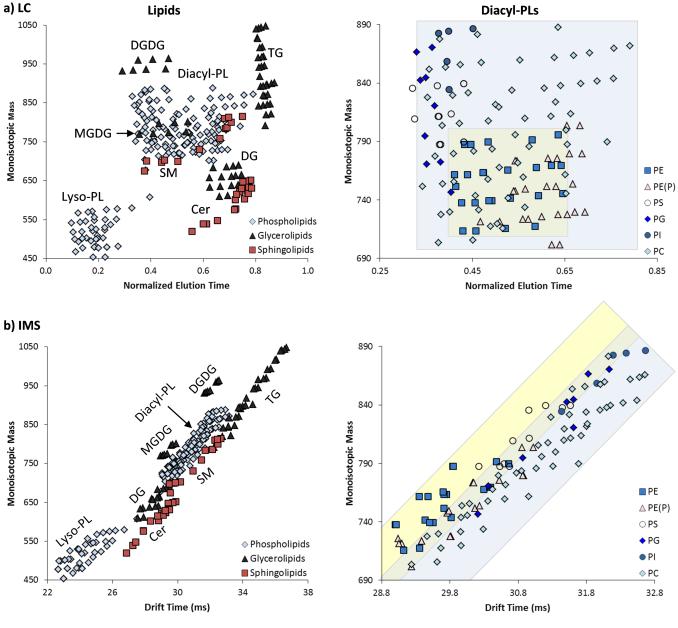
Interfacing reversed phase LC with IMS-MS measurements in lipidomic analyses is powerful for distinguishing isomers since it increases the overall peak capacity and allows separation in 3-dimensions: LC (polarity), IMS (structure and size) and MS (mass to charge ratio). To understand the orthogonality of LC and IMS lipid measurements, the monoisotopic masses of the lipid standards and lipids detected in mouse tissue extracts were plotted as a function of LC and IMS. Figure 3 shows that the three lipid categories, glycerophospholipids, glycerolipids and sphingolipids, clustered differently in the LC and IMS comparisons indicating the orthogonality and complementarity of the two techniques. In the reversed phase LC separation, a gradient of progressively more non-polar solvents was utilized so the lyso-phospholipids (lyso-PL or monoacylglycerolphospholipids) eluted early and triacylglycerides (TGs) eluted towards the end of the analysis (Figure 3a - left). Lipid class separation was observed in the LC analysis; however, subclass separation (Figure 3a – right), especially for the different diacylglycerophospholipids (diacyl-PLs), was challenging since many have similar acyl chains and masses leading to co-elution or incomplete separation of the LC chromatographic peaks. Tandem mass spectrometry assisted in distinguishing the co-eluting species through production of diagnostic fragment ions, but instances of two diagnostic ions in a single MS/MS scan were very common and precluded confident lipid identifications in some cases. In the IMS separation (Figure 3b - left), the lipid classes clustered with distinct trendlines for each lipid class. Subclass separation was also observed, and the diacyl-PLs, glycerophosphoethanolamine (PE) and glycerophosphocholine (PC), which are notoriously difficult to separate with LC, were baseline separated with IMS in some cases (shown in Figure 3b – right and the example in Figure 4).
Figure 3.
280 lipids identified from standards and mouse uterine tissue from three lipid categories (glycerophospholipids, glycerolipids and sphingolipids) were plotted as a function of monoisotopic mass versus a) LC and b) IMS (right). Both LC and IMS showed distinct clusters of the main lipid classes. 137 lipids from six subclasses within the diacyl-PL class were examined further (left). Most of the diacyl-PLs eluted at similar LC elution times, while IMS could distinguish several of the subclasses, especially the PEs (yellow box) and PCs (blue box) which overlap in the LC dimension. Each point has 1% drift error.
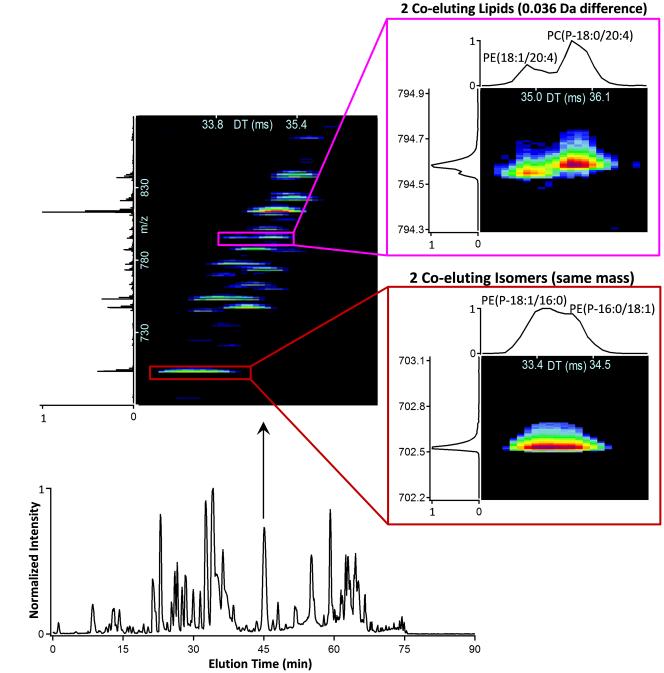
Figure 4.
LC-IMS-MS data for lipids in mouse uterine decidua tissue. A 1-sec IMS-MS nested spectrum is extracted from the LC peak at 45-min and shows the many lipid peaks observed for a 200 m/z range (top-left). Co-eluting lipid isomers and nominal mass isobars were observed in many of the spectra, examples of each are shown on the right.
Identification of lipid isomers in complex biological samples
After successful isomer separations were achieved with LC-IMS-MS in the standard analyses, its ability to distinguish isomers in complex biological samples was tested with pregnant mouse uterine tissue extracts (Figure 4). To separate as many lipid isomers as possible prior to the IMS separation and MS detection, a 90-min LC gradient optimized for high peak capacity separations was utilized. Over 180 lipids were identified in the tissue extract using both LC-MS/MS and LC-IMS-MS measurements. However, even with the long LC gradient, co-eluting structural isomers were still observed for ~20% of the lipids. Co-eluting nominal mass isobars, which could not be isolated in the MS/MS analyses were also observed and drift time separated as shown in Figure 4. IMS-MS/MS studies were then utilized to target each lipid separately and since the PE and PC head group fragments were separated, each identification had higher confidence.
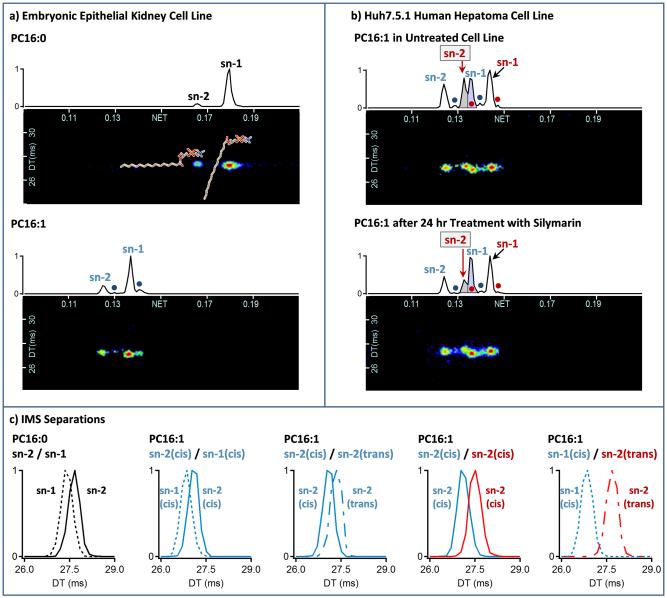
The significance of the lipid isomers observed in the LC-IMS-MS studies was initially examined by studying the lysophospholipids, lysoPC16:0 and lysoPC16:1. Both lysoPC16:0 and lysoPC16:1 are considered potential disease biomarkers [5, 29] and only have a single acyl chain allowing for simpler analyses. Extracted ion chromatograms (XICs) for lysoPC16:0 were compared for different human and mouse biological samples ranging from plasma to cell lines. In all samples studied, the XICs for lysoPC16:0 had two distinct LC peaks with virtually the same MS/MS profile (Figure 5a top). To assign the observed peaks, standards with different acyl chain positions were analyzed since lysoPC16:0 does not have any double bonds or other possible isomer arrangements. The later-eluting most abundant peak in the XIC correlated with a sn-1 acyl chain position, while the smaller peak corresponded had a sn-2 acyl chain position. This elution order has previously been noted for lyso-PLs in reversed phase LC-MS [5, 6]. The different sn-positions also had distinct IMS gas phase conformational sizes, since when the acyl chain was in the sn-2 position, the lipid was slightly larger than when it was in the sn-1 position (Figure 5c). This trend is especially important to note for future studies when shorter LC gradients are utilized that don’t separate the isomers. The LC chromatogram ratio of these two peaks was very similar for all the mammalian samples studied, with the sn-1 position normally representing at least 80-90% of the lysoPC16:0 isomers. However, differences were observed in the lysoPC16:0 isomer ratios in fungal and bacterial samples.
Figure 5.
XICs are shown for a) PC16:0 and PC16:1 in a human embryonic epithelial kidney cell line and b) PC16:1 in a Huh7.5.1 hepatoma cell line. c) IMS separations are also extracted from a) and b) for different 16:0 and 16:1 isomer pairs to better illustrate their differences. In most mammalian systems studied, PC16:0 has 2 peaks corresponding to the sn-1 and sn-2 attachment of the acyl chain, and PC16:1 has 4 peaks with the two main isomers occurring when the double bond is in the center of the lipid with a cis-orientation and the acyl chain is at either the sn-1 or sn-2 position (denoted as sn-1 and sn-2) as shown in a). The other two minor peaks represent the trans-orientation of each form (denoted with dots) and elute directly after their cis counterparts. The Huh7.5.1 human hepatoma cell lines behaved differently than most systems studied with 8 peaks observed for lysoPC16:1 as shown in b). The peaks labeled in blue are the same as those observed in the kidney cell line (from the bottom a) panel), but the peaks in red represent a new double bond position closer to the lipid head group. Upon treatment with silymarin, the boxed red sn-2 peak (highlighted in gray) dramatically decreases while most other peaks did not change. IMS was also able to resolve 2 of the isomers that co-eluted in the LC dimension (purple peak in b) panel) and their IMS separation is shown on the far right side of the c) panel).
The XICs for lysoPC16:1 revealed four different isomers in most of the human and mouse systems (Figure 5a bottom). Two dominant isomers occurred when the double bond was in the center of the lipid with a cis-orientation and the acyl chain was either in the sn-1 or sn-2 position (denoted as sn-1 and sn-2). The two smaller peaks (denoted with circles in the bottom panel of Figure 5a) were found to correlate with the trans-orientation of the double bond and eluted directly after their cis counterparts. Similar to lysoPC16:0, the cis/sn-1 position again had a higher occurrence than the others. While four isomers were predominant in most mammalian systems studied, a human hepatoma cell line (Huh7.5.1) [30] behaved differently with seven LC peaks detected for lysoPC16:1 (Figure 5b). Four of the peaks corresponded to the same double bond position observed in the other systems, but three new peaks represented a new double bond position with the same cis/trans-double bond orientations and sn-1/sn-2 acyl chain positions. The IMS dimension was also able to distinguish two isomers that now co-eluted in the LC peak shown in purple in Figure 5b, illustrating that four new isomers occurred in this sample. Since these four new isomers were all structurally larger in the IMS dimension than the previously identified four lipid isomers (Figure 5c), the double bond was thought to be closer to the lipid head group as seen from the FA positional analyses in Figure 1. Isomeric differences were also observed when the hepatoma cell line was treated with silymarin (Figure 5b bottom). Silymarin is an extract from milk thistle seeds, containing a mixture of flavonolignans such as silibinin, isosilibinin, silicristin, and silidianin, among others. It has antioxidant and anti-inflammatory properties and has been suggested to protect the liver from viruses and chronic inflammation damage [31]. Twenty-four hours after treatment with a non-toxic 80 µM dose of silymarin, the sn-2 peak for the new double bond position dropped dramatically, indicating that silymarin affected only one specific isomer (the peak is shown in gray in Figure 5b) with virtually no effect on the others. If all lysoPC16:1 isomer intensities were combined as in most LC-MS analyses, the decrease in the sn-2 isomer represents only a small reduction in the combined intensity (<2-fold change) and lysoPC16:1 is not deemed statistically significant upon silymarin treatment. Therefore, LC-IMS-MS is the first to illustrate silymarin may affect cells by interacting with specific lipids, and since lipids are important in hepatitis C virus entry and virus assembly, new understandings may be gained. Further, all three dimensions (LC, IMS and MS) were necessary for the isomer analyses since MS and MS/MS identified the lipids, LC separated most of the isomers, and IMS was able to distinguish the two LC co-eluting isomers, determine the gas phase conformation of each lipid, and identify the double bond position change (Figure 5b and 5c). While the LC dimension did distinguish most of the isomers in this case, it is difficult to understand what the isomers corresponded to without the IMS structural information since buying lipid standards with different double bond positions is very difficult and expense if they exist, and in this case most weren’t available for purchase.
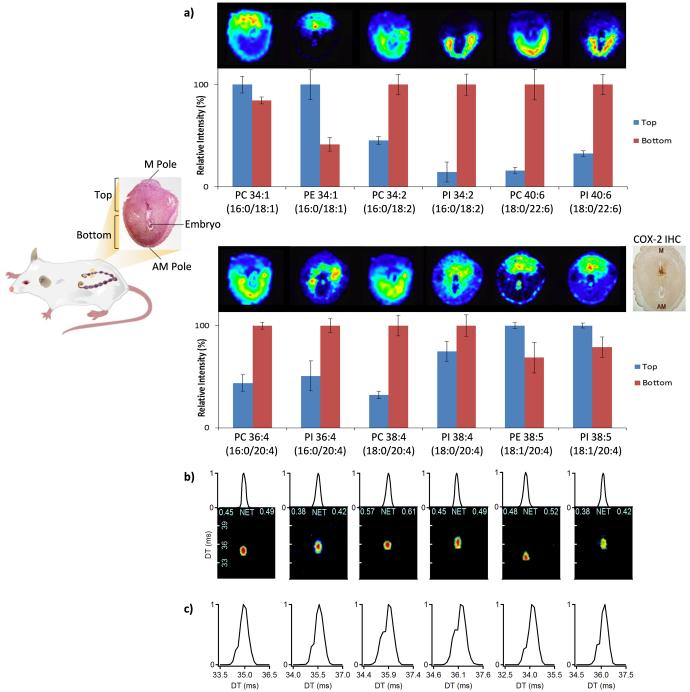
Since the lysophospholipids isomers illustrated such interesting changes, we examined more complex lipids in pregnant mouse uteri using both LC-IMS-MS and MALDI-FTICR imaging to locate and quantitate lipid distributions in early pregnancy. A previous imaging study showed that the spatial distribution of select phospholipids surrounding the developing embryo on day 8 of pregnancy markedly changed between distinct cellular areas (Figure 6a) [32]. Some of these changes correlated with the dynamic spatiotemporal expression profiles of cytosolic phospholipase A2α (cPLA2α) cyclooxygenases (Cox-2) and Cox-1 in the mouse uterus at specific stages of pregnancy [33-35]. Arachidonic acid (20:4) liberated from membrane phospholipids by cPLA2α is catalyzed by cyclooxygenases to generate prostaglandins. It is well established that prostacyclin and prostaglandin E2 derived by Cox-2 are essential for ovulation, fertilization, implantation, and decidualization [34, 36-39]. These studies highlight the interplay of lipids in uterine biology and embryo implantation. To compare the LC-IMS-MS platform with the MALDI-FTICR images, three implantation sites from two mice on day 8 of pregnancy were microdissected into mesometrial (M, top) and antimesometrial (AM, bottom) poles (Figure 6-left) and analyzed individually. In the MALDI-FTICR studies, ~30 lipids were identified with high confidence by utilizing the occurrence of multiple adducts. However, in the LC-IMS-MS and LC-MS/MS analyses, >300 lipids were identified, and thus more comprehensive lipidomic information was available for comparison.
Figure 6.
a) LC-IMS-MS data from implantation sites on day 8 of pregnancy correlate well with previously published MADLI-FTICR images [32]. (Left) Workflow for microdissection of top (M pole) and bottom (AM pole) of uteri. (Right) Images and corresponding LC-IMS-MS quantitative results for selected phospholipids between the top and bottom of day 8 implantation sites. b) XICs for lipids with a 20:4 acyl chain and the same MS/MS spectra showing co-elution in the LC dimension for all cases. c) IMS spectra for the lipids with 20:4, where the most intense peak corresponds to 20:4 in the sn-2 position and the shoulders illustrate its quantity in the sn-1 position. The MALDI images were originally published in the Journal of Lipid Research. Burnum, K. E.; Cornett, D. S.; Puolitaival, S. M.; Milne, S. B.; Myers, D. S.; Tranguch, S.; Brown, H. A.; Dey, S. K.; Caprioli, R. M. Spatial and temporal alterations of phospholipids determined by mass spectrometry during mouse embryo implantation. J Lipid Res. 2009; 50: 2290-8. © the American Society for Biochemistry and Molecular Biology.
To compare the MALDI-FTICR and LC-IMS-MS data, lipids changing between the M and AM poles were evaluated (Figure 6a). Similar to the MALDI-FTICR study, LC-IMS-MS analyses found that PC16:0/18:1, PE16:0/18:1, PE18:1/20:4 and PI18:1/20:4 predominately localized to the M pole, the presumptive site for placental development; conversely PC16:0/18:2, PI16:0/18:2, PC18:0/22:6, PI18:0/22:6, PC 16:0/20:4, and PC18:0/20:4 predominately localized to the decidual cells at the AM pole where the embryo first implants. We also analyzed whether arachidonic acid localized at the sn-1 or sn-2 position of each target lipid. MALDI-FTICR could not discriminate the sn-1/sn-2 arachidonic lipid isomers based on mass and they also co-eluted in the LC dimension (Figure 6b) [32], so no separation was possible with either technique. However, IMS was able to distinguish the isomers (Figure 6c) and illustrated that the 20:4 acyl chain preferred the sn-2 position, but also occurred in the sn-1 site 10-30% of the time. This fits the generally accepted principle that highly unsaturated acyl chains predominantly occupy the sn-2 position, but minor sn-1 subpopulations exist. Since complex lipids provide a cellular reservoir for specific FAs and the pathways metabolizing these into vital signaling molecules contain lipid-modifying enzymes with sn-1/sn-2 position and head group specificity [40, 41], the IMS-MS spectra will give insight into sn-1/sn-2 isomer distributions upon different biological conditions. Perturbed systems can also have a high degree of selective FA incorporation into complex lipids [42], which is important to understand. Thus, LC-IMS-MS analyses provide opportunities to study the biological significance and offer a window into the mechanistic roles of complex lipids in biological samples.
DISCUSSION
The present work illustrates that LC-IMS-MS enables more in-depth characterization of complex lipid samples and provides new insights into important biological changes, currently indiscernible with existing LC-MS technologies. Application of LC-IMS-MS to human cell lines and pregnant mouse uterine tissues provides evidence that specific isomeric populations exist in many different sample types and understanding their variations will help to explain enzymatic activity and mechanisms behind disease treatment and progression. While these initial results are very insightful, we also feel that this is just the beginning of the technology developments needed to understand the role of lipid isomers, especially since many of the lipid isomers observed in this manuscript were not baseline separated but generally occurred as shoulders due to their structural similarity. A drift time reference approach, which corrects slight differences in peak apex positions by alternating between the sample and an internal standard, would be very useful for obtaining accurate drift times from traditional IMS measurements and correcting run-to-run and inter-lab variability. We also expect that in the near future even faster and more sophisticated isomer separations will be possible from recent developments in structures for lossless ion manipulation (SLIM) technology [43]. SLIM technology enables the construction of serpentine extended path IMS drift regions, significantly boosting current capabilities by allowing lipid isomers with limited separation in current platforms to be baseline separated while also reducing the need for long LC gradient times. Thus, while the current LC-IMS-MS platform demonstrates a key foundational benchmark, we expect that anticipated advances will enable the ability to fully distinguishing all lipid isomers, providing a dramatically enhanced basis for understanding their roles in biological systems.
ONLINE METHODS
Methods and any associated references are available in the online version of the paper.
Supplementary Material
ACKNOWLEDGEMENTS
Portions of this research were supported by grants from the National Institute of Environmental Health Sciences of the NIH (R01ES022190), National Institute of General Medical Sciences (P41 GM103493), the Laboratory Directed Research and Development Program at Pacific Northwest National Laboratory. This research utilized capabilities developed by the Pan-omics program (funded by the U.S. Department of Energy Office of Biological and Environmental Research Genome Sciences Program) and by the National Institute of Allergy and Infectious Diseases under grant U19AI106772. The research was also supported in part by grants from the NIH (HD068524 and DA006668) and March of Dimes (21-FY12-127) (to S.K.D.) and 5R01AT006842 and 3R01AT006842-03S1 from NCCIH and the NIH Common Fund’s Metabolomics Program (to S.J.P.). This work was performed in the W. R. Wiley Environmental Molecular Sciences Laboratory (EMSL), a DOE national scientific user facility at the Pacific Northwest National Laboratory (PNNL). PNNL is operated by Battelle for the DOE under contract DE-AC05-76RL0 1830.
Footnotes
COMPETING FINANCIAL INTERESTS
The co-authors, Ibrahim and Smith, are co-inventors on one of the patents licensed by Agilent for the 6560 IMS-QTOF MS instrument and that instrument was utilized in this work.
AUTHOR CONTRIBUTIONS
J.E.K., X.Z., K.E.B-J., E.S.B. and S.K.D. designed the experiments, analyzed the data and wrote the manuscript. K.K.W., Y.M.I. and R.J.M. made technology developments to create and modify the LC, IMS and MS instrumentation required in the manuscript. M.E.M. developed software for data acquisition and analysis. J.E.K., E.S.L. and J.W. prepared the samples and X.S. and J.C. collected and prepared timed-pregnant mouse uterine samples at specific stage of development. S.J.P., T.O.M, R.D.S., K.E.B-J., and E.S.B. determined the samples needed for the experiments, supervised different aspects of the project and edited the manuscript.
Note: Supplementary information is also available online.
REFERENCES
- 1.Holthuis JC, Menon AK. Lipid landscapes and pipelines in membrane homeostasis. Nature. 2014;510(7503):48–57. doi: 10.1038/nature13474. [DOI] [PubMed] [Google Scholar]
- 2.van Meer G, Voelker DR, Feigenson GW. Membrane lipids: where they are and how they behave. Nat Rev Mol Cell Bio. 2008;9(2):112–24. doi: 10.1038/nrm2330. [DOI] [PMC free article] [PubMed] [Google Scholar]
- 3.Hullin-Matsuda F, Luquain-Costaz C, Bouvier J, Delton-Vandenbroucke I. Bis(monoacylglycero)phosphate, a peculiar phospholipid to control the fate of cholesterol: Implications in pathology. Prostaglandins, leukotrienes, and essential fatty acids. 2009;81(5-6):313–24. doi: 10.1016/j.plefa.2009.09.006. [DOI] [PubMed] [Google Scholar]
- 4.Cajka T, Fiehn O. Comprehensive analysis of lipids in biological systems by liquid chromatography-mass spectrometry. Trends in analytical chemistry : TRAC. 2014;61:192–206. doi: 10.1016/j.trac.2014.04.017. PMCID: 4187118. [DOI] [PMC free article] [PubMed] [Google Scholar]
- 5.Dong J, Cai XM, Zhao LL, Xue XY, Zou LJ, Zhang XL, et al. Lysophosphatidylcholine profiling of plasma: discrimination of isomers and discovery of lung cancer biomarkers. Metabolomics. 2010;6(4):478–88. [Google Scholar]
- 6.Lee JY, Min HK, Moon MH. Simultaneous profiling of lysophospholipids and phospholipids from human plasma by nanoflow liquid chromatography-tandem mass spectrometry. Analytical and bioanalytical chemistry. 2011;400(9):2953–61. doi: 10.1007/s00216-011-4958-7. [DOI] [PubMed] [Google Scholar]
- 7.Bird SS, Marur VR, Stavrovskaya IG, Kristal BS. Separation of cis-trans phospholipid isomers using reversed phase LC with high resolution MS detection. Anal Chem. 2012;84(13):5509–17. doi: 10.1021/ac300953j. PMCID: 3397781. [DOI] [PMC free article] [PubMed] [Google Scholar]
- 8.Grebe SK, Singh RJ. LC-MS/MS in the Clinical Laboratory - Where to From Here? The Clinical biochemist Reviews / Australian Association of Clinical Biochemists. 2011;32(1):5–31. PMCID: 3052391. [PMC free article] [PubMed] [Google Scholar]
- 9.Bollinger JG, Naika GS, Sadilek M, Gelb MH. LC/ESI-MS/MS detection of FAs by charge reversal derivatization with more than four orders of magnitude improvement in sensitivity. Journal of lipid research. 2013;54(12):3523–30. doi: 10.1194/jlr.D040782. PMCID: 3826698. [DOI] [PMC free article] [PubMed] [Google Scholar]
- 10.Yang K, Dilthey BG, Gross RW. Identification and quantitation of fatty acid double bond positional isomers: a shotgun lipidomics approach using charge-switch derivatization. Anal Chem. 2013;85(20):9742–50. doi: 10.1021/ac402104u. PMCID: 3837557. [DOI] [PMC free article] [PubMed] [Google Scholar]
- 11.Pham HT, Ly T, Trevitt AJ, Mitchell TW, Blanksby SJ. Differentiation of complex lipid isomers by radical-directed dissociation mass spectrometry. Anal Chem. 2012;84(17):7525–32. doi: 10.1021/ac301652a. [DOI] [PubMed] [Google Scholar]
- 12.Esch SW, Tamura P, Sparks AA, Roth MR, Devaiah SP, Heinz E, et al. Rapid characterization of the fatty acyl composition of complex lipids by collision-induced dissociation time-of-flight mass spectrometry. Journal of lipid research. 2007;48(1):235–41. doi: 10.1194/jlr.D600034-JLR200. [DOI] [PubMed] [Google Scholar]
- 13.Campbell JL, Baba T. Near-complete structural characterization of phosphatidylcholines using electron impact excitation of ions from organics. Anal Chem. 2015;87(11):5837–45. doi: 10.1021/acs.analchem.5b01460. [DOI] [PubMed] [Google Scholar]
- 14.Thomas MC, Mitchell TW, Harman DG, Deeley JM, Nealon JR, Blanksby SJ. Ozone-induced dissociation: elucidation of double bond position within mass-selected lipid ions. Anal Chem. 2008;80(1):303–11. doi: 10.1021/ac7017684. [DOI] [PubMed] [Google Scholar]
- 15.Poad BL, Pham HT, Thomas MC, Nealon JR, Campbell JL, Mitchell TW, et al. Ozone-induced dissociation on a modified tandem linear ion-trap: observations of different reactivity for isomeric lipids. J Am Soc Mass Spectrom. 2010;21(12):1989–99. doi: 10.1016/j.jasms.2010.08.011. [DOI] [PubMed] [Google Scholar]
- 16.Shvartsburg AA, Isaac G, Leveque N, Smith RD, Metz TO. Separation and classification of lipids using differential ion mobility spectrometry. J Am Soc Mass Spectrom. 2011;22(7):1146–55. doi: 10.1007/s13361-011-0114-z. PMCID: 3187568. [DOI] [PMC free article] [PubMed] [Google Scholar]
- 17.May JC, Goodwin CR, Lareau NM, Leaptrot KL, Morris CB, Kurulugama RT, et al. Conformational ordering of biomolecules in the gas phase: nitrogen collision cross sections measured on a prototype high resolution drift tube ion mobility-mass spectrometer. Anal Chem. 2014;86(4):2107–16. doi: 10.1021/ac4038448. PMCID: 3931330. [DOI] [PMC free article] [PubMed] [Google Scholar]
- 18.Baker PR, Armando AM, Campbell JL, Quehenberger O, Dennis EA. Three-dimensional enhanced lipidomics analysis combining UPLC, differential ion mobility spectrometry, and mass spectrometric separation strategies. Journal of lipid research. 2014;55(11):2432–42. doi: 10.1194/jlr.D051581. [DOI] [PMC free article] [PubMed] [Google Scholar]
- 19.Paglia G, Kliman M, Claude E, Geromanos S, Astarita G. Applications of ion-mobility mass spectrometry for lipid analysis. Analytical and bioanalytical chemistry. 2015 doi: 10.1007/s00216-015-8664-8. [DOI] [PubMed] [Google Scholar]
- 20.Damen CW, Isaac G, Langridge J, Hankemeier T, Vreeken RJ. Enhanced lipid isomer separation in human plasma using reversed-phase UPLC with ion-mobility/high-resolution MS detection. Journal of lipid research. 2014;55(8):1772–83. doi: 10.1194/jlr.D047795. PMCID: 4109771. [DOI] [PMC free article] [PubMed] [Google Scholar]
- 21.Paglia G, Kliman M, Claude E, Geromanos S, Astarita G. Applications of ion-mobility mass spectrometry for lipid analysis. Analytical and bioanalytical chemistry. 2015;407(17):4995–5007. doi: 10.1007/s00216-015-8664-8. [DOI] [PubMed] [Google Scholar]
- 22.Maccarone AT, Duldig J, Mitchell TW, Blanksby SJ, Duchoslav E, Campbell JL. Characterization of acyl chain position in unsaturated phosphatidylcholines using differential mobility-mass spectrometry. Journal of lipid research. 2014;55(8):1668–77. doi: 10.1194/jlr.M046995. PMCID: PMC4109761. [DOI] [PMC free article] [PubMed] [Google Scholar]
- 23.Groessl M, Graf S, Knochenmuss R. High resolution ion mobility-mass spectrometry for separation and identification of isomeric lipids. Analyst. 2015;140(20):6904–11. doi: 10.1039/c5an00838g. [DOI] [PubMed] [Google Scholar]
- 24.Quehenberger O, Armando AM, Brown AH, Milne SB, Myers DS, Merrill AH, et al. Lipidomics reveals a remarkable diversity of lipids in human plasma. Journal of lipid research. 2010;51(11):3299–305. doi: 10.1194/jlr.M009449. PMCID: 2952570. [DOI] [PMC free article] [PubMed] [Google Scholar]
- 25.Case DA, Berryman JT, Betz RM, Cerutti DS, Cheatham TE, Darden TA, et al. AMBER 2015. University of California; San Francisco: 2015. I. [Google Scholar]
- 26.Six DA, Dennis EA. The expanding superfamily of phospholipase A(2) enzymes: classification and characterization. Biochimica et biophysica acta. 2000;1488(1-2):1–19. doi: 10.1016/s1388-1981(00)00105-0. [DOI] [PubMed] [Google Scholar]
- 27.Hullin-Matsuda F, Taguchi T, Greimel P, Kobayashi T. Lipid compartmentalization in the endosome system. Semin Cell Dev Biol. 2014;31:48–56. doi: 10.1016/j.semcdb.2014.04.010. [DOI] [PubMed] [Google Scholar]
- 28.Guo L, Zhang X, Zhou D, Okunade AL, Su X. Stereospecificity of fatty acid 2-hydroxylase and differential functions of 2-hydroxy fatty acid enantiomers. Journal of lipid research. 2012;53(7):1327–35. doi: 10.1194/jlr.M025742. PMCID: 3371244. [DOI] [PMC free article] [PubMed] [Google Scholar]
- 29.Zhao YY, Lin RC. UPLC-MS(E) application in disease biomarker discovery: the discoveries in proteomics to metabolomics. Chem Biol Interact. 2014;215:7–16. doi: 10.1016/j.cbi.2014.02.014. [DOI] [PubMed] [Google Scholar]
- 30.Zhong J, Gastaminza P, Cheng G, Kapadia S, Kato T, Burton DR, et al. Robust hepatitis C virus infection in vitro. Proceedings of the National Academy of Sciences of the United States of America. 2005;102(26):9294–9. doi: 10.1073/pnas.0503596102. PMCID: 1166622. [DOI] [PMC free article] [PubMed] [Google Scholar]
- 31.Polyak SJ, Ferenci P, Pawlotsky JM. Hepatoprotective and antiviral functions of silymarin components in hepatitis C virus infection. Hepatology. 2013;57(3):1262–71. doi: 10.1002/hep.26179. PMCID: 3594650. [DOI] [PMC free article] [PubMed] [Google Scholar]
- 32.Burnum KE, Cornett DS, Puolitaival SM, Milne SB, Myers DS, Tranguch S, et al. Spatial and temporal alterations of phospholipids determined by mass spectrometry during mouse embryo implantation. Journal of lipid research. 2009;50(11):2290–8. doi: 10.1194/jlr.M900100-JLR200. PMCID: 2759835. [DOI] [PMC free article] [PubMed] [Google Scholar]
- 33.Song H, Lim H, Paria BC, Matsumoto H, Swift LL, Morrow J, et al. Cytosolic phospholipase A2alpha is crucial [correction of A2alpha deficiency is crucial] for 'on-time' embryo implantation that directs subsequent development. Development. 2002;129(12):2879–89. doi: 10.1242/dev.129.12.2879. [DOI] [PubMed] [Google Scholar]
- 34.Wang H, Ma WG, Tejada L, Zhang H, Morrow JD, Das SK, et al. Rescue of female infertility from the loss of cyclooxygenase-2 by compensatory up-regulation of cyclooxygenase-1 is a function of genetic makeup. The Journal of biological chemistry. 2004;279(11):10649–58. doi: 10.1074/jbc.M312203200. [DOI] [PubMed] [Google Scholar]
- 35.Chakraborty I, Das SK, Wang J, Dey SK. Developmental expression of the cyclo-oxygenase-1 and cyclo-oxygenase-2 genes in the peri-implantation mouse uterus and their differential regulation by the blastocyst and ovarian steroids. J Mol Endocrinol. 1996;16(2):107–22. doi: 10.1677/jme.0.0160107. [DOI] [PubMed] [Google Scholar]
- 36.Lim H, Paria BC, Das SK, Dinchuk JE, Langenbach R, Trzaskos JM, et al. Multiple female reproductive failures in cyclooxygenase 2-deficient mice. Cell. 1997;91(2):197–208. doi: 10.1016/s0092-8674(00)80402-x. [DOI] [PubMed] [Google Scholar]
- 37.Matsumoto H, Ma W, Smalley W, Trzaskos J, Breyer RM, Dey SK. Diversification of cyclooxygenase-2-derived prostaglandins in ovulation and implantation. Biology of reproduction. 2001;64(5):1557–65. doi: 10.1095/biolreprod64.5.1557. [DOI] [PubMed] [Google Scholar]
- 38.Davis BJ. Anovulation in Cyclooxygenase-2-Deficient Mice Is Restored by Prostaglandin E2 and Interleukin-1 Endocrinology. 1999;140(6):2685–95. doi: 10.1210/endo.140.6.6715. [DOI] [PubMed] [Google Scholar]
- 39.Segi E, Haraguchi K, Sugimoto Y, Tsuji M, Tsunekawa H, Tamba S, et al. Expression of messenger RNA for prostaglandin E receptor subtypes EP4/EP2 and cyclooxygenase isozymes in mouse periovulatory follicles and oviducts during superovulation. Biology of reproduction. 2003;68(3):804–11. doi: 10.1095/biolreprod.102.003590. [DOI] [PubMed] [Google Scholar]
- 40.Jackson SN, Wang HY, Woods AS. In situ structural characterization of phosphatidylcholines in brain tissue using MALDI-MS/MS. J Am Soc Mass Spectrom. 2005;16(12):2052–6. doi: 10.1016/j.jasms.2005.08.014. [DOI] [PubMed] [Google Scholar]
- 41.Voet D, Voet JG. Biochemistry. 3rd. John Wiley & Sons; Hoboken, NJ: 2004. [DOI] [PubMed] [Google Scholar]
- 42.Raphael W, Sordillo LM. Dietary polyunsaturated fatty acids and inflammation: the role of phospholipid biosynthesis. International journal of molecular sciences. 2013;14(10):21167–88. doi: 10.3390/ijms141021167. PMCID: 3821664. [DOI] [PMC free article] [PubMed] [Google Scholar]
- 43.Zhang X, Garimella SV, Prost SA, Webb IK, Chen TC, Tang K, et al. Ion Trapping, Storage, and Ejection in Structures for Lossless Ion Manipulations. Anal Chem. 2015;87(12):6010–6. doi: 10.1021/acs.analchem.5b00214. PMCID: PMC4523076. [DOI] [PMC free article] [PubMed] [Google Scholar]
Associated Data
This section collects any data citations, data availability statements, or supplementary materials included in this article.


