

Abstract
Background
Severe dengue with severe plasma leakage (SD-SPL) is the most frequent of dengue severe form. Plasma biomarkers for early predictive diagnosis of SD-SPL are required in the primary clinics for the prevention of dengue death.
Methodology
Among 63 confirmed dengue pediatric patients recruited, hospital based longitudinal study detected six SD-SPL and ten dengue with warning sign (DWS). To identify the specific proteins increased or decreased in the SD-SPL plasma obtained 6–48 hours before the shock compared with the DWS, the isobaric tags for relative and absolute quantification (iTRAQ) technology was performed using four patients each group. Validation was undertaken in 6 SD-SPL and 10 DWS patients.
Principal findings
Nineteen plasma proteins exhibited significantly different relative concentrations (p<0.05), with five over-expressed and fourteen under-expressed in SD-SPL compared with DWS. The individual protein was classified to either blood coagulation, vascular regulation, cellular transport-related processes or immune response. The immunoblot quantification showed angiotensinogen and antithrombin III significantly increased in SD-SPL whole plasma of early stage compared with DWS subjects. Even using this small number of samples, antithrombin III predicted SD-SPL before shock occurrence with accuracy.
Conclusion
Proteins identified here may serve as candidate predictive markers to diagnose SD-SPL for timely clinical management. Since the number of subjects are small, so further studies are needed to confirm all these biomarkers.
Author Summary
Death outcome of dengue infection were mainly involved in pediatric patients with severe plasma leakage, or shock. No biomarker was addressed in the early stage of disease course for timely clinical management. Nineteen differentially expressed proteins were significantly detected in severe dengue patients with severe plasma leakage prior to the time of circulatory collapse occurrence. Angiotensinogen and antithrombin III level were verified to be significantly increased in early stage plasma of shock patients.
Introduction
The last five decades saw a dramatic geographic expansion to 119 countries with overall 30 times more incidence of dengue infection, a mosquito-borne viral disease [1, 2]. The World Health Organization (WHO) estimates a mortality rate of dengue infection between 1 and 5%, with approximately 22,000 deaths, mainly among children with shock [2–4]. Most dengue infection are asymptomatic or self-limiting symptomatic while some patients, between days 4 and 7 of illness [5], may progress to severe disease, manifested with shock, serosal effusions and bleeding due to an increase of systematic vascular leak [1, 5]. The 2009 WHO guidelines, classifying dengue as dengue without warning sign (D), dengue with warning sign (DWS) and severe dengue [6], facilitate the clinical application and provide useful research endpoints [7]. SD contains any of severe plasma leakage leading to shock and/or respiratory distress (SD-SPL); severe bleeding, and severe organ impairment [1]. Prompt replacement of the circulating plasma losses can reduced the mortality rate to less than 1% among severe cases [1]. Early detection of the individuals who will develop shock among DWS patients is thus critical for timely clinical management. However, there is no objective biomarker in the early stage that reflects the probability of developing SD-SPL. Previously, albumin and transferrin levels were found to be significantly reduced in plasma at presentation day of shock compared with convalescent values, and urinary heparan sulfate and creatinine excretion was shown significantly greater in shock children compared with that in healthy control subjects [8]. In our recent study [9], circulating plasma DNA was found significantly higher in shock patients compared to non-shock on day 3 and 4 after the onset. In addition, serum hyaluronan level was also reported to be significantly higher in patients with shock from day 3 to day 7, compared to healthy subjects [10] while decreased plasma level of inter-α inhibitor proteins was shown to be correlated with shock at the time of hospitalization, but specific day of infection course during sampling was not notified [11]. However, these markers were investigated at the time of shock occurrence or a combination of times during the febrile phase and defervescence of the disease. It is, thus, difficult for clinicians to make an accurate prediction of SD-SPL before shock development.
“Warning signs” was mainly originated in the multicenter prospective study of more than 2000 dengue patients in seven countries in Asia and Latin American. However, not all DWS subjects progressed to severe dengue, just only 5% developed severe disease [12]. In an attempt to address helpful biomarkers for determining DWS patients at risk of SD-SPL, we conducted an observational study, using proteomic approach, from the hospital cohort called DENIM in Vietnam. Dengue patients were prospectively recruited and followed-up from febrile onset to defervescence as well as convalescent phase. The timing of early plasma sampling was carefully recorded and daily blood collection was carried out. In this study, we report for the first time the differential characterization of plasma proteome profiles and the identification of biomarkers for SD-SPL prediction among DWS children in the febrile phase, obtained from the DENIM cohort.
Methods
Ethics statement
The study was approved by Institutional Review Board of Institute of Tropical Medicine (NEKKEN), Nagasaki University (No.11063072) and the Pasteur Institute in Ho Chi Minh City (PIHCM) (No.602/QD-Pas 27/12/10). DENIM study is a longitudinal study of dengue fever, taking place in Nguyen Dinh Chieu Hospital in Ben Tre province, Vietnam. Children with age between 5 and 16 years hospitalized with clinically suspected dengue fever were eligible for enrollment. Written informed consent was given by a parent or guardian.
Study population and sample collection
As described details in the study protocol (S1 Fig), briefly, children presenting acute onset fever (≥38°C) for less than 72 hours were enrolled. No patients had severe symptoms before hospitalization because of concerns about the confounding of previous treatment. At study entry, demographic data, history, and examination findings were recorded, and venous blood were obtained for initial dengue diagnosis. After hospitalization, the patients were diagnosed using standardized diagnostic techniques, as described below. Venous blood samples were daily collected at the time of admission, one day, two days and three days after hospitalization, at the time of shock, in the convalescent phase prior to discharge and two weeks after discharge from the hospital. Plasma was separated by centrifugation at 3000 rpm for 10 min and then divided into two tubes: one used for dengue verification and the remaining one frozen at −80°C for storage.
Routine laboratory tests includes complete blood counts, liver and renal function tests, ionograms were performed at the hospital laboratory. Hematocrit was measured every 8 hours in the day 1 and 2 from onset fever and every 4–6 hours in the day 3-day 6 from onset fever. During the time of severe dengue occurrence, hematocrit was measured every 0.5–1 hour (as shown in S1 Fig). On the day of defervescent, a right lateral decubitus chest X-ray was obtained once and could be repeated thereafter if the patients had symptoms of dyspnea or signs of pleural effusion in clinical examination as dullness to percussion, decreased tactile fremitus and asymmetrical chest expansion, reduced or inaudible breath sounds, egophony, or a friction rub. Echography was performed once or twice, especially when patients had abdominal pain or abnormal physical findings as above.
Definitions
Dengue confirmed infection
Dengue infection was confirmed by positive serologic assays, virus isolation or RT-PCR for the identification of viral serotype, as described elsewhere [13]. Samples were considered serological positive for IgM and IgG if the ratio of optical density (OD) of test sera to OD of negative control was ≥2.3 [14]. IgM/IgG capture ELISA in paired acute and convalescent sera test were conducted to identify for primary and secondary dengue infection. The case was diagnosed as secondary infection if the DV IgM/IgG ratio was <1.8 [6]. Viral RNA was also extracted for the molecular detection of Dengue virus and conformation of its serotype [15]. The serotype was then determined by semi-nested PCR using specific primer sets to amplify serotype-specific fragments from the regions encoding the capsid and membrane proteins of Dengue virus [16].
Classification of severe dengue and dengue warning sign
Patients were classified according to 2009 WHO criteria [1], see details in Table 1. For all patients, the earliest plasma samples collected at 6–48 hours prior to the development of SD-SPL or defervescence were included in the study. The window of 6–48 hours is long enough to measure the biomarkers before the progress of SD-SPL for clinical practice.
Table 1. Dengue case classification.
An acute febrile patient with a confirmed diagnosis of dengue virus infection was considered as Dengue with warning sign (DWS) or SD-SPL modified from the criteria of 2009 WHO guidelines.
| Dengue with warning sign (DWS) | Severe dengue [6] |
|---|---|
| Abdominal pain | Severe plasma leakage leading to shock (weak and rapid pulse, narrow pulse pressure ≤20 mmHg, or hypotension for age with cold, clammy extremities) (SD-SPL) |
| Persistent vomiting | Severe bleeding |
| Clinical fluid accumulation | Severe organ impairment (acute liver failure: AST or ALT ≥1000 UI/L, impaired consciousness, cardiomyopathy and other organ) |
| Mucosal bleeding | |
| Lethargy or restlessness | |
| Liver enlargement >2 cm | |
| Increase in hematocrit (Hct) with rapid decrease in platelet count |
Isobaric tags for relative and absolute quantification (iTRAQ) labeling and mass spectrometry analyses
Individual iTRAQ labeling was suggested to observe the variation among eight subjects while highlighting the most consistent disease-specific changes (S2 Fig). For 8-plex analyses, four DWS and four SD-SPL samples, randomly selected from two groups was individually used. Following immune-depletion of high-abundance proteins using immobilized specific IgY 14 Spin columns kit (Seppro, Sigma Aldrich), each of depleted plasma was centrifugally concentrated and buffer exchanged. The concentration of plasma protein was determined using BCA assays (Pierce Thermo, US). Then, 100 μg of protein from each individual plasma in Tri-ethyl-ammonium-bicarbonate/0.1% SDS (AB Sciex, US) was reduced with 50 mM Tris-(2-carboxylethyl) phosphine (AB Sciex, US), alkylated with 200 mM methyl methane thio-sulfonate (AB Sciex, US), digested with trypsin CaCl2 (AB Sciex, US) at a ratio 1:5 (w/w trypsin: sample), and labeled with one of the isobaric reagents as described in the S1 Appendix. Each digested sample of four DWS subjects were labeled with iTRAQ reagent 113, 114, 115, 116, respectively and those of four SD-SPL individuals were allocated to the tags 117, 118, 119, and 121. The resulting labeled peptide samples were then pooled together, dried up and then, the mixtures were fractionated by strong cation exchange separation and analyzed by mass spectrometry as described in the S1 Appendix.
Data analysis
Spectra acquired from the iTRAQ experiment were submitted to the ProteinPilot Software (version 4.0, AB Sciex), using Paragon protein database search algorithm [17], for generation of peak list, protein identification and quantification. Protein ontology classification was performed using PANTHER classification system (http://pantherdb.org/, CA).
Western blotting
Angiotensinogen and antithrombin III were selected for validation in sixteen subjects individually (ten DWS and six SD-SPL). Western blotting was performed after SDS-PAGE with primary antibodies: anti-AGT (Angiotensinogen, Abcam) and anti-AT III (Antithrombin-III, GeneTex Inc). For specific details, see S1 Appendix.
Statistical analysis
All statistical analyses were performed using SPSS version 17.0 and MedCalc version 14.12. Statistical significance was determined by non-parametric Mann Whitney U-test for iTRAQ data comparison and validation data analysis. Experimental data of WB analysis were presented as median ± interquartile range. χ2 was used for categorical analysis, Fisher’s exact test was used when the expected counts were less than 5. A comparison of different methods for the selected feature was determined by the area under the curve (AUC) of receiver operating characteristics (ROC). An AUC value >0.75 was used as a threshold for good diagnostic test [18]. The DeLong test was performed to compare AUCs. A multivariate logistic regression model was used to observe the independent predictive value of the biomarker on disease outcome. The difference was considered significant at p<0.05.
Accession numbers
sp|P01019|ANGT_HUMAN, sp|Q9UFD9|RIM3A_HUMAN, sp|Q9Y4P8|WIPI2_HUMAN, sp|P01008|ANT3_HUMAN, sp|Q8WZ42|TITIN_HUMAN, sp|P00450|CERU_HUMAN, sp|P02765|FETUA_HUMAN, sp|P02787|TRFE_HUMAN, sp|Q68DK2|ZFY26_HUMAN, sp|P00734|THRB_HUMAN, sp|Q8WXH0|SYNE2_HUMAN, sp|O95255|MRP6_HUMAN, sp|Q9NUV7|SPTC3_HUMAN, sp|Q8TEM1|PO210_HUMAN, sp|Q8NGK0|O51G2_HUMAN, sp|Q7RTS5|OTOP3_HUMAN, sp|Q15582|BGH3_HUMAN, sp|Q8WWN8|ARAP3_HUMAN, sp|Q5THJ4|VP13D_HUMAN
Results
Characteristics of the study subjects
A flow chart of recruitment in the prospective DENIM study is presented in Fig 1. From January 2011 through June 2012, 113 children were enrolled and 63 had confirmed dengue infection. After classification, 44 patients with diagnosis of dengue fever with warning sign without shock presentation (DWS) and seven patients with diagnosis of severe dengue with severe plasma leakage (SD-SPL) underwent study selection. One of SD-SPL was excluded due to the shock occurrence at the time of hospitalization. All of six cases of SD-SPL had clinical shock presentation with narrow pulse pressure, quick pulse rates (as in S2 Table). No patients showed fluid accumulation without or with respiratory distress and no abnormality in echography and chest X-ray were recorded at the time of shock occurrence. One case had fluid overload with pleural effusion after intravenous fluid therapy and needed treatment of small doses of diuretic (S2 Table). In this study, for addressing factors that can provide the early prediction of shock development in preceding 6–48 hours, a sub-set of 16 of the pediatric dengue patients (ten DWS and six SD-SPL) with pre-defervescence or pre-shock plasma were included. Patients selected in DWS and SD-SPL groups showed similar age and gender distribution (Table 2). No significant differences of maximal hematocrit (Hct) and minimal platelet count during the first three day from fever onset were found between the two groups. Hct and platelet count obviously changed from day 4 or 5 of disease course in all subjects, only one case of SD-SPL had maximal Hct on day 3. There was no difference of maximal hematocrit during disease course between two groups and the median day of maximal Hct was day 4 from onset fever for both of two groups. Hematocrit features and fluid management of sixteen patients were shown in S1 Table. The percentage of Hct rising of individual subjects was also recorded (S1 Table). Dengue serologic titration indicated that secondary infection was most common in both DWS (70%) and SD-SPL groups (100%). No difference was recorded in timing of sampling between DWS and SD-SPL subjects. The median duration of sampling time was 28.5 hours prior to shock presentation for SD-SPL group and 28 hours before defervescence for DWS controls (Table 2).
Fig 1. Study profile.

Of 113 patients enrolled, 63 had laboratory-confirmed dengue infection. One patient hospitalized in shock presentation was excluded. Six SD-SPL and ten DWS, with early stage plasma collected, were included in the current study.
Table 2. Characteristics of dengue patients.
| DWS (n = 10) | SD-SPL (n = 6) | pa | |
|---|---|---|---|
| Demographic features | |||
| Age—median year, IQR | 9 (8–11.5) | 10 (8.5–12.7) | 0.4 |
| Gender (F:M) | 6:4 | 4:2 | 1 |
| Clinical symptoms and physical signs | |||
| Abdominal pain | 5 (50%) | 3 (50%) | |
| Persistent vomiting | 2 (20%) | 4 (67%) | |
| Mucosal bleeding | 2(20%) | 2 (33%) | 0.6 |
| 1 vaginal (D5) | 1 vagina (D4) | ||
| 1 GI, minor (D3) | 1 nasal (D6) | ||
| Liver enlargement > 2cm | 0 (0%) | 1 (17%) | |
| Narrow pulse pressure | 0 | 6 | |
| Shock manifestation | 0 | 6 | |
| Laboratory tests | |||
| Hct max until day 3 –% median, IQR | 43 (39.4–47.7) | 43.5 (37.7–47.7) | 0.9 |
| Platelet min until day 3 (× 103/μl)–median, IQR | 141.5 (74.7–197.3) | 113.5 (55.7–155) | 0.4 |
| Hct max during disease course–% median, IQR | 45.2 (40.2–47.7) | 47 (46.2–50.3) | 0.1 |
| Platelet min during disease course (× 103/μl)–median, IQR | 87.5 (60–127) | 41 (30.3–102.3) | 0.09 |
| Day of Hct max—median day, range | 4 (4–6) | 4 (3–6) | 1 |
| Day of platelet min—median day, range | 5 (4–7) | 4.5 (3–6) | 0.5 |
| PI/SI | 3/7 (30%/70%) | 0/6 (100%) | |
| Virus serotype—DENV 1/2/3/4 | 3/2/2/2 | 0/3/0/1 | |
| Day of sampling from onset fever—median day, IQR | 3 (3–3.3) | 3 (2.8–4.3) | 0.75 |
| Time of sampling prior to shock—median hour, IQR | 28.5 (10.5–40.3) | 0.7 | |
| Time of sampling prior to defervescence—median hour, IQR | 28 (20.8–44.3) |
Hct max, maximal hematocrit; PI/SI, primary/secondary infection; IQR, interquartile range; GI, gastrointestinal;
D, day from onset fever;
aFor categorical variables, χ2 test or Fisher’s exact test (F). For continuous variables, non-parametric Mann-Whitney U test
Plasma iTRAQ analysis for identification of candidate biomarkers of SD-SPL
For discovery of potential markers of SD-SPL, we used eight plasma samples in the early stage of dengue infection including four SD-SPL and four DWS samples as controls, randomly selected from two groups of sixteen subjects. The plasma level of high abundant proteins was determined by BCA assays before high-abundance protein depletion (as shown in S3 Fig). No significant difference of the concentration of plasma protein between two patient groups was observed. As shown in S3 Table, the relative ratios for remaining amounts of abundant proteins (including albumin, immunoglobulin, α1-antitrypsin, transferrin, haptoglobin, α2-macroglobulin, fibrinogen, α1-acid Glycoprotein (orosomucoid), apolipoproteins A-I) between two groups of patients showed no difference, except for transferrin.
Seventy proteins were identified and quantified with a confidence level of 95% from iTRAQ experiment (S3 Table). Fig 2 shows representative MS and peptide MS/MS spectrum of the corresponding amino acid sequences used in the identification and quantitation of angiotensinogen (AGT) and antithrombin III (AT-III) proteins in this study. Peaks of unique peptide sequence -ALQDQLVLVAAK- and -DPTFIPAPIQAK- corresponding to AGT protein, and -RVWELSK- and -ATEDEGSEQKIPEATNR-, corresponding to AT III proteins (Fig 2), revealed the increased signal intensities in the SD-SPL plasma. The relative intensities of iTRAQ reporter ions used to quantify the relative expression of these proteins were also shown in Fig 2.
Fig 2. Identification of angiotensinogen (AGT) and antithrombin III (AT III) proteins.

Representative precursor ion and MS/MS spectra of reporter ions from peptide ALQDQLVLVAAK and DPTFIPAPIQAK of AGT (A) and from peptide RVWELSK and ATEDEGSEQKIPEATNR of AT III (B). Quantification was derived from the signal intensities of eight iTRAQ reporter ions.
A statistical comparison revealed that 19 human proteins in both SD-SPL and DWS groups were significantly differentially expressed (p<0.05), with 5 over-expressed and 14 under-expressed relative to DWS patients (Table 3). The fold-change of each plasma protein level between DWS and SD-SPL patients was also determined (Table 3) with the maximal and minimum ratios, 1.2 and 2.4, respectively. The proteins were found to participate in various biological processes including blood coagulation, vascular regulation, cellular and transport-related processes and immune response with expected function of protease, protease inhibitor, transaminase, membrane traffic/transfer/carrier proteins, cell adhesion molecule and signaling molecule as shown in Table 4.
Table 3. List of differentially expressed plasma proteins of SD-SPL compared with those of DWS (p<0.05).
| Accession Noa | Description | p-value | Fold change (relative to DWS patients) |
|---|---|---|---|
| Over-expressed | |||
| sp|P01019|ANGT_HUMAN | Angiotensinogen | 0.0117 | 1.2 |
| sp|Q9UFD9|RIM3A_HUMAN | RIMS-binding protein 3A | 0.0426 | 1.8 |
| sp|Q9Y4P8|WIPI2_HUMAN | WD repeat domain Phosphoinositide-interacting protein 2 | < 0.0001 | 1.5 |
| sp|P01008|ANT3_HUMAN | Antithrombin III | 0.0031 | 1.4 |
| sp|Q8WZ42|TITIN_HUMAN | Titin | 0.0272 | 1.3 |
| Under-expressed | |||
| sp|P00450|CERU_HUMAN | Ceruloplasmin | 0.0332 | 1.2 |
| sp|P02765|FETUA_HUMAN | Alpha-2-HS-glycoprotein | 0.001 | 1.3 |
| sp|P02787|TRFE_HUMAN | Serotransferrin | 0.0083 | 1.3 |
| sp|Q68DK2|ZFY26_HUMAN | Zinc finger FYVE domain-containing protein 26 | 0.0248 | 1.6 |
| sp|P00734|THRB_HUMAN | Prothrombin | 0.0203 | 1.3 |
| sp|Q8WXH0|SYNE2_HUMAN | Nesprin-2 | 0.0184 | 1.3 |
| sp|O95255|MRP6_HUMAN | Multidrug resistance-associated protein 6 | 0.0021 | 1.2 |
| sp|Q9NUV7|SPTC3_HUMAN | Serine palmitoyltransferase 3 | 0.0078 | 2.3 |
| sp|Q8TEM1|PO210_HUMAN | Nuclear pore membrane glycoprotein 210 | 0.0135 | 2.4 |
| sp|Q8NGK0|O51G2_HUMAN | Olfactory receptor 51G2 | 0.001 | 1.5 |
| sp|Q7RTS5|OTOP3_HUMAN | Otopetrin-3 | 0.015 | 2.3 |
| sp|Q15582|BGH3_HUMAN | Transforming growth factor-beta-induced protein ig-h3 | 0.0024 | 2.2 |
| sp|Q8WWN8|ARAP3_HUMAN | Arf-GAP with Rho-GAP domain, ANK repeat and PH domain-containing protein 3 | 0.0248 | 1.4 |
| sp|Q5THJ4|VP13D_HUMAN | Vacuolar protein sorting-associated protein 13D | 0.0109 | 1.5 |
aSwissprot database (sp)
Table 4. Biological analysis of identified proteins using PANTHER classification.
| Name | Protein class & Biological process | Pathway |
|---|---|---|
| Angiotensinogen | Serine protease inhibitor | Vascular regulation |
| Rims-binding protein 3A | Cellular process | |
| WD repeat domain phosphoinositide-interacting protein 2 | Regulate autophagy | |
| Antithrombin III | Serine protease inhibitor | Blood coagulation |
| Titin | Cell adhesion molecule | |
| Ceruloplasmin | Extracellular matrix | Membrane-bound signaling molecule |
| Alpha-2-hs-glycoprotein | Cysteine protease inhibitor | |
| Serotransferrin | Transfer/carrier protein | |
| Zinc finger FYVE domain-containing protein 26 | Intracellular protein transport, Membrane traffic protein | |
| Prothrombin | Serine protease | Blood coagulation |
| Nesprin-2 | Non-motor actin binding protein | |
| Multidrug resistance-associated protein 6 | ATP-binding cassette (abc) transporter | |
| Serine palmitoyltransferase 3 | Transaminase | |
| Nuclear pore membrane glycoprotein 210 | Membrane traffic protein | |
| Olfactory receptor 51g2 | G protein-coupled receptor | |
| Otopetrin-3 | Membrane traffic protein | |
| TGF beta-induced protein ig-h3 | Signaling molecule; cell adhesion molecule | |
| Arf-gap with Rho-gap domain, ANK repeat and PH domain-containing protein 3 | Nucleic acid binding; g-protein modulator | |
| Vacuolar protein sorting-associated protein 13d | Involved in trafficking of membrane proteins | |
Proteins were categorized to one or more profiles of both protein class, biological processes and pathway based on gene ontology.
Validation of candidate markers in individual plasma samples
Based on the functional properties of these AGT and AT III (Table 3) we selected those for further study. Verification of those two proteins detected by iTRAQ method was performed by Western blotting in 16 individual plasma samples (10 DWS and 6 SD-SPL). Relative quantitation of AGT (Fig 3A and 3B) and AT III (Fig 3C and 3D) blots indicated that the levels of these proteins were significantly higher in early stage plasma of SD-SPL patients (n = 6) compared to those of the control group (n = 10) (p = 0.031 for AGT and p = 0.017 for AT III).
Fig 3. Western-blot analysis validating iTRAQs results for angiotensinogen and antithrombin III.

Representative protein bands in DWS (n = 10) and SD-SPL (n = 6) for AGT (A) and for AT III (C). Quantification of relative protein expression of AGT (B) and AT III (D), based on normalized densitometry to healthy control, *p < 0.05.
Assessment of probability to predict SD-SPL of candidate markers
The univariate logistic regression analysis revealed that level of the relative expression of AT III as well as AGT in plasma significantly correlated with the risk of SD-SPL (odds ratio (OR) 5.93, 95% confidence interval (CI) 1.23–28.68, p = 0.02; and OR 20.00, 95% CI 1.42–284.45, p = 0.03, respectively). ROC curve analysis indicated that SD-SPL prediction by AT III candidate performed more accurately with area under the curve (AUC) of 0.85±0.11 (p = 0.0009) compared to AGT marker (AUC = 0.83±0.10, p = 0.0013) although no statistically significant difference between the two curves was observed (Fig 4). Combination of AGT and AT III achieved an AUC of 0.87±0.10 (p = 0.0004), however, there was no significant difference between this curve and AGT and AT III curves on their own (Fig 4). AT III has the potential to be a more precise marker for shock anticipation. Thus, the relative plasma level of AT III together with other variables (age, maximal hematocrit and minimal platelet count) recorded during the first three day from the onset fever were included in multivariate logistic regression analysis. The analysis demonstrated that the relative concentration of AT III in plasma was independently (p = 0.03) associated with a greater risk of SD-SPL (Table 5).
Fig 4. Receiver operating characteristic (ROC) curves comparing antithrombin III and angiotensinogen markers for SD-SPL prediction.
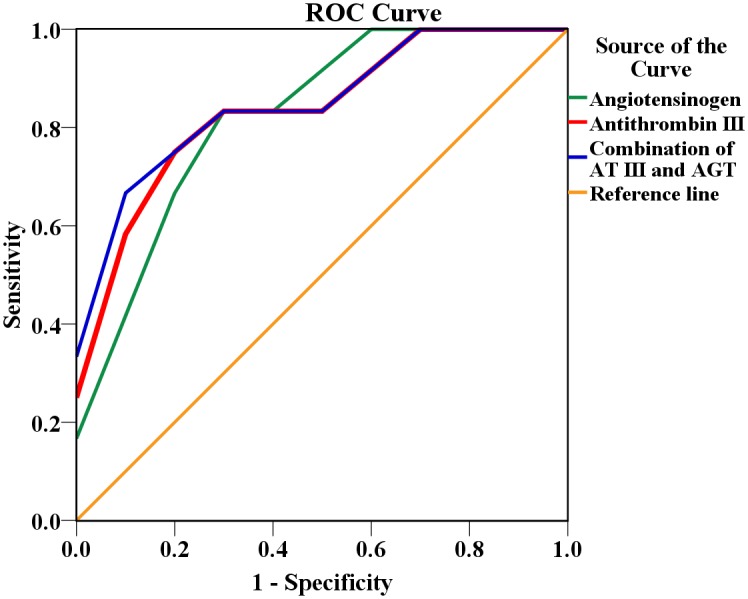
Area under the curve (AUC) for antithrombin III = 0.85, AUC for angiotensinogen = 0.83 and AUC for combination of two markers = 0.87.
Table 5. Multivariate logistic regression analysis of SD-SPL predictive diagnosis.
| Factors | Univariate | Multivariate | ||||
|---|---|---|---|---|---|---|
| OR | 95% CI | p | OR | 95% CI | p | |
| Age | 1.2 | (0.78–1.83) | 0.4 | 1.42 | (0.53–3.78) | 0.48 |
| Hct max until day 3 (%)* | 1.03 | (0.85–1.25) | 0.8 | 0.95 | (0.62–1.48) | 0.83 |
| Platelet min until day 3 (× 103/μl)* | 0.99 | (0.97–1.01) | 0.3 | 0.98 | (0.95–1.02) | 0.28 |
| Antithrombin III | 5.93 | (1.23–28.68) | 0.02 | 6.52 | (1.06–40.11) | 0.03 |
| Angiotensinogen | 20.00 | (1.42–282.45) | 0.03 | |||
OR, Odds ratio;
CI, Confidence interval
*odds ratio represents the incremental odds of SD-SPL prediction for every unit increase of one percent in Hct max or 1000 platelet per microliter in Platelet min
Discussion
The severe dengue with severe plasma leakage (SD-SPL) is known as the most common of serious manifestation of severe dengue. Using iTRAQ and mass-spectrometry analysis, we have identified five proteins over-expressed and 14 proteins under-expressed in the early stage plasma of SD-SPL patients compared to that of dengue with warning signs (DWS) as shown in Table 3. Moreover, functionally selected two proteins from those, AGT and ATIII were confirmed by Western blotting analysis using more number of cases (Fig 3).
While there was not much difference in the fold-change between iTRAQ experiment and Western blotting analysis of AGT, AT-III had higher change in immunoblot analysis than iTRAQ approach. These differences could be attributed to the use of depleted or whole plasma, the small sample size, or inherent differences in experimental techniques. Although iTRAQs approach was demonstrated as a robust and reproducible mean for simultaneous identification and quantitation of all peptides, and its advantage over other labelings (i.e., ICAT, SILAC, DIGE, mTRAQ) have been reported previously [19, 20], underestimation of the change in iTRAQ analysis between samples has been recently proposed to depend on the MS-platform (QTOF, TOF, QTRAP) [21, 22]. In concordance with our result, orthogonal analysis, known as biochemical assays such as antibody-based Western blots or enzyme-linked immunoassays, have previously shown a fold-change that is higher than the corresponding ratios derived from iTRAQ approach [22].
Angiotensinogen (AGT) detected increased here has never been reported as a predictive marker of shock in Dengue infection before. It is known as the renin substrate, a precursor molecule of angiotensin I & II, and plays an important role in the renin-angiotensin system [23]. Changes in mRNA expression levels of endothelial-like cells following infection with dengue virus type 2 showed the up regulation of angiotensinogen [24] and the high plasma levels of angiotensin II impair endothelial cell (EC) function [25], inhibit EC motility [26] and induce apoptosis of human ECs [27–29].
Although both of AGT and AT III showed correlation with SD-SPL predictive diagnosis, AT III candidate was the more precisely performing marker at discriminating circulatory collapse from DWS patients (AUC 0.85). Through multivariate analysis, our study demonstrated that for prediction of SD-SPL in early time of disease course, AT III was independent of other features as hematocrit and platelet count, which have been usually used to monitor clinical progress. In the current study, they reveal obvious changes from day 4 of disease or around the time of shock occurrence, concordant with previous paper [5]. Besides, elevation of AT III accompanied with the low level of prothrombin in pre-shock plasma of SD-SPL patients may indicate the reduction of thrombin formation and that the clotting time for plasma is prolonged. That was consistent with the higher tendency of mucosal bleeding in SD-SPL group (20% of DWS versus 33.3% of SD-SPL) during disease course. Among our patients with a hemorrhagic tendency, mucosal hemorrhage was mostly observed from day 4 of the disease with minor bleeding. However, children who will subsequently develop SD-SPL did have significantly abnormal levels of circulating level of AT III and prothrombin during the first few days.
AT III has previously been found to have lower levels in the plasma of SD-SPL patients resuscitated from shock with colloid fluids compared with SD-SPL patients treated with electrolyte fluids [30]. Un-estimated dilution effect due to intravenously fluid perfusion before the sampling time may potentially explain the decrease of this coagulation inhibitor and the accuracy of that estimation is difficult to assess. In our study, plasma was collected before the patients had received fluids so the level of AT III in plasma of SD-SPL patients should reflect disease pathogenesis. Interestingly, AT III has also been shown to prevent the shedding of the endothelial glycocalyx which can causes a substantial increase in vascular permeability [31] and platelet adhesion [32]. In the pre-shock period the increase of AT III may be a natural human response to minimize the relative damage of glycocalyx layer.
We have identified markers that could have a role in predicting severe dengue with severe plasma leakage among dengue patients with warning signs. Such biomarkers may help the institution of timely management and help guide dengue treatment. The study is limited by the small number of patients studied and this may a principle to apply the technique in further study with lager population for exploring the threshold of these markers in predictive diagnosis of severe dengue.
Supporting Information
(DOCX)
(TIF)
(TIF)
Bar chart represents the median of protein concentration with the upper error bars indicate the 75th percentile of inter-quartile range.
(TIF)
(DOCX)
(DOCX)
(DOCX)
Acknowledgments
We would like to thank Prof. Chris Parry of Graduate School of Tropical Medicine and Global Health, Nagasaki University and of London School of Hygiene and Tropical medicine, University of London for his thorough critical reading and suggestions. We also appreciate Dr. Kentaro Kato from the Department of Parasitology, Institute of Tropical Medicine (NEKKEN), Nagasaki University for his kind technical support.
Data Availability
All relevant data are within the paper and its Supporting Information files.
Funding Statement
This study was supported in part by the Japan Initiative for Global Research Network on Infectious Diseases (J-GRID). The funder had no role in study design, data collection and analysis, decision to publish, or preparation of the manuscript.
References
- 1.WHO. Dengue: Guidelines for Diagnosis, Treatment, Prevention and Control: New Edition. 2009. [PubMed]
- 2.Global-Alert-and-Response. Impact of dengue.http://www.who.int/csr/disease/dengue/impact/en/.
- 3.WHO. Dengue and severe dengue. Fact sheet (No 117) 2014:http://www.who.int/mediacentre/factsheets/fs117/en/.
- 4.Wills BA, Dung NM, Loan HT et al. Comparison of three fluid solutions for resuscitation in dengue shock syndrome. N Engl J Med 2005; 353:877–889. [DOI] [PubMed] [Google Scholar]
- 5.Simmons CP, Farrar JJ, van Vinh Chau N and Wills B. Dengue. N Engl J Med 2012; 366:1423–1432. 10.1056/NEJMra1110265 [DOI] [PubMed] [Google Scholar]
- 6.Innis B, Nisalak A, Nimmannitya S et al. An enzyme-linked immunosorbent assay to characterize dengue infections where dengue and Japanese encephalitis co-circulate. Am J Trop Med Hyg 1989; 40:418–427. [DOI] [PubMed] [Google Scholar]
- 7.Horstick O, Jaenisch T, Martinez E et al. Comparing the usefulness of the 1997 and 2009 WHO dengue case classification: a systematic literature review. Am J Trop Med Hyg 2014:13–0676. [DOI] [PMC free article] [PubMed] [Google Scholar]
- 8.Wills BA, Oragui EE, Dung NM et al. Size and charge characteristics of the protein leak in dengue shock syndrome. J Infect Dis 2004; 190:810–818. [DOI] [PubMed] [Google Scholar]
- 9.Ha TTN, Huy NT, Murao LA et al. Elevated levels of cell-free circulating DNA in patients with acute dengue virus infection. PLoS One 2011; 6:e25969 10.1371/journal.pone.0025969 [DOI] [PMC free article] [PubMed] [Google Scholar]
- 10.Honsawek S, Kongtawelert P, Pothacharoen P, Khongphatthanayothin A, Chongsrisawat V and Poovorawan Y. Increased levels of serum hyaluronan in patients with dengue infection. J Infect 2007; 54:225–229. [DOI] [PubMed] [Google Scholar]
- 11.Koraka P, Lim Y-P, Shin MD et al. Plasma levels of inter-α inhibitor proteins in children with acute dengue virus infection. PLoS One 2010; 5:e9967 10.1371/journal.pone.0009967 [DOI] [PMC free article] [PubMed] [Google Scholar]
- 12.Alexander N, Balmaseda A, Coelho IC et al. Multicentre prospective study on dengue classification in four South‐east Asian and three Latin American countries. Trop Med Int Health 2011; 16:936–948. 10.1111/j.1365-3156.2011.02793.x [DOI] [PubMed] [Google Scholar]
- 13.Lan NTP, Kikuchi M, Huong VTQ et al. Protective and enhancing HLA alleles, HLA-DRB1* 0901 and HLA-A* 24, for severe forms of dengue virus infection, dengue hemorrhagic fever and dengue shock syndrome. PLoS Negl Trop Dis 2008; 2:e304 10.1371/journal.pntd.0000304 [DOI] [PMC free article] [PubMed] [Google Scholar]
- 14.Furuta T, Murao LA, Lan N et al. Association of mast cell-derived VEGF and proteases in Dengue shock syndrome. PLoS Negl Trop Dis 2012; 6:e1505–e1505. 10.1371/journal.pntd.0001505 [DOI] [PMC free article] [PubMed] [Google Scholar]
- 15.Gubler D, Kuno G, Sather G, Velez M and Oliver A. Mosquito cell cultures and specific monoclonal antibodies in surveillance for dengue viruses. Am J Trop Med Hyg 1984; 33:158–165. [DOI] [PubMed] [Google Scholar]
- 16.Lanciotti RS, Calisher CH, Gubler DJ, Chang G-J and Vorndam AV. Rapid detection and typing of dengue viruses from clinical samples by using reverse transcriptase-polymerase chain reaction. J Clin Microbiol 1992; 30:545–551. [DOI] [PMC free article] [PubMed] [Google Scholar]
- 17.Tanzi GO, Piefer AJ and Bates P. Equine infectious anemia virus utilizes host vesicular protein sorting machinery during particle release. J Virol 2003; 77:8440–8447. [DOI] [PMC free article] [PubMed] [Google Scholar]
- 18.Jones CM and Athanasiou T. Summary receiver operating characteristic curve analysis techniques in the evaluation of diagnostic tests. Ann Thorac Surg 2005; 79:16–20. [DOI] [PubMed] [Google Scholar]
- 19.Garbis SD, Tyritzis SI, Roumeliotis T et al. Search for potential markers for prostate cancer diagnosis, prognosis and treatment in clinical tissue specimens using amine-specific isobaric tagging (iTRAQ) with two-dimensional liquid chromatography and tandem mass spectrometry. J Proteome Res 2008; 7:3146–3158. 10.1021/pr800060r [DOI] [PubMed] [Google Scholar]
- 20.Mertins P, Udeshi ND, Clauser KR et al. iTRAQ labeling is superior to mTRAQ for quantitative global proteomics and phosphoproteomics. Mol Cell Proteomics 2012; 11:M111. 014423. [DOI] [PMC free article] [PubMed] [Google Scholar]
- 21.Karp NA, Huber W, Sadowski PG, Charles PD, Hester SV and Lilley KS. Addressing accuracy and precision issues in iTRAQ quantitation. Mol Cell Proteomics 2010; 9:1885–1897. 10.1074/mcp.M900628-MCP200 [DOI] [PMC free article] [PubMed] [Google Scholar]
- 22.Evans C, Noirel J, Ow SY et al. An insight into iTRAQ: where do we stand now? Anal Bioanal Chem 2012; 404:1011–1027. 10.1007/s00216-012-5918-6 [DOI] [PubMed] [Google Scholar]
- 23.Michel FS, Norton GR, Maseko MJ, Majane OH, Sareli P and Woodiwiss AJ. Urinary Angiotensinogen Excretion Is Associated With Blood Pressure Independent of the Circulating Renin–Angiotensin System in a Group of African Ancestry. Hypertension 2014; 64:149–56. 10.1161/HYPERTENSIONAHA.114.03336 [DOI] [PubMed] [Google Scholar]
- 24.Liew KJ and Chow VT. Microarray and real-time RT-PCR analyses of a novel set of differentially expressed human genes in ECV304 endothelial-like cells infected with dengue virus type 2. J Virol Methods 2006; 131:47–57. [DOI] [PubMed] [Google Scholar]
- 25.Loot AE, Schreiber JG, Fisslthaler B and Fleming I. Angiotensin II impairs endothelial function via tyrosine phosphorylation of the endothelial nitric oxide synthase. J Exp Med 2009; 206:2889–2896. 10.1084/jem.20090449 [DOI] [PMC free article] [PubMed] [Google Scholar]
- 26.Desideri G, Bravi MC, Tucci M et al. Angiotensin II inhibits endothelial cell motility through an AT1-dependent oxidant-sensitive decrement of nitric oxide availability. Arterioscler Thromb Vasc Biol 2003; 23:1218–1223. [DOI] [PubMed] [Google Scholar]
- 27.Dimmeler S, Rippmann V, Weiland U, Haendeler J and Zeiher AM. Angiotensin II induces apoptosis of human endothelial cells Protective effect of nitric oxide. Circ Res 1997; 81:970–976. [DOI] [PubMed] [Google Scholar]
- 28.Lin L-Y, Lin C-Y, Su T-C and Liau C-S. Angiotensin II-induced apoptosis in human endothelial cells is inhibited by adiponectin through restoration of the association between endothelial nitric oxide synthase and heat shock protein 90. FEBS Lett 2004; 574:106–110. [DOI] [PubMed] [Google Scholar]
- 29.Chen J, Chen W, Zhu M, Zhu Y, Yin H and Tan Z. Propofol attenuates angiotensin II-induced apoptosis in human coronary artery endothelial cells. Br J Anaesth 2011; 107:525–532. 10.1093/bja/aer197 [DOI] [PubMed] [Google Scholar]
- 30.Wills BA, Oragui EE, Stephens AC et al. Coagulation abnormalities in dengue hemorrhagic fever: serial investigations in 167 Vietnamese children with dengue shock syndrome. Clin Infect Dis 2002; 35:277–285. [DOI] [PubMed] [Google Scholar]
- 31.Chappell D, Jacob M, Hofmann-Kiefer K et al. Antithrombin reduces shedding of the endothelial glycocalyx following ischaemia/reperfusion. Cardiovasc Res 2009; 83:388–96. 10.1093/cvr/cvp097 [DOI] [PubMed] [Google Scholar]
- 32.Chappell D, Brettner F, Doerfler N et al. Protection of glycocalyx decreases platelet adhesion after ischaemia/reperfusion: An animal study. Eur J Anaesthesiol 2014; 31:474–81. 10.1097/EJA.0000000000000085 [DOI] [PubMed] [Google Scholar]
Associated Data
This section collects any data citations, data availability statements, or supplementary materials included in this article.
Supplementary Materials
(DOCX)
(TIF)
(TIF)
Bar chart represents the median of protein concentration with the upper error bars indicate the 75th percentile of inter-quartile range.
(TIF)
(DOCX)
(DOCX)
(DOCX)
Data Availability Statement
All relevant data are within the paper and its Supporting Information files.