
Figure 10. The binding of DkTx to the outer pore of TRPV1 effectively ablates temperature-dependent gating over a wide range of temperatures.
Po-T relation (mean ± SEM, n = 9) for WT TRPV1 obtained in the presence of external Na+ and DkTx. The dotted line denotes the mean Po at 22°C and +90 mV as estimated from the I-V relations in DkTx relative to saturating capsaicin shown in Figure 3C. The insert to the upper right represents experimental Po-T relations on a log scale measured in the presence of external Na+ and saturating capsaicin (dashed black line denoting the absence of temperature-dependent gating), external Na+ and DkTx (dashed blue line, no temperature-dependent gating) and external Na+ alone (two temperature-dependent transitions). See Figure 10—figure supplement 1B for Po-T relations from individual cells.
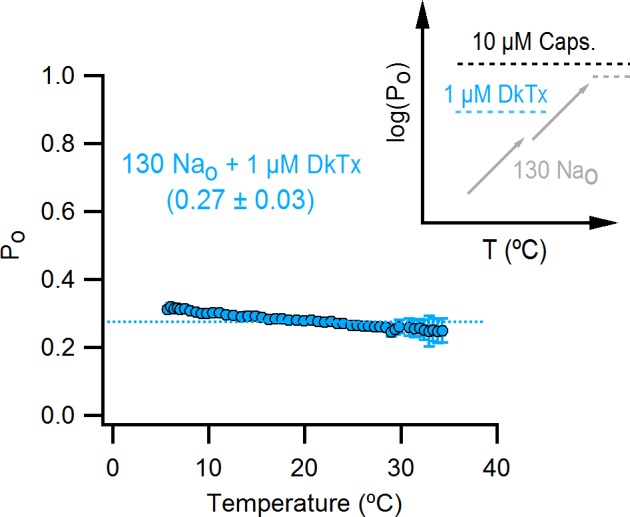
Figure 10—figure supplement 1. DkTx binding to TRPV1.

(A) Overlay of the side views of the S3-S6 segments of one TRPV1 subunit and the S5-S6 segments of an adjacent subunit in the apo (subunit 1, S3-S4 in light pink, S5-S6 in magenta; subunit 2, S5-S6 in light grey) and the DkTx/RTx bound state (subunit 1, S3-S4 in light blue, S5-S6 in teal; subunit 2, S5-S6 in light orange). The structures shown are the refined structural models of TRPV1 from (Bae et al., 2016), with the docked solution structure of DkTx (K1 in green and K2 in cyan). E600 is shown in stick representation and colored in dark blue, and the red highlight denotes the location from which the pore turret was deleted in the structure used for structure determination (Cao et al., 2013; Liao et al., 2013). (B) Mean Po-T relation (mean ± SEM, n = 9, data from Figure 10,) for WT TRPV1 obtained in the presence of external Na+ and DkTx. The Po-T relations for individual cells are shown as colored continuous curves.