. 2015 Dec 17;4:e11214. doi: 10.7554/eLife.11214

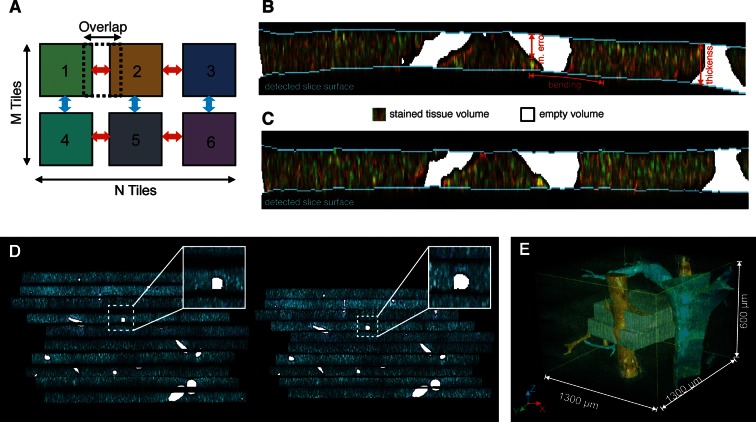
Figure 2. Reconstruction of a multi-scale lobule image.

(A) Schematic representing a single serial section obtained from a grid of M × N partially overlapping 3D images (tiles). The cross-correlation between two neighbouring tiles in the grid provides a local metric, which describes the value of their relative shifts. The reconstruction of each section was performed by maximizing the sum correlations of each tile to all adjacent tiles (see ‘Methods’ for details). (B, C) Correction of tissue deformations (introduced during the sample preparation process) using a surface detection algorithm and β-spline transformation. (B) Output of the surface detection algorithm. The proposed Bayesian approach uses prior information about expected bending of the section, its thickness and measurement error (see ‘Methods’ for details) to determine the volume of the image belonging to the tissue and to the out-of-field region. (C) The tissue section after correcting its bending by using quadratic β-splines. (D) Tissue section before (left) and after (right) the correction of the mechanical distortions and the tissue damage. (E) Full lobule-level reconstruction established by the alignment of six low-resolution sections (1 μm × 1 μm × 1 μm per voxel) and the interpolation of blood vessels. Two high-resolution images (0.3 μm × 0.3 μm × 0.3 μm per voxel) were registered in the low-resolution reconstruction and are shown in grey (see Video 1).

DOI: http://dx.doi.org/10.7554/eLife.11214.009

Figure 2.

Figure 2—figure supplement 1. Reconstruction of multi-scale tissue images.

Figure 2—figure supplement 1.

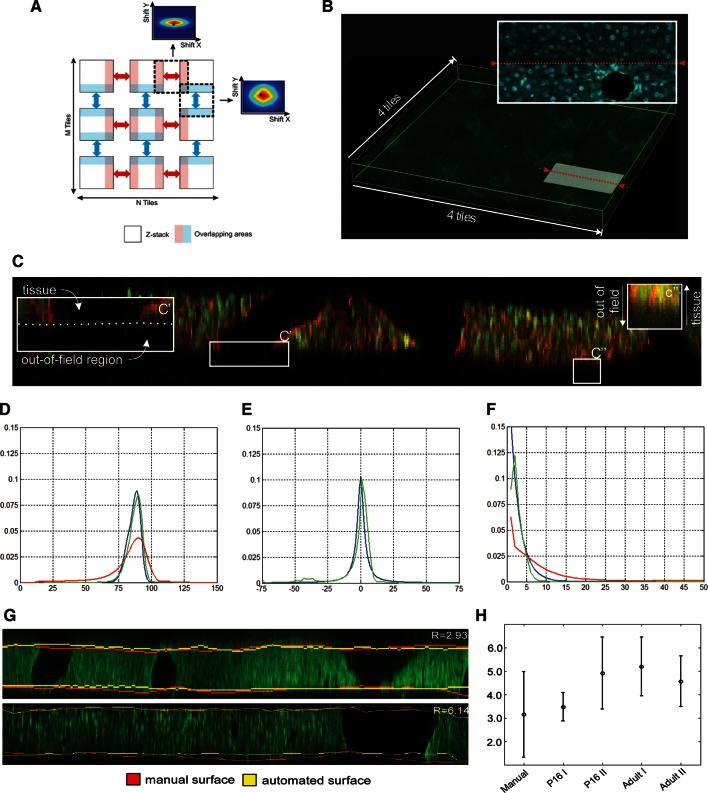
Tissue section reconstruction: (A) Schematic representation of an M × N grid of partially overlapping 3D images. The regions in light blue and light red represent the overlapping areas between neighbouring images. The colour-coded maps show the cross-correlation matrixes between neighbouring images. (B) Reconstructed tissue section from 4×4 a grid of low-resolution images. The pattern of DAPI staining (nuclei) at the intersection of two neighbouring images is shown. Correction mechanical distortion and tissue damage on serial sections: (C) x–z section of the image of a tissue section showing the main obstacles for the tissue surface detection: unstained volume of blood vessels (C') and blurring (C''). Probabilities (Dp(ym1,ym2,|y1,y2), (Ep(y2|y1) and (Fp(y1) calculated from the maximum entropy segmentation (red), model equations (blue) and manual solution (green). All distributions in the figure were averaged over all tissue sections in the benchmark. (G) Comparison of manual and automated surfaces calculated for two tissue sections from P16 (upper) and adult (lower) mice datasets. (H) Accuracy of surface detection. Plot presenting the mean absolute deviation calculated between manually and automatically detected surfaces for 33 different tissue sections in 4 data sets. Since tissue section segmentation is ambiguous, the control experiment was conducted by segmenting the same tissue sections manually three times.
Figure 2—figure supplement 2. Reconstruction of multi-scale tissue images.

Figure 2—figure supplement 2.

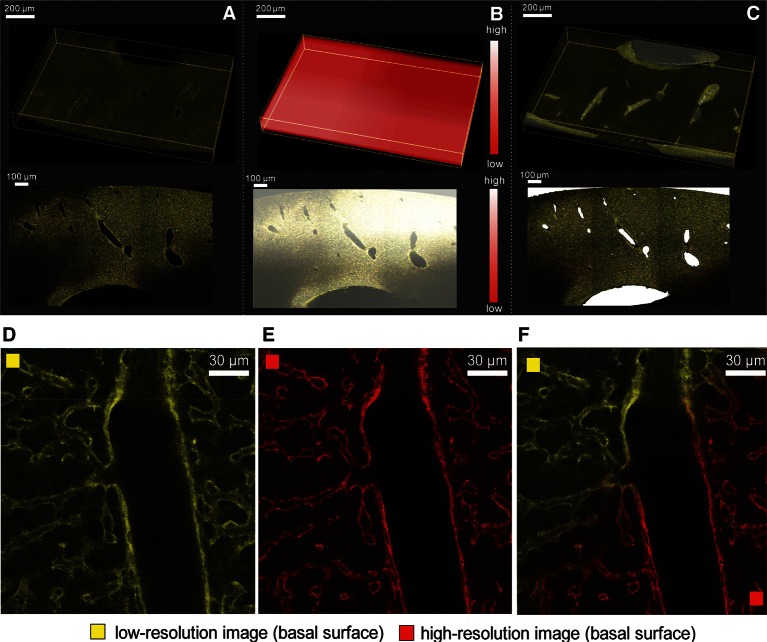
Tissue-level network segmentation: (A) Reconstructed image of a tissue section. Large vessels appear as empty space in the image. (B) Spatial distribution of the local maximum entropy threshold value. (C) Segmentation of large vessel in a single tissue section. Registration of high-resolution images into low-resolution ones: Representative region of a 2D plane of (D) a low-resolution (yellow) and (E) a high-resolution (red) image stained with Flk1 for sinusoids. (F) Superimposed images after the registration.