. 2016 Feb 15;5:e11181. doi: 10.7554/eLife.11181

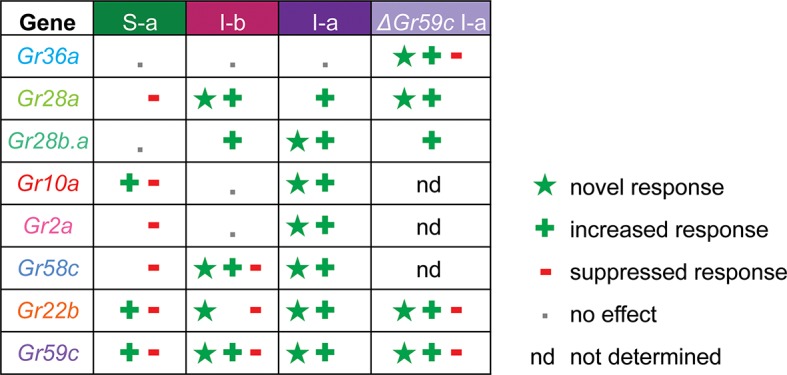
Figure 11. Gr ectopic expression produces receptor-specific and neuron-specific effects on the response profiles.

Effects are delineated for each tastant in Figure 11—figure supplement 1.
DOI: http://dx.doi.org/10.7554/eLife.11181.017

Figure 11.

Figure 11—figure supplement 1. Summary of effects of UAS-Gr expression on responses to tastants in different sensillum types, based on comparison with tested control lines.

Figure 11—figure supplement 1.

'+' indicates an increase in the level of an endogenous response. '*' indicates a novel response not observed in parental control lines examined. '-' indicates suppression of an endogenous response.