Abstract
Mitophagy, which is a special autophagy that removes damaging mitochondria to maintain sufficient healthy mitochondria, provides an alternative path for addressing dysfunctional mitochondria and avoiding cellular death. In the present study, by coupling the triphenylamine group with 2-phenylimidazo[4,5-f][1,10]phenanthroline derivatives, we synthesized five Ir(III) complexes with an AIE property that are expected to fulfill requirements for real-time monitoring of mitophagy. Ir1-Ir5 were exploited to image mitochondria with a short incubation time by confocal microscopy and inductive coupled plasma–mass spectrometry (ICP-MS). Due to aggregation-induced emission (AIE), Ir1-Ir5 exhibited excellent photostability compared to MitoTracker Green (MTG). Moreover, Ir1-Ir5 manifested satisfactory photostability in the mitochondrial physiological pH range. In addition, the uptake mechanism of Ir1 was investigated using confocal microscopy and flow cytometry analysis. Finally, using both Ir1 and LysoTracker Green, we were able to achieve real-time monitoring of mitophagy.
As a membrane bound organelle, mitochondria is best known for its critical function involving energy production via oxidative phosphorylation1. Although mitochondria have maintained the double membrane character of their ancestors, they have acquired various additional functions within the cell due to evolution, such as energy production, apoptosis regulation, central metabolism, calcium modulation and redox signaling2,3,4. The reactive oxygen species (ROS) generated in the phosphorylation process have the potential to cause mitochondrial dysfunction via damage to mitochondrial proteins, DNA and lipids5. Extensive damage to the mitochondria may eventually lead to cell death due to their regulation of apoptosis6. Although cell death can benefit an organism, aberrant cell death is detrimental to the organism due to the premature loss of cells, especially when the cells that are lost are post-mitotic cell types, such as neurons7. Mitophagy, which is a well-known form of autophagy that removes damaged mitochondria, can maintain a healthy mitochondrial pool and overcome the shortage caused by cellular loss in apoptosis or necrosis5,8. Microcosmic information of the physiological changes in mitophagy and may predict mitochondrial-related macroscopic diseases, including cardiovascular diseases and neurodegenerative diseases9,10.
To obtain a high quality image on the subcellular level, many organelle specific agents, such as Hoechest 33342, Nonyl acridine orange and MitoTracker Red, have been commercialized11. However, at a dilute concentration, these dyes can be easily photobleached under continuous laser excitation. In addition, the photostability cannot be improved using a higher concentration of most commercial agents for the effect of concentration quenching12. Luminogens with aggregation-induced emission (AIE) characteristics exhibit almost no fluorescence when they are molecularly dissolved but become highly emissive in the aggregated state13. Strong fluorescence in an aggregate may resolve fluorescence quenching resulting from aggregation, which would promises a long period of observation without large luminescent signal loss14,15. Thus, in biological areas, agents with AIE characteristics have been used as probes for the sensing of biogenic species or as stains/contrast agents for the imaging of cells16,17,18,19,20,21.
In recent years, due to their large Stokes shifts (more than 100 nm), rapid transmembrane activity (short incubation time and less potential toxicity), long luminescence lifetimes (100 ns to 1 ms), and enhanced photostabilities (less photobleaching), phosphorescent cyclometalated cationic Ir(III) complexes for use as organelle labels and sensors have attracted much attention in the field of bioimaging and labeling22,23,24,25. Moreover, altering the structure can conveniently direct the location of these Ir(III) complexes to various subcellular region, such as the nucleus, cytoplasm, lysosome, mitochondria and Golgi apparatus26,27,28,29,30,31,32, or result in different optical properties, such as two-photon emission, AIE and near-infrared emission14,33,34. Therefore, to a great extent, the modification of the structure of some existing Ir(III) complexes may result in the production of a new property.
In previous studies, we have found that some Ir(III) complexes possess a high specificity for mitochondria and superior photostability, and can be used for mitochondrial imaging and tracking14,32,35,36,37. As for mitophagy monitoring, the impaired mitochondria involved in mitophagy would undergo a sophisticated process for a long period of time including not only short-time dynamics change mentioned in our previous work, but also pH fluctuation, violent morphology alteration and membrane potential lost8,38. Hence, compared to dynamics tracking, probes for mitophagy monitoring are required to manifest higher biocompability, photostability and pH stability to enable long time monitoring in a complicated process. With these requirements mentioned above, we envisaged to combine AIE property with Ir(III) complexes to expect a favorable mitophagy probe. To the best of our knowledge, no AIE iridium(III) probes have been used as a mitochondrial probe for real-time mitophagy monitoring. Therefore, in this study, triphenylamine (TPA) group, a propeller-like structure with electron-donating properties which may bring AIE characteristics39,40, was introduced to iridium(III) complexes with 1-phenyl-1H-imidazo[4,5-f][1,10]phenanthroline derivatives, and the resulting AIE iridium(III) complexes should exhibit good photostability, large Stokes shifts and favorable transmembrane activity. The cellular location of these Ir(III) complexes was determined using confocal microscopy with MitoTracker Green FM (MTG) co-staining and inductively coupled plasma mass spectrometry (ICP-MS). We investigated the cytotoxicity and cellular uptake mechanism of all five Ir(III) complexes (Ir1–Ir5) as well as the phosphorescence stability of Ir1–Ir5 under photobleaching and pH fluctuation. In addition, Ir1 as well as LysoTracker Green were used for real-time monitoring of the mitophagy process.
Results and Discussion
Synthesis and characterization
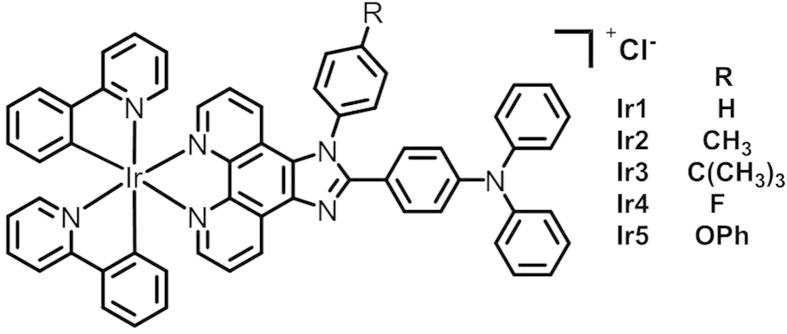
A series of N,N-diphenyl-4-(1-phenyl-1H-imidazo[4,5-f][1,10]phenanthrolin-2-yl)aniline derivatives (dippa, dtipa, dbipa, dfipa and dpoipa) were synthesized using “one-pot” method. The mixture of 4-(diphenylamino)benzaldehyde, 1,10-phenanthroline-5,6-dione, ammonium chloride and substituted-aniline were refluxed in acetic acid to yield the chosen ligands35,41. We prepared five Ir(III) complexes (see Fig. 1) by coordinating the corresponding ligands with [Ir(ppy)2Cl]2 in refluxed CHCl3/CH2OH (2:1). These complexes were purified by column chromatography and characterized by elemental analysis, ES-MS and 1H NMR spectroscopy (Figs S1–S10).
Figure 1. Chemical structures of the Ir1–Ir5 complexes.
Absorption and emission spectroscopy
The photophysical data are summarized in Table S1. The UV-Vis absorption spectra of Ir1-Ir5 in the DMSO/PBS solution are shown in Fig. S11. These complexes exhibited weak absorption bands in the region of 330–420 nm and stronger absorption bands in the region of 250–325 nm, both of which can be attributed to the mixed singlet and triplet metal-to-ligand charge-transfers (1MLCT and 3MLCT) and intra-ligand charge trasfers (C-N ligands)42. All five complexes reach maximum emission peaks at approximately 590 nm. These complexes enjoy the advantage of much larger Stokes shifts (around 210 nm) over that of commercial organic cellular dyes, such as LysoTracker Green DND-26 and BIDOPY 493/503 (Stokes shift = 7 nm and 10 nm, respectively)11.
Aggregation-induced emission (AIE) properties
The obtained complexes (Ir1-Ir5) readily dissolved in many organic solvents, such as chloroform, DMSO, acetonitrile, dichloromethane, ethanol and methanol. However, these complexes exhibited dissatisfactory water solubility. To determine whether these five Ir(III) complexes are AIE active and consider the biological application, the fluorescent behaviors of their diluted mixtures were studied in a mixture of PBS and DMSO with different water fractions. For example, as shown in Fig. 2, when the water content of the mixture was less than 70%, the Ir1 mixture exhibited almost no emission, and the photoluminescence intensity was significantly enhanced when the water content was increased to 90%, which is approximately 20-fold higher than that in low water content solvent. Other Ir(III) complexes exhibit similar properties (Figs S12–S15). The DLS experiments further confirmed the aggregation of Ir1 upon addition of water, and the presence of nanoparticles was observed at 148.4–433.8 nm in DMSO-PBS (9/1, v/v) (Figs S16–S20). These results indicate that Ir1-Ir5 exhibit an AIE effect.
Figure 2.
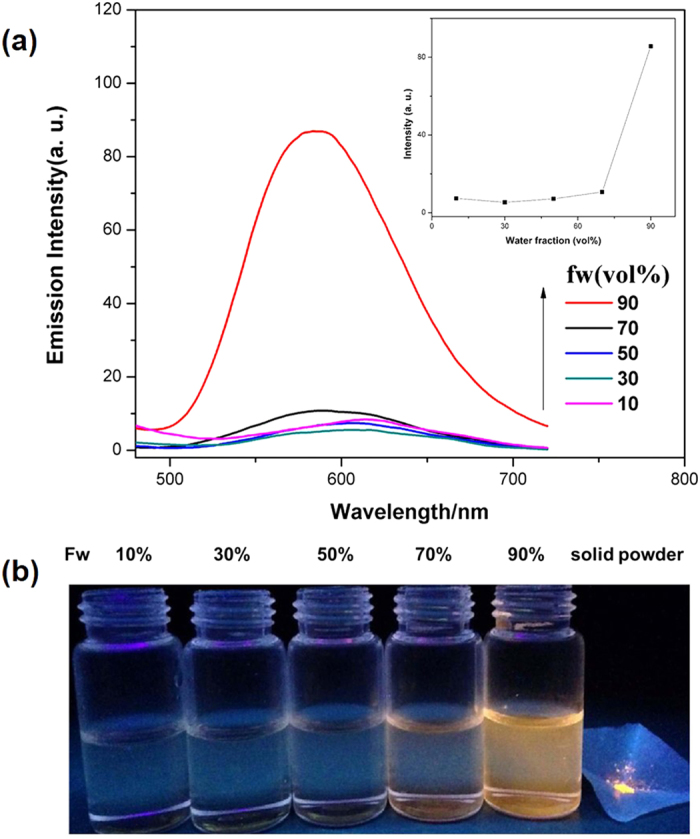
(a) Emission spectra of Ir1 in DMSO–PBS mixtures with different water fractions (fw); (b) Images of the room temperature luminescent emissions of Ir1 solid powder and Ir1 in DMSO–PBS mixtures with different water fractions (fw).
Cytotoxicity measurements
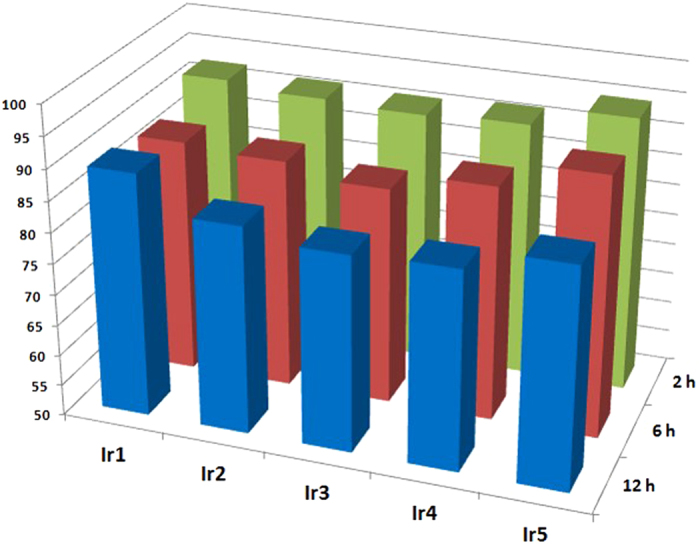
An ideal cellular probe for practical applications should minimally perturb living systems at the employed concentrations27. In order to evaluate the cytotoxicity of these complexes, HeLa cells were incubated with Ir1-Ir5 and their viability were subsequently tested by MTT assay43. The time-dependent effects of Ir1-Ir5 on the cell viability at 37 °C are depicted in Fig. 3. The results show that all complexes exhibit low toxicities. More than 85% of the cells survived after a 12 h incubation with the indicated agents respectively. The very low cytotoxicities of Ir1-Ir5 at work concentration lead us to the conclusion that Ir1-Ir5 are suitable for biological application under the applied conditions (500 nM of complex incubated for 8 min).
Figure 3. Viability of HeLa cells incubated with 500 nM Ir1–Ir5.
Cellular uptake and localization
To demonstrate that Ir1-Ir5 can specifically accumulate in mitochondria, we performed mitochondrial co-localization imaging experiments with these complexes and MitoTracker Green (MTG), a commercially available mitochondrial co-localizing dye. Unlike [Ru(dip)2(dppz)]2+ which suffers luminescence quenching in the presence of serum, Ir1-Ir5 showed no obvious luminescent changes when the incubated HeLa cells were exposed to fetal bovine serum (FBS)44. This property is consistent with another series of iridium complexes previously reported by our group and convenient for biological applications36.
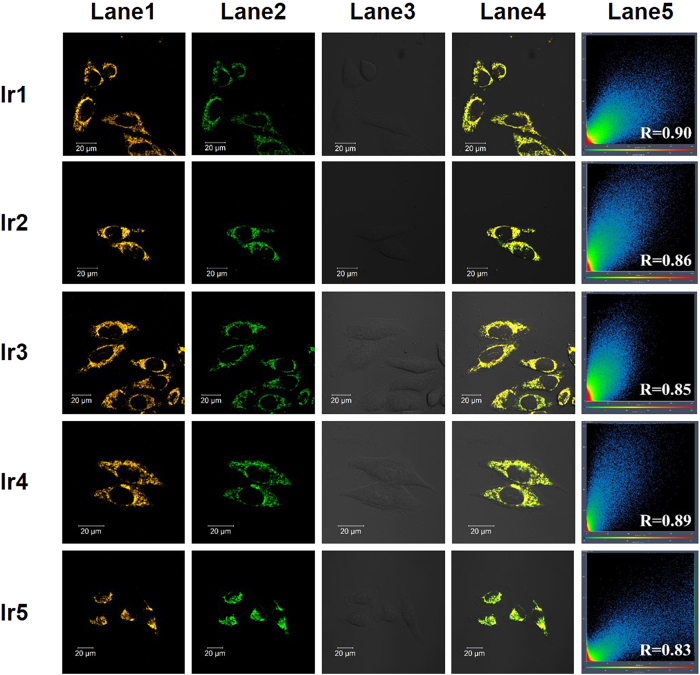
HeLa cells were incubated with 500 nM Ir1-Ir5 in Dulbecco minimum essential media (DMEM) containing 10% FBS for 8 min, followed by the removal of the medium, washed with PBS for three times and subsequently incubated with 100 nM MTG for 40 min. As shown in Fig. 4, we can observe an excellent agreement between the orange fluorescence channel from Ir(III) complexes and the green fluorescence channel from MTG, suggesting that Ir1–Ir5 selectively accumulate in mitochondria. The overlap extent of these two channels can be characterized by Pearson’s coefficient45. Pearson’s colocalization coefficients were recorded to be 0.90, 0.86, 0.85, 0.89 and 0.83 for Ir1-Ir5, respectively.
Figure 4. Confocal phosphorescence images and their images overlaid with bright-field images of living HeLa cells incubated with 500 nM of Ir1-Ir5 in DMEM with 10% FBS (pH = 7.4) for 8 min at 37 °C followed by 100 nM of MTR.
Lane 1, confocal phosphorescence images of Ir1-Ir5; Lane 2, confocal phosphorescence images of MTR; Lane 3, Bright field; Lane 4, overlay of lane 1, lane 2 and lane 3; Lane 4, the overlap coefficient of columns lane 1 and lane 2, and Pearson’s co-localization coefficients are also presented. Excitation wavelength: 405 nm (for all Ir(III) complexes), 488 nm (for MTG); emission filter: 590 ± 30 nm (for all Ir(III) complexes ) and 520 ± 20 nm (for MTG).
Since iridium is not a kind of fundamental element of cells, accurate cellular uptake levels of Ir(III) can be quantitatively determined by using ICP-MS46. The ICP-MS experiments were performed for each Ir1-Ir5 complex at a staining concentration of 500 nM to confirm the subcellular distribution of these Ir(III) complexes. The ICP-MS result (Fig. 5) revealed that high levels of cell Ir (nuclei+cytoplasm) were higher than 80%, remarkably, the ratios for Ir1 surpassed 90%. To rationally determine our incubation time, the time-dependent cellular uptake of Ir1 was studied using real-time imaging and ICP-MS, and the results (Figs S21 and S22) showed that the uptake of the Ir(III) complexes reached saturation within 8 min. Considering the systematic error of our experiments and the structural difference among the five complexes, we can infer that incubation time ranging from 5 to 10 min should be suitable for imaging. For convenience of operation in experiment and comparability of these five Ir(III) complexes, we choose 8 min as our incubation time of Ir(III) complexes in all experiments mentioned in this paper. The imaging results revealed that at a low concentration (500 nM), all of these complexes quickly crossed the membrane (within 8 min) and selectively accumulated in the mitochondria.
Figure 5. Distribution analysis of Ir1–Ir5 in HeLa cells using ICP-MS.
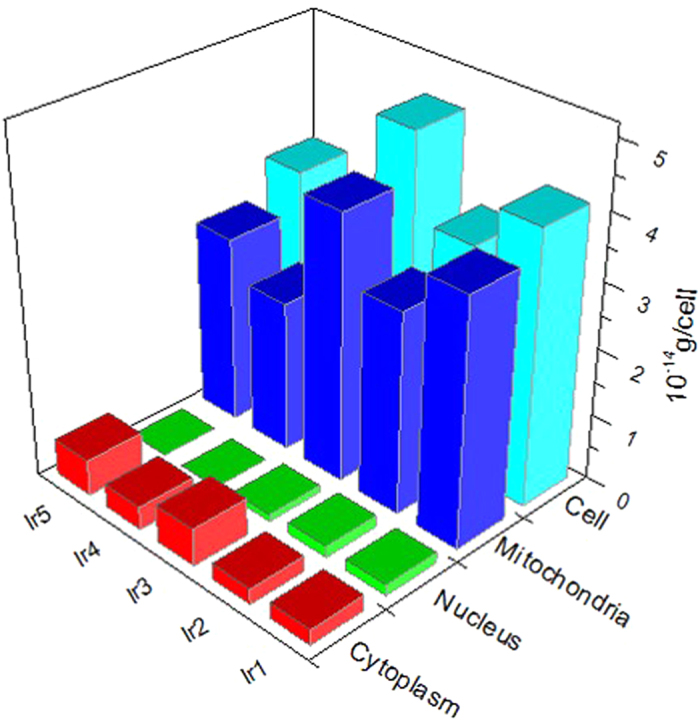
HeLa cells were incubated with Ir1-Ir5 (500 nM) for 8 min.
Mechanisms of cellular uptake
Small molecules enter cells via energy independent (diffusion, passive diffusion) or energy dependent (endocytosis, active transport) pathways26. To explore the mechanism of cellular entry, Ir1 was chosen to investigate cellular uptake at varying temperatures as well as different metabolic and endocytic levels.
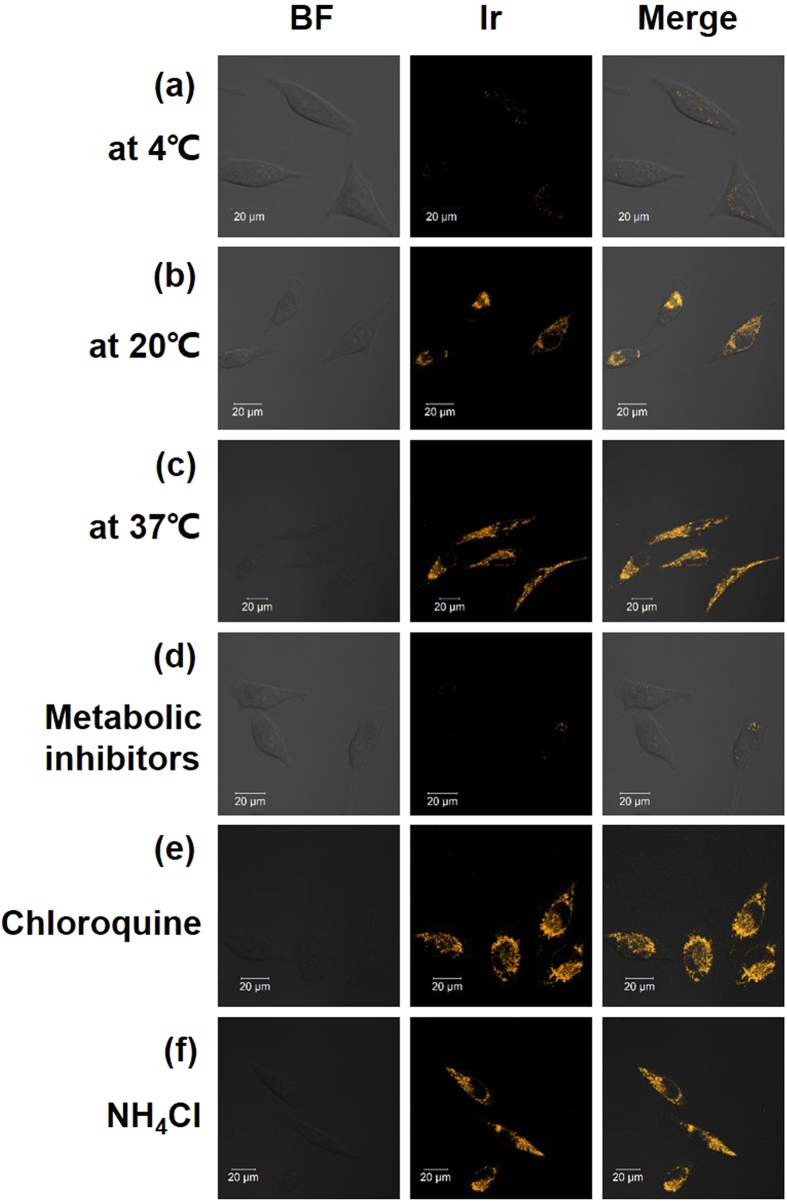
Blockage of cellular uptake was observed when the cell was incubated at 4 °C or pretreated with metabolic inhibitors (2-deoxy-D-glucose and oligomycin)44,47. As shown in Fig. 6a,d, the intracellular luminescence was too weak to be visualized. In addition, when the incubation temperature was elevated to room temperature (Fig. 6b), the intracellular luminescence recovered substantially but remained weaker than that at 37 °C (Fig. 6c). From these observations, we deduced that energy appears to play a vital role in the plasma membrane crossing and localizing in the mitochondria of Ir1. The activity of several proteins that aid Ir1 to engage transmembrane transport might be temperature dependent.
Figure 6. Confocal luminescence image and bright-field images of living HeLa cells incubated with 500 nM Ir1 in DMSO–PBS (pH 7.4, 1: 50, v/v) under different conditions.
(a–c) The cells were incubated with 500 nM Ir1 at 4 °C, 20 °C and 37 °C for 8 min, respectively. (d) The cells were preincubated with 50 mM 2-deoxy-D-glucose and 5 μM oligomycin in PBS for 1 h at 37 °C and then incubated with 500 nM Ir1 at 37 °C for 8 min. (e,f) The cells were pretreated with endocytic inhibitors (chloroquine (50 μM) and NH4Cl (50 mM), respectively) and then incubated with 500 nM Ir1 at 37 °C for 8 min (λex = 405 nm, λem = 590 ± 30 nm).
Endocytic membrane trafficking is an energy dependent general cell entry mechanism that involves receptor signaling (including signaling from receptor tyrosine kinases and G protein-coupled receptors)48. Herein, two kinds of inhibitors of endocytosis (chloroquine and ammonium chloride) were utilized to take a closer look into the procedure of cellular uptake of Ir149. The confocal image revealed that endocytosis inhibition by chloroquine or ammonium chloride does not interfere with membrane transport of Ir1 (Fig. 5e,f). Furthermore, these results were supported by the flow cytometry experiments results (Fig. S16).
Based on previous reports, entry via the endocytotic pathway should be a slow process, thus, these Ir(III) complexes do not require a long time period to enter the cell, which reduces the possibility of endocytotic mechanisms of cellular uptake50,51. The time-dependent ICP-MS results indicated that Ir1 uptake reached a maximum within 8–10 min (Fig. S21). All of the results suggest that the endocytotic pathway is not responsible for the cellular uptake of Ir1. However, the inherent mechanism about which proteins or other biomolecules assist Ir1 to cross the plasma membrane and accumulate in mitochondria was still under investigation. In summary, Ir1 crosses the plasma membrane using a non-endocytic energy dependent active transport. In addition, based on the structural similarity of the five Ir(III) complexes, we presume other complexes may share the same mechanisms of transmembrane transport.
Photobleaching and pH-dependent luminescent stability experiments
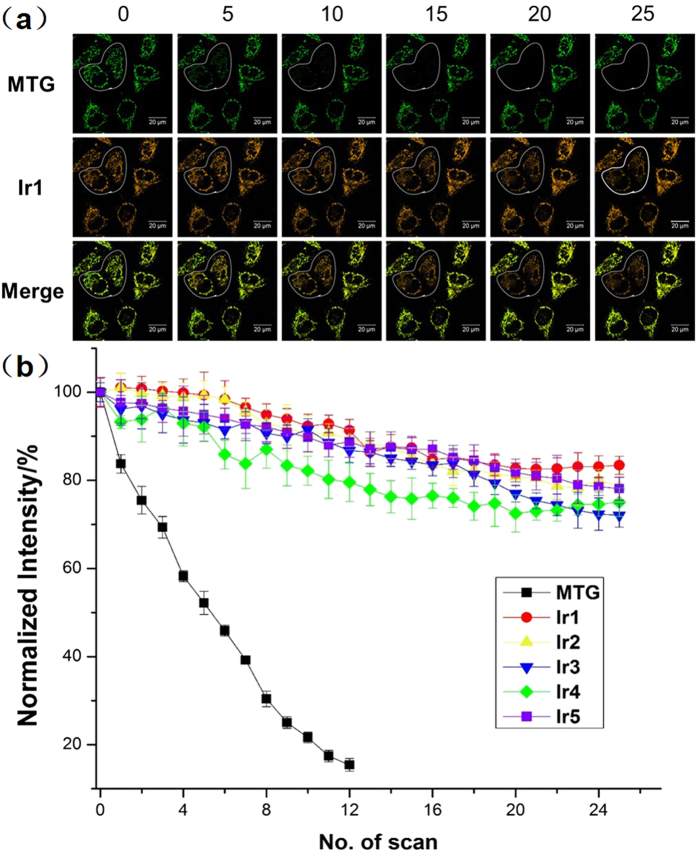
Photostability (anti-bleaching property) is a crucial criteria to evaluate new fluorescent imaging agents for bioimaging, especially for real-time and long-term imaging12. The comparison in photostabilities of all five Ir(III) complexes and the organic dye (MTG) under continuous laser irradiation was made by the photobleaching experiment of Ir(III) complexes and MTG co-stained HeLa cells. Using Ir1 versus MTG as an example, during 10 scans with a total irradiation time of ~150 s, luminescence in the bleaching area was significantly decreased in the MTG channel, while no obvious change in the Ir1 channel could be observed (Fig. 7a). Even after 25 scans with a total irradiation time of 6 min, approximately 20% of the fluorescent signal was lost for Ir1 but the mitochondria in the HeLa cells were still clearly observed. Similar results of Ir2-Ir5 were shown in Figs S24–S27. Statistically, after 10 scans, an ~80% decrease in the normalized fluorescence signal intensity of MTG was detected and in the contrary, less than 10% intensity decrease were observed in the Ir(III) complexes (Fig. 7b). This good photobleaching stability may be due to an inherent property of heavy-metal complexes as well as the formation of AIE particles because the condensed particles can prevent further photobleaching and photooxidation by avoiding oxygen diffusion into the particles12,52.
Figure 7. Photobleaching experiments of the Ir(III) complexes in HeLa cells.
(a) Time-dependent confocal imaging of Ir1/MTG co-stained HeLa cells. Confocal images of HeLa cells stained with Ir1 and MTG before and after verified scans of light irradiation. Time interval per scan: 15 s. Scale bar: 20 mm (λex = 405 nm, λem = 590 ± 30 nm). (b) Quantitative photobleaching results indicate that Ir1–Ir5 exhibited robust emission intensity under continuous light irradiation.
For bioimaging, dyes should be usable within the physiological pH range41. We therefore investigated the luminescence properties of the Ir(III) complexes in the pH range of 4.0–10.0. The results indicated that the luminescence of Ir2-Ir5 barely changed when the pH value was in the range of 4.0–8.0. However, as shown in Fig. S28, when the pH value is higher than 9.0, the photoluminescence intensity decreased substantially (~30%). These results are different from those previously reported even though the Ir(III) complexes have similar ligands36. Therefore, the difference may be due to the introduction of the triphenylamine group. It is important to note that the stability in a pH range from 4.0 to 8.0 is also favorable for mitochondria because their physiological pH is 6.50 to 8.2053.
Real-time monitoring of the mitophagy process
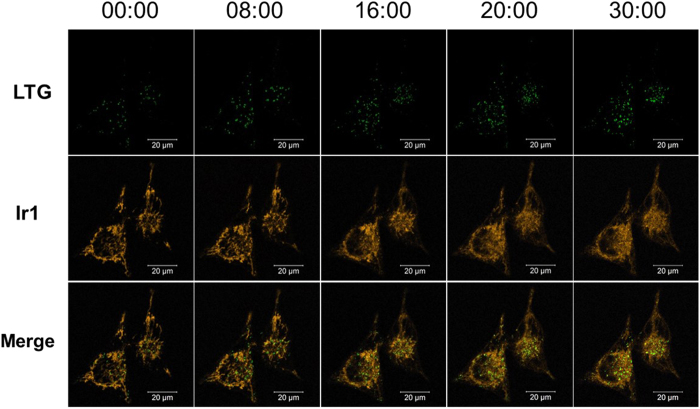
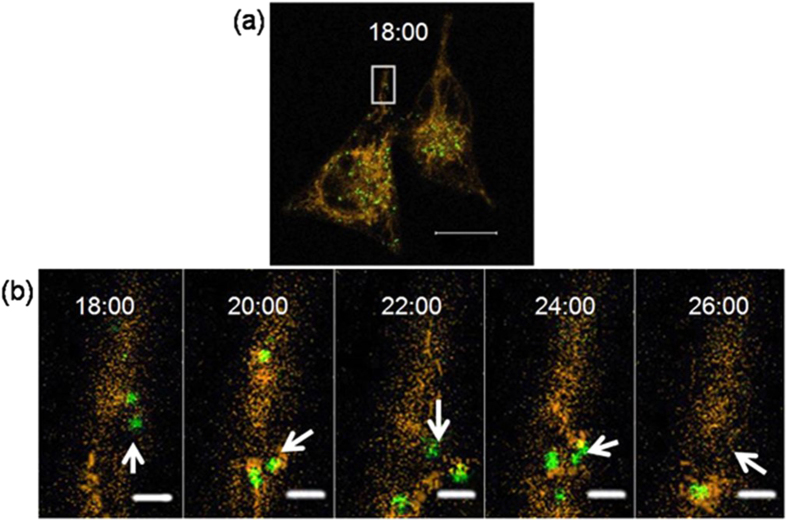
Mitochondria continuously oxidize substrates and maintain a proton gradient across the lipid bilayer with a very large membrane potential of ~180 mV54,55. Variation in the membrane potential of mitochondria in cells has evolved as a read-out of the mitochondrial functional status and generates signals to activate pathways that repair or eliminate defective mitochondria2. Twig et al. demonstrated that mitochondria are prone to mitophagy when the pool of mitochondria suffer a significant reduction in the mitochondrial membrane potential56. As an ionophore, CCCP was used as an important agent for gaining insight into the mitophagy pathway57,58. In addition, CCCP cannot only be used to trigger mitophagy but also bulk autophagy59,60. Therefore, in this study, the HeLa cells were treated with the CCCP to trigger mitophagy, and Ir1 and LysoTracker Green (LTG) were used to locate the mitochondria and lysosome, respectively. In addition, chloroquine was added to inhibit autophagic flux according to the previously reported methods8. Along with reticulum-like mitochondria being gradually transformed into small and dispersed fragments upon exposure to CCCP, the intensity of green photoluminescence signal from LTG increased sharply, which indicate the occurrence of mitophagy (Fig. 8 and Video S1). At 20 min of real-time monitoring, a new green fluorescent spot appears (white arrow) and overlaps the orange Ir1-labelled mitochondria. This result indicates the formation of acidic autophagosome and initiation of mitophagy process in this area17. The disappearance of the green fluorescent signal at 26 min suggests that the mitophagy process was complete in this area of the cell (Fig. 9). The time range of completing mitophagy observed in the present study is similar to previous reports17,61. Additionally, a long-term observation experiment was performed without the addition of CCCP to determine if the mitophagy process was induced by CCCP (Fig. S29). In this observation, the fluorescence signals from the mitochondria and lysosomes were mostly unchanged except for a decrease in the signal due to photobleaching. The result indicates that the observed mitophagy is primarily due to the presence of CCCP.
Figure 8. Phosphorescence images of CCCP (10 μM) treated living HeLa cells stained with Ir1 (0.5 μM).
To inhibit autophagic flux, the cells were preincubated with chloroquine (50 μM) prior to the addition of CCCP. Scale bar: 20 mm (λex = 405 nm, λem = 590 ± 30 nm).
Figure 9. Confocal images of HeLa cells stained with Ir1 (500 nM, orange) and LTG (100 nM, green) in the presence of CCCP (10 μM).
(a) Time points (min) were selected from the onset and completion of the mitophagy process. The regions (b) indicated in white boxes are enlarged from the shown area of this cell. Following imaging is shown in (b) until the observed mitophagy process is completed in the selected area. Scale bar: 20 μm (a) and 2 μm (b). (Ir1, λex = 405 nm, λem = 590 ± 30 nm).
Conclusion
In summary, five cyclometalated iridium(III) complexes (Ir1–Ir5) exhibiting AIE properties were designed and synthesized. As AIE phosphorescent agents, these Ir(III) complexes were employed as mitochondrial probes with good photostability. In a short imaging time period (8 min) at a low concentration (500 nM) with no phosphorescent intensity fluctuation in the mitochondrial physiological range, Ir1-Ir5 selectively and efficiently located the mitochondria. Similar to Ir(III) complexes in our previous study, the results from the cellular uptake experiments indicated that these Ir(III) complexes cross the cellular membrane by a non-endocytotic active transport approach. Of high interest, Ir1, along with LTG, were employed to successfully monitor mitophagy induced by CCCP. With this convenient and competent mitophagy probe, we can tackle the problem occurred in mitophagy tracking including not only the short-time dynamics change but also pH fluctuation, violent morphology alteration and membrane potential lost. This mitochondrion-specific probe expands the molecule libraries of AIE cyclometalated iridium(III) complexes probes and is expected to be a useful tool for a range of biological imaging, dynamic monitoring studies and helping to give an insight into the mitophagy process involved in disease.
Methods
General Procedure
All of the reactants and solvents were purchased from commercial sources and used as received unless otherwise stated. All of the procedures involving IrCl3·xH2O were carried out under an argon atmosphere in dark.
All Microanalysis (C, H, and N) was carried out using an Elementar Vario EL elemental analyzer. 1H NMR spectra were recorded using a 300 MHz nuclear magnetic resonance spectrometer (Varian, Mercury-Plus 300) and a 400 MHz Bruker nuclear magnetic resonance spectrometer (AVANCE III). All of the chemical shifts are reported relative to tetramethylsilane (TMS). The electronic absorption spectra were recorded using a Perkin-Elmer Lambda 850 UV/Vis spectrometer. The emission spectra were recorded using a Perkin-Elmer LS 55 luminescence spectrometer. The electrospray mass spectra were recorded using Shimadzu liquid chromatography-mass spectrometry (LCMS-2010A). The inductively coupled plasma mass spectrometry (ICP-MS) experiments were performed on a Thermo X2 instrument. Confocal luminescent microscopy experiments were conducted on a LSM 710 (Carl Zeiss) laser scanning confocal microscope. The particle size analyses were determined at room temperature on a zeta potential analyzer (MALVERN HPPS5001, England).
Synthesis of ligands and its corresponding iridium(III) complexes
1,10-phenanthroline-5,6-dione62 as well as [Ir(ppy)2Cl]263 was synthesized according to published methods.
Synthesis of N,N-diphenyl-4-(1-phenyl-1H-imidazo[4,5-f][1,10]phenanthrolin-2-yl)aniline (dpipa)
A mixture of 1,10-phenanthroline-5,6-dione (0.525 g, 2.5 mmol), ammonium acetate (3.85 g, 50 mmol), 4-(N,N-diphenylamino)benzaldehyde (0.683 g, 2.5 mmol), aniline (0.233 g, 2.5 mmol) and glacial acetic acid (15 ml) was refluxed under argon for 15 h. Then, the reaction mixture was cooled to room temperature and poured into water (40 ml). The obtained mixture was neutralized with 25% NH3 aqueous solution and extracted with chloroform (20 ml × 4). The organic phase was combined and dried with MgSO4 overnight, and then solvent was removed under vacuum. The crude product was purified by column chromatography on silica with CH2Cl2-ethanol (50:1, v/v) as the eluent. The resulting solid was recrystallized from chloroform-toluene to afford a pale yellow microcrystal. Yield, 0.951 g, 70.6%. Anal. Calcd. for C37H25N5 (%): C, 82.35; H, 4.67; N, 12.98. Found (%): C, 82.14; H, 4.85; N, 12.91. 1H NMR (300 MHz, DMSO-d6): δ 9.11–8.87 (m, 3H), 7.91–7.81 (m, 1H), 7.74 (s, 5H), 7.44 (s, 3H), 7.32 (d, J = 7.8 Hz, 5H), 7.04 (d, J = 7.8 Hz, 6H), 6.80 (s, 2H). ES-MS (CH2Cl2): m/z = 540.5 [M+H]+.
Synthesis of N,N-diphenyl-4-(1-(p-tolyl)-1H-imidazo[4,5-f][1,10]phenanthrolin-2-yl)aniline (dtipa)
This compound was synthesized using a procedure that was identical to that described for ligand dpipa except that p-toluidine (0.268 g, 2.5 mmol) was used instead of aniline. Yield, 0.908 g, 65.7%. Anal. Calcd. for C26H18N4 (%): C, 82.29; H, 5.09; N, 12.63. Found (%): C, 82.43; H, 5.20; N, 12.37. 1H NMR (300 MHz, CDCl3): δ 9.25 (d, J = 5.1 Hz, 2H), 9.08 (d, J = 4.2 Hz, 1H), 7.85–7.75 (m, 1H), 7.52–7.40 (m, 7H), 7.30–7.23 (m, 6H), 7.14–7.05 (m, 5H), 6.95 (d, J = 8.7 Hz, 2H), 2.58 (s, 3H). ES-MS (CH2Cl2): m/z = 554.4 [M+H]+.
Synthesis of N,N-diphenyl-4-(tert-butyl)phenyl-1H-imidazo[4,5-f][1,10]phenanthrolin-2-yl)aniline (dbipa)
This compound was synthesized using a procedure that was identical to that described for ligand dpipa except that 4-(tert-butyl)aniline (0.373 g, 2.5 mmol) was used instead of aniline. Yield, 1.093 g, 73.5%. Anal. Calcd. for C41H33N5 (%): C, 82.66; H, 5.58; N, 11.76. Found (%): C, 82.39; H, 5.73; N, 11.88. 1H NMR (300 MHz, DMSO): δ 9.09–9.02 (m, 1H), 9.00–8.93 (m, 1H), 8.94–8.88 (m, 1H), 7.89–7.78 (m, 1H), 7.67 (d, J = 13.8 Hz, 4H), 7.46 (d, J = 9.0 Hz, 3H), 7.32 (t, J = 7.5 Hz, 5H), 7.10 (s, 2H), 7.03 (d, J = 7.5 Hz, 4H), 6.82 (d, J = 9.0 Hz, 2H), 1.41 (s, 9H). ES-MS (CH2Cl2): m/z = 596.5 [M+H]+.
Synthesis of N,N-diphenyl-4-fluorophenyl-1H-imidazo[4,5-f][1,10]phenanthrolin-2-yl)aniline (dfipa)
This compound was synthesized using a procedure that was identical to that described for ligand dpipa except that 4-fluoroaniline (0.278 g, 2.5 mmol) was used instead of aniline. Yield, 1.050 g, 72.8%. Anal. Calcd for C37H24FN5 (%): C, 79.70; H, 4.34; N, 12.56. Found (%): C, 79.46; H, 4.67; N, 12.68. 1H NMR (300 MHz, DMSO): δ 9.10–8.87 (m, 3H), 7.89–7.80 (m, 3H), 7.60–7.42 (m, 5H), 7.34 (t, J = 7.8 Hz, 5H), 7.15–7.01 (m, 6H), 6.85 (d, J = 8.7 Hz, 2H). ES-MS (CH2Cl2): m/z = 558.4 [M+H]+.
Synthesis of N,N-diphenyl-4-phenoxyphenyl-1H-imidazo[4,5-f][1,10]phenanthrolin-2-yl)aniline (dpoipa)
This compound was synthesized using a procedure that was identical to that described for ligand dpipa except that 4-phenoxyaniline (0.462 g, 2.5 mmol) was used instead of aniline. Yield, 0.959 g, 60.7%. Anal. Calcd for C43H29N5O (%): C, 81.75; H, 4.63; N, 11.08. Found (%): C, 81.51; H, 4.82; N, 11.27. 1H NMR (300 MHz, CDCl3): δ 9.06 (s, 1H), 8.96 (t, J = 7.2 Hz, 2H), 7.85 (dd, J = 8.1, 4.2 Hz, 1H), 7.74 (d, J = 8.4 Hz, 2H), 7.55 (d, J = 4.2 Hz, 1H), 7.47 (dd, J = 16.8, 8.1 Hz, 5H), 7.37–7.26 (m, 6H), 7.20 (t, J = 8.1 Hz, 3H), 7.13 (d, J = 7.2 Hz, 2H), 7.07 (d, J = 8.1 Hz, 4H), 6.88 (d, J = 8.4 Hz, 2H). ES-MS (CH2Cl2): m/z = 632.5 [M+H]+.
The five Ir(III) complexes were synthesized as described below. A chloro-bridged dimer [Ir(ppy)2Cl]2 (0.088 g, 0.08 mmol) and corresponding ligands (0.015 mmol) were placed in a 100 ml round-bottom flask with 40 ml of methanol and CHCl3 (1:1, v/v). The mixture was heated at 60 °C for 8 h under argon and avoids to be exposed to light. After the solution cooled to room temperature, the solvent was removed under vacuum to afford an orange precipitate. The product was purified by column chromatography on alumina using acetonitrile-ethanol (10:1, v/v) as the eluent.
Ir1
Yield: 0.1127 g, 72.2%. Anal. Calcd. for C59H41N7ClIr (%): C, 65.87; H, 3.84; N, 9.12. Found (%): C, 65.67; H, 4.09; N, 8.91. 1H NMR (400 MHz, DMSO): δ9.30 (dd, J = 8.4, 1.4 Hz, 1H), 8.25 (m, 3H), 8.15 (dd, J = 8.4, 5.2 Hz, 1H), 8.06 (dd, J = 5.2, 1.2 Hz, 1H), 7.99–7.86 (m, 4H), 7.84–7.72 (m, 6H), 7.50 (dd, J = 7.2, 5.2 Hz, 4H), 7.46–7.41 (m, 1H), 7.36 (t, J = 8.0 Hz, 4H), 7.15 (t, J = 7.2 Hz, 2H), 7.10–7.05 (m, 5H), 7.05–6.91 (m, 5H), 6.85 (d, J = 8.8 Hz, 2H), 6.28 (dd, J = 13.4, 7.2 Hz, 2H). ES-MS (CH3OH): m/z = 1040.25 [M-Cl−]+.
Ir2
Yield: 0.1222 g, 74.7%. Anal. Calcd for C60H43N7ClIr (%): C, 66.13; H, 3.98; N, 9.00. Found (%): C, 66.01; H, 4.17; N, 8.82. 1H NMR (400 MHz, DMSO): δ9.29 (d, J = 8.2 Hz, 1H), 8.31–8.21 (m, 3H), 8.14 (dd, J = 8.2, 5.2 Hz, 1H), 8.06 (d, J = 4.4 Hz, 1H), 7.93 (m, 4H), 7.77 (dd, J = 8.8, 5.2 Hz, 1H), 7.68 (d, J = 8.8 Hz, 2H), 7.59–7.48 (m, 7H), 7.37 (t, J = 8.0 Hz, 4H), 7.15 (t, J = 7.2 Hz, 2H), 7.11–6.99 (m, 8H), 6.95 (dd, J = 16.0, 8.0 Hz, 2H), 6.85 (d, J = 8.8 Hz, 2H), 6.28 (dd, J = 11.2, 7.6 Hz, 2H). ES-MS (CH3OH): m/z = 1054.00 [M-Cl−]+.
Ir3
Yield: 0.1123 g, 66.2%. Anal. Calcd. for C63H49N7ClIr (%): C, 66.86; H, 4.36; N, 8.66. Found (%): C, 66.58; H, 4.65; N, 8.53. 1H NMR (400 MHz, DMSO): δ 9.29 (dd, J = 8.4, 1.6 Hz, 1H), 8.28 (t, J = 9.2 Hz, 2H), 8.23 (dd, J = 5.2, 1.6 Hz, 1H), 8.14 (dd, J = 8.4, 5.2 Hz, 1H), 8.07 (dd, J = 5.2, 1.2 Hz, 1H), 7.96 (dd, J = 10.4, 8.4 Hz, 2H), 7.93–7.86 (m, 2H), 7.74 (m, 5H), 7.52–7.46 (m, 5H), 7.36 (dd, J = 10.8, 5.2 Hz, 4H), 7.14 (t, J = 7.6 Hz, 2H), 7.10–7.00 (m, 8H), 6.99–6.91 (m, 2H), 6.88–6.81 (m, 2H), 6.28 (dd, J = 9.6, 7.6 Hz, 2H), 1.39 (s, 9H). ES-MS (CH3OH): m/z = 1096.25 [M-Cl−]+.
Ir4
Yield: 0.116 g, 81.7%. Anal. Calcd. for C59H40N7ClIr (%): C, 65.94; H, 3.75; N, 9.12. Found (%): C, 65.76; H, 3.88; N, 8.98. 1H NMR (400 MHz, DMSO): δ 9.29 (d, J = 8.4 Hz, 1H), 8.31–8.25 (m, 2H), 8.23 (d, J = 5.2 Hz, 1H), 8.17–8.13 (m, 1H), 8.08 (d, J = 4.8 Hz, 1H), 7.99–7.93 (m, 2H), 7.89 (dd, J = 13.6, 7.6 Hz, 4H), 7.81 (dd, J = 7.6, 5.6 Hz, 1H), 7.64–7.54 (m, 3H), 7.50 (d, J = 7.2 Hz, 4H), 7.37 (t, J = 7.2 Hz, 4H), 7.15 (t, J = 7.2 Hz, 2H), 7.12–6.99 (m, 8H), 6.96 (dd, J = 15.6, 7.6 Hz, 2H), 6.88 (d, J = 7.2 Hz, 2H), 6.28 (dd, J = 13.2, 7.6 Hz, 2H). ES-MS (CH3OH): m/z = 1058.20 [M-Cl−]+.
Ir5
Yield: 0.13 g, 77.5%. Anal. Calcd for C65H45N7OClIr (%): C, 66.85; H, 3.88; N, 8.40. Found (%): C, 66.68; H, 4.14; N, 8.21. 1H NMR (400 MHz, DMSO): δ 9.29 (dd, J = 8.4, 1.2 Hz, 1H), 8.28 (t, J = 9.2 Hz, 2H), 8.23 (dd, J = 5.2, 1.6 Hz, 1H), 8.14 (dd, J = 8.4, 5.2 Hz, 1H), 8.10 (dd, J = 5.2, 1.2 Hz, 1H), 7.97 (t, J = 8.4 Hz, 2H), 7.93–7.84 (m, 3H), 7.82–7.76 (m, 2H), 7.66 (dd, J = 8.4, 1.2 Hz, 1H), 7.55 (d, J = 8.8 Hz, 2H), 7.51–7.43 (m, 4H), 7.40–7.29 (m, 6H), 7.26 (d, J = 7.2 Hz, 1H), 7.23–7.14 (m, 4H), 7.12–7.08 (m, 4H), 7.08–6.90 (m, 8H), 6.29 (dd, J = 10.0, 8.0 Hz, 2H). ES-MS (CH3OH): m/z = 1131.95 [M-Cl−]+.
Cell viability assay
The HeLa cells were cultivated in DMEM with 10% FBS (Gibco) and 1% antibiotic solution (1% penicillin and streptomycin) (Gibco) at 37 °C under 5% CO2 and 95% relative humidity. The cytotoxicity of these Ir(III) complexes against HeLa cells was evaluated using the MTT assay. The exponentially grown HeLa cells were seeded in triplicate into 96-well plates at an appropriate concentration. After incubation for 24 h, the cells were treated with Ir1-Ir5 respectively at the concentration used for staining (500 nM) for various durations. To stain the live cells, 10 μl of MTT (5 mg/ml, Sigma) was added to each well. Then, the cells were incubated for an additional 4 h at previous culture conditions. The media was carefully removed, and then, 150 μl of DMSO was added to every sample well to dissolve the formed formazan crystals. The optical density of the obtained formazan solution of the samples was measured at 590 nm using an ELISA reader (BioTek Instruments Inc., Winooski, Vermont).
Confocal luminescence imaging
The HeLa cells were incubated at a density of ~1 × 10⁴ cells per ml in DMEM supplemented with 10% FBS as well as 1% antibiotic material at 37 °C in a 5% CO2. After incubation for 1 day to make sure adhesion of a majority of the cells were accomplished, then cells were directly treated with 500 nM Ir(III) complexes in DMEM for 8 min without any replacement of medium. After removing the DMEM and washing with PBS buffer three times to remove the remaining dye, the HeLa cells were further stained with MTG for another 40 min. The cells were carefully washed three times with PBS buffer prior to the luminescence imaging measurements. Laser power for Ir(III) complexes in the wavelength of 405 nm is 150 μW, and that for MTG in the wavelength of 488 nm is 100 μW The cell images were captured with Zeiss LSM 710 NLO confocal microscope (63 × /NA 1.4 oil immersion objective) and analyzed using the AxioVision 4.2 software (Carl Zeiss).
Cellular uptake analysis
The HeLa cells were incubated at a density of ~2 × 10⁵ cells per ml in 25 cm2 culture plates (Corning) with 6 ml of DMEM with 10% FBS. After incubating for 48 h, the monolayer Hela cells nearly oversperead the whole plates. Ir1-Ir5 (500 nM) was added to the culture medium and incubated for 8 min or for a time period within the range of 0–30 min at 37 °C. After digestion with trypsin (Gibco) and gathering in 3 ml DMEM, the HeLa cells were counted and divided into two equal parts as tested samples. The first sample for nuclear isolation using a nucleus extraction kit and the second one for mitochondrial extraction using a cytoplasm and mitochondria extraction kit (Shanghai Sangon Biological Engineering Technology & Services Co. Ltd.). All of the treated samples were digested in 65% nitric acid at room temperature for at least 48 h. Each sample was diluted with Mili-Q Water to obtain 3% HNO3 sample solutions. The iridium concentration in the two parts for each sample was determined by inductively coupled plasma mass spectrometry.
Flow cytometry analysis
HeLa cells, at a density of about 1 × 10⁵ cells per ml, were seeded in 6-well plates in DMEM with 10% FBS for 24 h in an incubator and then treated with Ir1 (500 nM) for 8 min at 37 °C without medium replacement. The cells were washed with PBS three times to remove the residual complexes, trypsinized for 1 min to gain cell suspension. After centrifugation for the cell suspension the supernatant was discarded, then 1 ml PBS was added. These cell uptake samples were analyzed using a FACS Canto II instrument (BD Biosciences, USA).
Mitophagy real-time monitoring
The HeLa cells were incubated at a proper density until the cells were adhered. According to the literature method64, Ir1 (500 nM) and LTG (100 nM) were used to co-stain HeLa cells, and time-dependent confocal images were collected after mitophagy induction. Mitochondrial uncoupler CCCP (10 μM) was used to induce mitophagy, and chloroquine (50 μM) was used to inhibit autophagic flux. Excitation wavelengths of 405 nm and 488 nm with the varied power (150 μW and 100 μW, respectively). The cell images were captured with Zeiss LSM 710 NLO confocal microscope (63 × /NA 1.4 oil immersion objective) and analyzed using the AxioVision 4.2 software (Carl Zeiss).
Additional Information
How to cite this article: Jin, C. et al. Cyclometalated Iridium(III) Complexes as AIE Phosphorescent Probes for Real-Time Monitoring of Mitophagy in Living Cells. Sci. Rep. 6, 22039; doi: 10.1038/srep22039 (2016).
Supplementary Material
Acknowledgments
This work was supported by the 973 Program (No. 2015CB856301), and the National Science Foundation of China (Nos. 21171177, 21471164, and 21525105).
Footnotes
Author Contributions H.C. conceived the idea and directed the work. C.J. performed the experiments with help from J.L., R.G., C.O., Y.Z. and L.J. All authors contributed to data analysis and manuscript writing.
References
- Mishra P. & Chan D. C. Mitochondrial dynamics and inheritance during cell division, development and disease. Nat. Rev. Mol. Cell Biol. 15, 634–646 (2014). [DOI] [PMC free article] [PubMed] [Google Scholar]
- Friedman J. R. & Nunnari J. Mitochondrial form and function. Nature 505, 335–343 (2014). [DOI] [PMC free article] [PubMed] [Google Scholar]
- Kroemer G., Galluzzi L. & Brenner C. Mitochondrial membrane permeabilization in cell death. Physiol. Rev. 87, 99–163 (2007). [DOI] [PubMed] [Google Scholar]
- Ow Y. L. P., Green D. R., Hao Z. & Mak T. W. Cytochrome c: functions beyond respiration. Nat. Rev. Mol. Cell Biol. 9, 532–542 (2008). [DOI] [PubMed] [Google Scholar]
- Wang K. & Klionsky D. J. Mitochondria removal by autophagy. Autophagy 7, 297–300 (2011). [DOI] [PMC free article] [PubMed] [Google Scholar]
- Yen W.-L. & Klionsky D. J. How to live long and prosper: autophagy, mitochondria, and aging. Physiology 23, 248–262 (2008). [DOI] [PubMed] [Google Scholar]
- Green D. R., Galluzzi L. & Kroemer G. Mitochondria and the autophagy–inflammation–cell death axis in organismal aging. Science 333, 1109–1112 (2011). [DOI] [PMC free article] [PubMed] [Google Scholar]
- Dolman N. J., Chambers K. M., Mandavilli B., Batchelor R. H. & Janes M. S. Tools and techniques to measure mitophagy using fluorescence microscopy. Autophagy 9, 1653–1662 (2013). [DOI] [PubMed] [Google Scholar]
- Kubli D. A. & Gustafsson A. B. Mitochondria and mitophagy the yin and yang of cell death control. Circ. Res. 111, 1208–1221 (2012). [DOI] [PMC free article] [PubMed] [Google Scholar]
- Ding W. X. & Yin X. M. Mitophagy: mechanisms, pathophysiological roles, and analysis. Biol. Chem. 393, 547–564 (2012). [DOI] [PMC free article] [PubMed] [Google Scholar]
- Haugland R. P. Handbook of fluorescent probes and research chemicals, 6th edn, Eugene, OR, Molecular Probes (1996). [Google Scholar]
- Leung C. W. et al. A photostable AIE luminogen for specific mitochondrial imaging and tracking. J. Am. Chem. Soc. 135, 62–5 (2013). [DOI] [PubMed] [Google Scholar]
- Hong Y., Lam J. W. Y. & Tang B. Z. Aggregation-induced emission: phenomenon, mechanism and applications. Chem. Commum., 4332–4353 (2009). [DOI] [PubMed] [Google Scholar]
- Chen Y. et al. Mitochondria-specific phosphorescent imaging and tracking in living cells with an AIPE-active iridium(III) complex. Chem. Commun. 49, 11095–11097 (2013). [DOI] [PubMed] [Google Scholar]
- Hong Y., Lam J. W. Y. & Tang B. Z. Aggregation-induced emission. Chem. Soc. Rev. 40, 5361–5388 (2011). [DOI] [PubMed] [Google Scholar]
- Mei J., Leung N. L. C., Kwok R. T. K., Lam J. W. Y. & Tang B. Z. Aggregation-induced emission: together we shine, united we soar! Chem. Rev. 115, 11718–11940 (2015). [DOI] [PubMed] [Google Scholar]
- Zhang W. et al. Real-time monitoring of the mitophagy process by a photostable fluorescent mitochondrion-specific bioprobe with AIE characteristics. Chem. Commun. 51, 9022–9025 (2015). [DOI] [PubMed] [Google Scholar]
- Ding D., Li K., Liu B. & Tang B. Z. Bioprobes based on AIE fluorogens. Acc. Chem. Res. 46, 2441–2453 (2013). [DOI] [PubMed] [Google Scholar]
- Shi H., Liu J., Geng J., Tang B. Z. & Liu B. Specific detection of integrin αvβ3 by light-up bioprobe with aggregation-induced emission characteristics. J. Am. Chem. Soc. 134, 9569–9572 (2012). [DOI] [PubMed] [Google Scholar]
- Hong Y. et al. Monitoring and inhibition of insulin fibrillation by a small organic fluorogen with aggregation-induced emission characteristics. J. Am. Chem. Soc. 134, 1680–1689 (2012). [DOI] [PubMed] [Google Scholar]
- Qian J. et al. High-order non-linear optical effects in organic luminogens with aggregation-induced emission. Adv. Mater. 27, 2332–2339 (2015). [DOI] [PubMed] [Google Scholar]
- You Y. Phosphorescence bioimaging using cyclometalated Ir(III) complexes. Curr. Opin. Chem. Biol. 17, 699–707 (2013). [DOI] [PubMed] [Google Scholar]
- Leung C.-H. et al. A Metal-based inhibitor of tumor necrosis factor-α. Angew. Chem. Int. Ed. 51, 9010–9014 (2012). [DOI] [PubMed] [Google Scholar]
- Lo K. K. Luminescent rhenium(I) and iridium(III) polypyridine complexes as biological probes, imaging reagents, and photocytotoxic agents. Acc. Chem. Res. 48, 2985–95 (2015). [DOI] [PubMed] [Google Scholar]
- Ma D.-L., Chan D. S.-H. & Leung C.-H. Group 9 organometallic compounds for therapeutic and bioanalytical applications. Acc. Chem. Res. 47, 3614–3631 (2014). [DOI] [PubMed] [Google Scholar]
- Li C. et al. A nonemissive iridium(III) complex that specifically lights-up the nuclei of living cells. J. Am. Chem. Soc. 133, 11231–11239 (2011). [DOI] [PubMed] [Google Scholar]
- Zhao Q. et al. Cationic iridium(III) complexes with tunable emission color as phosphorescent dyes for live cell imaging. Organometallics 29, 1085–1091 (2010). [Google Scholar]
- Li G., Lin Q., Ji L. & Chao H. Phosphorescent iridium(III) complexes as multicolour probes for imaging of hypochlorite ions in mitochondria. J. Mater. Chem. B 2, 7918–7926 (2014). [DOI] [PubMed] [Google Scholar]
- He L. et al. Theranostic iridium(III) complexes as one- and two-photon phosphorescent trackers to monitor autophagic lysosomes. Angew. Chem. Int. Ed. Engl. 53, 12137–41 (2014). [DOI] [PubMed] [Google Scholar]
- Ho C. L. et al. A strong two-photon induced phosphorescent Golgi-specific in vitro marker based on a heteroleptic iridium complex. Chem. Commun. 48, 2525–2527 (2012). [DOI] [PubMed] [Google Scholar]
- Cao R., Jia J., Ma X., Zhou M. & Fei H. Membrane localized iridium(III) complex induces endoplasmic reticulum stress and mitochondria-mediated apoptosis in human cancer cells. J. Med. Chem. 56, 3636–3644 (2013). [DOI] [PubMed] [Google Scholar]
- Chen Y., Qiao L., Ji L. & Chao H. Phosphorescent iridium(III) complexes as multicolor probes for specific mitochondrial imaging and tracking. Biomaterials 35, 2–13 (2014). [DOI] [PubMed] [Google Scholar]
- Li G. et al. A mitochondrial targeted two-photon iridium(III) phosphorescent probe for selective detection of hypochlorite in live cells and in vivo. Biomaterials 53, 285–295 (2015). [DOI] [PubMed] [Google Scholar]
- Zhang G. L. et al. Near-infrared-emitting iridium(III) complexes as phosphorescent dyes for live cell imaging. Organometallics 33, 61–68 (2014). [Google Scholar]
- Jin C. et al. Cyclometalated iridium(iii) complexes with imidazo[4,5-f][1,10]phenanthroline derivatives for mitochondrial imaging in living cells. Dalton Trans. 44, 7538–7547 (2015). [DOI] [PubMed] [Google Scholar]
- Jin C. et al. Cyclometalated iridium(III) complexes as two-photon phosphorescent probes for specific mitochondrial dynamics tracking in living cells. Chem. Eur. J. 21, 12000–12010 (2015). [DOI] [PubMed] [Google Scholar]
- Chen Y., Xu W., Zuo J., Ji L. & Chao H. Dinuclear iridium(III) complexes as phosphorescent trackers to monitor mitochondrial dynamics. J. Mater. Chem. B 3, 3306–3314 (2015). [DOI] [PubMed] [Google Scholar]
- Lee M. H. et al. Mitochondria-immobilized pH-sensitive off-on fluorescent probe. J. Am. Chem. Soc. 136, 14136–14142 (2014). [DOI] [PMC free article] [PubMed] [Google Scholar]
- Lager E., Liu J., Aguilar-Aguilar A., Tang B. Z. & Peña-Cabrera E. Novel meso-polyarylamine-BODIPY hybrids: synthesis and study of their optical properties. J. Org. Chem. 74, 2053–2058 (2009). [DOI] [PubMed] [Google Scholar]
- Ning Z. et al. Aggregation-induced emission (AIE)-active starburst triarylamine fluorophores as potential non-doped red emitters for organic light-emitting diodes and Cl2 gas chemodosimeter. Adv. Func. Mater. 17, 3799–3807 (2007). [Google Scholar]
- Xu W., Zuo J., Wang L., Ji L. & Chao H. Dinuclear ruthenium(II) polypyridyl complexes as single and two-photon luminescence cellular imaging probes. Chem. Commun. 50, 2123–5 (2014). [DOI] [PubMed] [Google Scholar]
- Serroni S. et al. Tetranuclear bimetallic complexes of ruthenium, osmium, rhodium, and iridium. synthesis, absorption spectra, luminescence, and electrochemical properties. J Am. Chem. Soc. 116, 9086–9091 (1994). [Google Scholar]
- Gerlier D. & Thomasset N. Use of MTT colorimetric assay to measure cell activation. J. Immunol. Methods 94, 57–63 (1986). [DOI] [PubMed] [Google Scholar]
- Puckett C. A. & Barton J. K. Mechanism of cellular uptake of a ruthenium polypyridyl complex. Biochemistry 47, 11711–11716 (2008). [DOI] [PMC free article] [PubMed] [Google Scholar]
- Cheng G. H. et al. A highly specific BODIPY-based probe localized in mitochondria for HClO imaging. Analyst 138, 6091–6096 (2013). [DOI] [PubMed] [Google Scholar]
- Li Y. et al. Phosphorescent iridium(III)-bis-N-heterocyclic carbene complexes as mitochondria-targeted theranostic and photodynamic anticancer agents. Biomaterials 39, 95–104 (2015). [DOI] [PubMed] [Google Scholar]
- Zhang K. Y. & Lo K. K. W. Synthesis, properties, and live-cell imaging studies of luminescent cyclometalated iridium(III) polypyridine complexes containing two or three biotin pendants. Inorg. Chem. 48, 6011–6025 (2009). [DOI] [PubMed] [Google Scholar]
- Sorkin A. & von Zastrow M. Endocytosis and signalling: intertwining molecular networks. Nat. Rev. Mol. Cell Biol. 10, 609–622 (2009). [DOI] [PMC free article] [PubMed] [Google Scholar]
- Gratton S. E. A. et al. The effect of particle design on cellular internalization pathways. Proc. Natl Acad. Sci. USA 105, 11613–11618 (2008). [DOI] [PMC free article] [PubMed] [Google Scholar]
- Cartiera M. S., Johnson K. M., Rajendran V., Caplan M. J. & Saltzman W. M. The uptake and intracellular fate of PLGA nanoparticles in epithelial cells. Biomaterials 30, 2790–2798 (2009). [DOI] [PMC free article] [PubMed] [Google Scholar]
- Heller I. et al. Identifying the mechanism of biosensing with carbon nanotube transistors. Nano Lett. 8, 591–595 (2008). [DOI] [PubMed] [Google Scholar]
- Zhao Q., Huang C. & Li F. Phosphorescent heavy-metal complexes for bioimaging. Chem. Soc. Rev. 40, 2508–24 (2011). [DOI] [PubMed] [Google Scholar]
- Chen Y. et al. Ratiometric detection of pH fluctuation in mitochondria with a new fluorescein/cyanine hybrid sensor. Chem. Sci. 6, 3187–3194 (2015). [DOI] [PMC free article] [PubMed] [Google Scholar]
- Fernandez-Moreira V., Thorp-Greenwood F. L. & Coogan M. P. Application of d6 transition metal complexes in fluorescence cell imaging. Chem. Commun. 46, 186–202 (2010). [DOI] [PubMed] [Google Scholar]
- Casey J. R., Grinstein S. & Orlowski J. Sensors and regulators of intracellular pH. Nat. Rev. Mol. Cell Biol. 11, 50–61 (2010). [DOI] [PubMed] [Google Scholar]
- Twig G. et al. Fission and selective fusion govern mitochondrial segregation and elimination by autophagy. EMBO J. 27, 433–446 (2008). [DOI] [PMC free article] [PubMed] [Google Scholar]
- Narendra D., Tanaka A., Suen D.-F. & Youle R. J. Parkin is recruited selectively to impaired mitochondria and promotes their autophagy. J. Cell Biol. 183, 795–803 (2008). [DOI] [PMC free article] [PubMed] [Google Scholar]
- Wang Y., Nartiss Y., Steipe B., McQuibban G. A. & Kim P. K. ROS-induced mitochondrial depolarization initiates PARK2/PARKIN-dependent mitochondrial degradation by autophagy. Autophagy 8, 1462–1476 (2012). [DOI] [PubMed] [Google Scholar]
- Ding W.-X. et al. Nix Is critical to two distinct phases of mitophagy, reactive oxygen species-mediated autophagy induction and parkin-ubiquitin-p62-mediated mitochondrial priming. J. Biol. Chem. 285, 27879–27890 (2010). [DOI] [PMC free article] [PubMed] [Google Scholar]
- Padman B. S., Bach M., Lucarelli G., Prescott M. & Ramm G. The protonophore CCCP interferes with lysosomal degradation of autophagic cargo in yeast and mammalian cells. Autophagy 9, 1862–1875 (2013). [DOI] [PubMed] [Google Scholar]
- Rodriguez-Enriquez S., Kim I., Currin R. T. & Lemasters J. J. Tracker dyes to probe mitochondrial autophagy (mitophagy) in rat hepatocytes. Autophagy 2, 39–46 (2006). [DOI] [PMC free article] [PubMed] [Google Scholar]
- Yamada M., Tanaka Y., Yoshimato Y., Kuroda S. & Shimao I. Synthesis and properties of diamino-substituted dipyrido[3,2-a:2′,3′-c]phenazine. Bull. Chem. Soc. Jpn. 65, 1006–1011 (1992). [Google Scholar]
- Nonoyama M. Benzo[H]quinolin-10-yl-N iridium (III) complexes. Bull. Chem. Soc. Jpn. 47, 767–768 (1974). [Google Scholar]
- Klionsky D. J. et al. Guidelines for the use and interpretation of assays for monitoring autophagy. Autophagy 8, 445–544 (2012). [DOI] [PMC free article] [PubMed] [Google Scholar]
Associated Data
This section collects any data citations, data availability statements, or supplementary materials included in this article.


