

Abstract
Background
Delayed or secondary cell death that is caused by a cascade of cellular and molecular processes initiated by traumatic brain injury (TBI) may be reduced or prevented if an effective neuroprotective strategy is employed. Microarray and subsequent bioinformatic analyses were used to determine which genes, pathways and networks were significantly altered 24 h after unilateral TBI in the rat. Ipsilateral hemi-brain, the corresponding contralateral hemi-brain, and naïve (control) brain tissue were used for microarray analysis.
Results
Ingenuity Pathway Analysis showed cell death and survival (CD) to be a top molecular and cellular function associated with TBI on both sides of the brain. One major finding was that the overall gene expression pattern suggested an increase in CD genes in ipsilateral brain tissue and suppression of CD genes contralateral to the injury which may indicate an endogenous protective mechanism. We created networks of genes of interest (GOI) and ranked the genes by the number of direct connections each had in the GOI networks, creating gene interaction hierarchies (GIHs). Cell cycle was determined from the resultant GIHs to be a significant molecular and cellular function in post-TBI CD gene response.
Conclusions
Cell cycle and apoptosis signalling genes that were highly ranked in the GIHs and exhibited either the inverse ipsilateral/contralateral expression pattern or contralateral suppression were identified and included STAT3, CCND1, CCND2, and BAX. Additional exploration into the remote suppression of CD genes may provide insight into neuroprotective mechanisms that could be used to develop therapies to prevent cell death following TBI.
Electronic supplementary material
The online version of this article (doi:10.1186/s12864-016-2412-0) contains supplementary material, which is available to authorized users.
Keywords: Traumatic brain injury, Cell death, Microarray, Bioinformatics, Gene interaction hierarchy
Background
Traumatic brain injury (TBI) is a major public health problem in both the civilian and military populations as TBI has now become a prominent injury in war zones. Of the 1.7 million new TBIs that are sustained annually in the United States [1], 53,000 result in death [2] while an additional 125,000 leave the affected people with long-term behavioral deficits [3]. Overall, about 3 million Americans are currently suffering with chronic effects of TBI [4]. Additionally, it is estimated that 17–30 % of soldiers returning for Iraq and Afghanistan have suffered TBIs [5, 6]. Development of more effective clinical treatments is necessary to reduce the healthcare and financial burden of TBI. Such development requires basic experimentation into the mechanisms underlying TBI.
Primary damage to cells by TBI may be irreversible and lead to immediate cell death, however, delayed or secondary cell death that is caused by a cascade of cellular and molecular processes initiated by the trauma [7–10] may be reduced or prevented if an effective neuroprotective strategy is employed. Development of such a strategy requires an understanding of the molecular environment in the injured brain so that deleterious molecules and processes can be identified and inhibited. A step towards understanding the molecular response to TBI is examining gene expression profiles following the injury.
Microarray technology allows for examination of thousands of genes in one assay. The key to using this technology is interpreting the resulting gene expression patterns and using the interpreted data to guide further study. The development of advanced bioinformatic analysis tools have aided in deciphering microarray data. One such tool is the Ingenuity Pathway Analysis (IPA) software program which uses a database built from published scientific literature to draw direct and indirect interactions between genes and to assign genes to specific biological functions, canonical pathways, and networks [11]. IPA also features a strong network building component that allows for the creation and analysis of networks composed of any genes of interest (GOI). We have previously devised a method for using the initial information that IPA provides and subsequent network analysis to determine which genes are most significant to the inflammatory response following neuronal injury unilateral controlled cortical impact (CCI) in the rat [12]. This analysis results in a gene interaction hierarchy (GIH) where genes of interest are ranked based on the number of interactions they have with each other. The theory behind the analysis is that a gene that interacts with more genes in a particular set of genes has the potential to influence that set of genes the most.
The current study uses gene expression profiling and bioinformatic analysis to examine the cell death gene response 24 h following unilateral CCI. One significant finding of our previous study was that while inflammatory gene expression was induced on the ipsilateral side of the brain following TBI, there was a suppression of inflammatory genes contralateral to the injury [12]. We believe that this endogenous anti-inflammatory response may hold clues for the development of anti-inflammatory treatments for TBI and other acute brain injuries. Inflammation resulting from many different types of acute brain injuries, including TBI and ischemic stroke, has been linked to subsequent neuronal cell death [13–16]. By extension, we believe that understanding the post-TBI expression of genes involved in acute cell death will provide clues for the development of neuroprotective strategies.
Methods
Animals
All animals used in these studies were treated humanely and with regard for alleviation of suffering and pain and all protocols involving animals were approved by the IACUCs of Morehouse School of Medicine and/or The Georgia Institute of Technology prior to the initiation of experimentation. Adult male Sprague–Dawley rats (290–300 g; Charles River Laboratories International, Inc., USA) were housed individually in standard plastic cages in a temperature-controlled room (22 ± 2 °C) on a 12 h reverse light–dark cycle. Food and water were provided ad libitum.
Controlled cortical impact
Under isoflurane anesthesia, rats received a unilateral controlled cortical impact (CCI/TBI) using the Pittsburgh Precision Instruments, Inc. device. A craniotomy was made with the center 4 mm posterior and 3–4 mm lateral to bregma using a 6 mm diameter trephan drill bit. The impact was done at an angle of 15° from vertical with a velocity of 3 m/s to a depth of 2 mm using a 5 mm diameter impact tip. These parameters were chosen to produce a moderate injury [17]. The rats were sacrificed 24 h post-injury and the brains were removed for RNA isolation or histology.
RNA preparation and GeneChip analysis
The ipsilateral hemi-brain tissue at the site of the injury, the corresponding contralateral hemi-brain tissue, and naïve (control) brain tissue (n = 3 for each) were used for RNA isolation. Total RNA was extracted with TRIzol Reagent (Life Technologies, Rockville, MD, USA) and cleaned (RNAqueous Kit, Ambion, Austin, TX, USA). The RNA was prepared for microarray hybridization with the GeneChip® 3′ IVT Express Kit (Affymetrix Inc., Santa Clara, CA, USA) aRNA amplification procedure. Briefly, total RNA was reverse transcribed to synthesize first-strand cDNA containing a T7 promoter sequence. The single-stranded cDNA was converted into a double-stranded DNA template for transcription. The reaction employed DNA polymerase and RNase H to simultaneously degrade the RNA and synthesize second-strand cDNA. In vitro transcription generated multiple copies of biotin-modified aRNA from the double-stranded cDNA templates (this was the amplification step). aRNA Purification removed unincorporated NTPs, salts, enzymes, and inorganic phosphate to improve the stability of the biotin-modified aRNA. Finally, the labeled aRNA was fragmented to prepare the sample for hybridization to GeneChip® 3′ expression arrays [18]. Following fragmentation, 15 μg of the biotinylated cRNA was hybridized to an Affymetrix Rat Genome 230 2.0 GeneChip. The chips were hybridized at 45 °C for 16 h, and then washed, stained with streptavidin–phycoerythrin and scanned according to manufacturing guidelines.
Microarray data analysis
Data analysis was performed using Affymetrix Expression Console™ software that supports probe set summarization and CHP file generation of 3′ expression using the MAS5 Statistical algorithm. Affymetrix microarrays contain the hybridization, labeling and housekeeping controls that help determine the success of the hybridizations. The Affymetrix Expression Analysis algorithm uses the Tukey’s biweight estimator to provide a robust mean Signal value and the Wilcoxon’s rank test to calculate a significance or p-value and Detection call (present, marginal or absent) for each probe set. The Detection p-value is calculated using a Discrimination Score [R] for all probes. The Discrimination Score is a basic property of a probe pair that describes its ability to detect its intended target. It measures the target-specific intensity differences of the probe pair (perfect match (PM) – mismatch (MM)) relative to its overall hybridization intensity (PM + MM). Background estimation is provided by a weighted average of the lowest 2 % of the feature intensities. Mismatch probes are utilized to adjust the perfect match (PM) intensity. Linear scaling of the feature level intensity values, using the trimmed mean, is the default to make the means equal for all arrays being analyzed. False-negative and false-positive rates are minimized by subtracting nonspecific signal from the PM probe intensities and performing an intensity-dependent normalization at the probe set level. Three chips were used for each experimental group: ipsilateral, contralateral and naïve control. The dataset produced by the Affymetrix software contains gene identifiers, corresponding expression values, and determination of whether genes are confirmed as present, marginal or absent. Previous principle component analysis of the raw datasets demonstrated that ipsilateral, contralateral and naïve clustered together by injury status and each group was well isolated from the other two groups [12]. The data were analyzed in Microsoft Excel for calculation of fold change and whether the genes were confirmed as present in the tissue sample. Genes in the injured brain that increased or decreased in expression by 2-fold or more compared to controls and were present in either all 3 ipsilateral samples or all 3 contralateral samples were identified. The gene datasets that were generated were ipsilateral vs. naïve (TBI-I) and contralateral vs. naïve (TBI-C) fold changes.
Ingenuity pathway analysis
The gene datasets were analyzed between December 3, 2014 and January 8, 2015 using Ingenuity Pathway Analysis (Ingenuity® Systems, www.ingenuity.com) and overlaid onto a global molecular network developed from information contained in the Ingenuity Knowledge Base. The right-tailed Fisher’s Exact Test was used to determine the likelihood that the association between a set of experimental genes and a given biological function or pathway is not due to random chance [19]. In general, p-values less than 0.05 indicate a statistically significant, non-random association. The functions, canonical pathways, and gene networks that were most significant to the dataset were identified. Gene expression profiles were overlaid on the canonical pathway and gene network figures to reveal similarities and dissimilarities in their gene expression patterns. Gene networks were also created using Ingenuity Knowledge Base to further understand specific interactions between our genes of interest.
TBI-I/TBI-C ratio
We used the following formulas to calculate the ratio of TBI-I to TBI-C fold changes: (1) Gene increased on both sides (TBI-I > TBI-C): ratio = (TBI-I)/(TBI-C); (2) Gene decreased on both sides (TBI-I > TBI-C): ratio = 1/[(TBI-I)/(TBI-C)]; (3) Gene decreased on both sides (TBI-I < TBI-C): ratio = −1/[(TBI-C)/(TBI-I)]; (4) Gene increased ipsilaterally and decreased contralaterally: ratio = (TBI-I)/-[1/(TBI-C)]; (5) Gene decreased ipsilaterally and increased contralaterally: ratio = (TBI-C)/[1/(TBI-I)].
Histology
At 24 h post injury, rats were anesthetized with an intraperitoneal injection of a ketamine:xylazine:acetylpromazine cocktail (50:10:1.67 mg/kg respectively) and perfused transcardially with saline followed by cold 4 % paraformaldehyde solution in PBS for 30 min. Brains were quickly removed and cryoprotected in 30 % sucrose. The brains were then frozen in OCT mounting medium and stored until sectioning. Coronal sections of 20 μm thickness were cryosectioned from the perilesional brain area of each animal. Sections were mounted on slides which were stored at −80 °C until further processed. Fluoro-Jade® B (AG310, Millipore, Billerica, MA) labeling was performed as previously described [20]. TUNEL staining was performed using the TUNEL reaction mixture from the In Situ Cell Death Detection Kit, TMR red (12 156 792 910, Roche Diagnostics, Mannheim, Germany). Briefly, slide-mounted sections were post-fixed with 4 % paraformaldehyde for 15 min followed by a 10 min incubation in a 20 μg/mL proteinase K solution in 100 mM Tris HCl (pH 8.0) and 50 mM EDTA. The sections were then incubated for 60 min at 37 °C in the TUNEL reaction mixture. Phosphate buffered saline was used to rinse the sections after each step. A Zeiss fluorescence microscope equipped with a CCD camera (Carl Zeiss Microimaging, Inc., Thornwood, NY) was used to capture digital images of the sections.
Real-time polymerase chain reaction (PCR)
RNA was extracted as above and quantified using the Nanodrop 2000c (Thermo Scientific, Waltham, MA). Equal amounts of ipsilateral, contralateral, and naïve RNA (n = 2 for each) were converted to cDNA using the iScript™ Reverse Transcription Supermix for RT-qPCR (170–8840, Bio-Rad Laboratories, Inc., Hercules, CA). The resulting product was diluted 1:100 with RNase-free sterile water. The diluted product was used in the real-time PCR analysis using the Quantitect SYBR® Green PCR Kit (204143, Qiagen, Hilden, Germany), custom oligo primers for SPP1, HSPB1, STAT3, CCND1, and GAPDH (reference gene) (Life Technologies, Rockville, MD), and a Bio-Rad CFX96™ Real-Time System mounted on a C1000™ Thermal Cycler. All steps were carried out according to manufacturer’s protocols. The real-time PCR results were analyzed using the ΔΔCt method where ΔCt1 = Ct (Target A‐exp) – Ct (GAPDH-exp); ΔCt2 = Ct (Target A‐naïve) –Ct (GAPDH‐naïve); and ΔΔCt = ΔCt1 – ΔCt2. The normalized target gene expression level was given by 2-ΔΔCt. The results were compared pairwise using a one-tail T-test assuming equal variance. Differences were considered significant when p < 0.05.
Results
Functional analysis
To begin understanding the cell death gene response following TBI, we first looked at the biological functions associated with our datasets. Analysis of the top 15 molecular and cellular functions associated with the TBI-I (ipsilateral vs. naïve) and TBI-C (contralateral vs. naïve) datasets in IPA showed that cell death and survival (CD) was the second ranked TBI-I function that is also ranked in the top 7 functions for TBI-C (Fig. 1a, b). Also ranked in the top 7 molecular and cellular functions for both datasets are cellular growth and proliferation, cellular assembly and organization, cellular function and maintenance, cellular development, and cell morphology. Cellular movement and cell-to-cell signaling and interaction are ranked in the top 7 only for TBI-I and TBI-C, respectively.
Fig. 1.

Overall functional analysis. Analysis of the top 15 molecular and cellular functions determined by IPA for the TBI-I (ipsilateral vs. naïve) dataset (a) and the TBI-C (contralateral vs. naïve) dataset (b) showed that cell death and survival was a top ranked function on both sides of the brain
Histology
To examine cell death histologically, we chose to look at the cortical area adjacent to the impact site so we could observe the cellular response to the injury in all layers of the cortex. This is not possible at the impact site because of the resulting injury cavity. Fluoro-Jade® B (FJB) staining showed a dense distribution of damaged neurons throughout all layers of the cortex near the sight of impact (Fig. 2a, b). Damaged neurons were also detected in the hippocampus ipsilateral to the injury (Fig. 2d). These neurons were sparsely distributed in the hippocampal CA regions. No FJB staining was detected in the cortex (Fig. 2c) or hippocampus (Fig. 2e) contralateral to the injury.
Fig. 2.
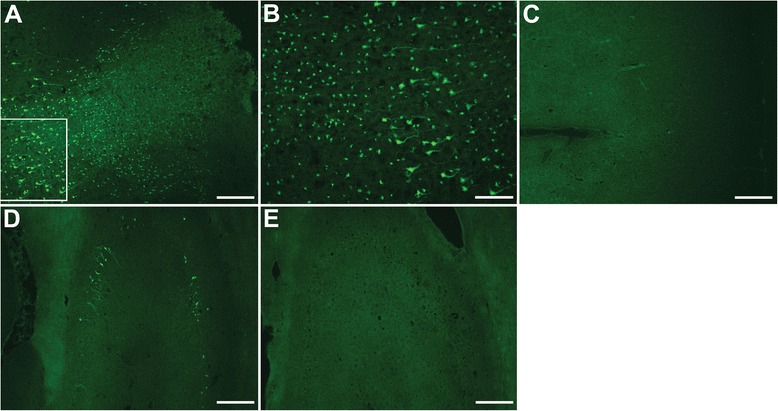
Fluoro-Jade® B staining of the cortex and hippocampus. Fluoro-Jade® B (FJB) staining showed a dense distribution of damaged neurons throughout all layers of the cortex near the sight of impact (a, b). Damaged neurons were also detected in the hippocampus ipsilateral to the injury (d). These neurons were sparsely distributed in the hippocampal CA regions. No FJB staining was detected in either brain region contralateral to the injury (C: cortex; E: hippocampus). FJB: green; Scale bars: 200 μm ( a , c - e ), 100 μm ( b )
TUNEL staining showed distribution of injured cells in the cortex similar to FJB as they were distributed throughout all layers of the cortex (Fig. 3a, b). However, no TUNEL staining was detected in the ipsilateral hippocampus (Fig. 3d), suggesting that the neuronal damage in that region had not yet progressed to apoptosis. No TUNEL was observed in the contralateral cortex (Fig. 3c) or hippocampus (Fig. 3e).
Fig. 3.
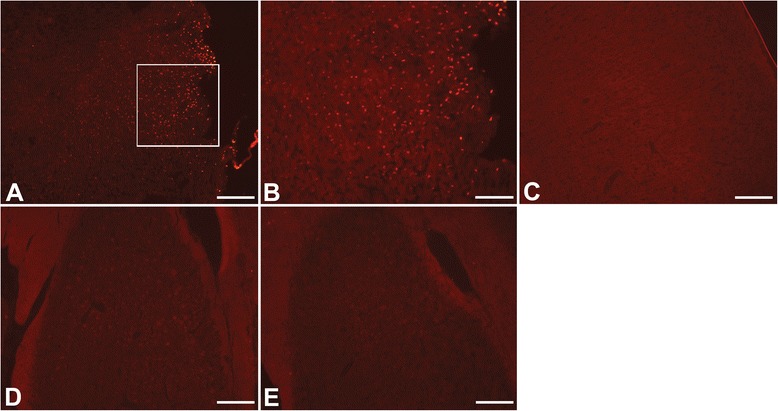
TUNEL staining of the cortex and hippocampus. TUNEL staining showed distribution of injured cells in the cortex similar to FJB as they were distributed throughout all layers of the cortex (a, b). However, no TUNEL staining was detected in the ipsilateral hippocampus (d). No TUNEL was observed on the contralateral side of the brain (C: cortex; E: hippocampus). TUNEL: red; Scale bars: 200 μm ( a , c - e ), 100 μm ( b )
Cell death gene expression patterns
Focusing on the CD genes in our datasets, we determined that 902 CD genes had a greater than 2-fold change in expression. Of these genes, 361 CD genes changed uniquely on the ipsilateral side of the brain. 317 of those genes (88 %) increased while 44 genes (12 %) decreased in expression (Fig. 4a). 136 CD genes changed uniquely on the contralateral side of the brain and, in contrast to what we observed on the ipsilateral side, only 34 genes (25 %) increased while 102 genes (75 %) decreased in expression (Fig. 4b).
Fig. 4.
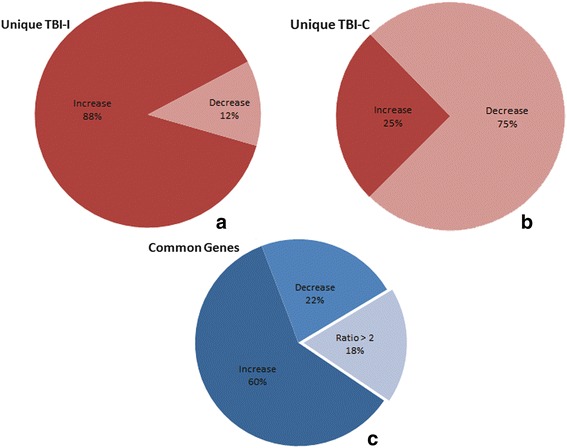
Breakdown of CD genes based on increased and decreased expression. a 361 CD genes changed uniquely on the ipsilateral side of the brain and 88 % (317 genes) of those increased in expression. b 136 CD genes changed uniquely on the contralateral side of the brain and 75 % (102 genes) of those decreased in expression. c There were 405 genes that changed more than 2-fold on both sides of the brain. Eighty-two percent of them (332 genes) changed similarly while the remaining 18 % (73 genes) changed differently (TBI-I/TBI-C ratio >2; see text)
There were 405 CD genes that changed on both the ipsilateral and contralateral sides of the brain. In order to determine whether these common genes changed differently on one side of the brain compared to the other, we calculated the ratio of the TBI-I fold change to the TBI-C fold change. Those genes that had a TBI-I/TBI-C ratio greater than 2 were determined to have changed differently. We observed that 332 of the common CD genes (82 %) changed similarly (TBI-I/TBI-C ratio < 2; Fig. 4c). Of the genes that changed similarly, 242 genes (60 %) increased in expression and 90 genes (22 %) decreased in expression. The remaining 73 common CD genes (18 %) changed differently (TBI-I/TBI-C ratio > 2) (Fig. 4c). Table 1 shows the 73 common CD genes that changed differently. These genes span all cellular compartments (extracellular space, plasma membrane, cytoplasm, and nucleus) with diverse molecule types. The expression of all these genes was lower on the contralateral side of the brain with the exception of 3 genes, DNAJB6, TRIM54 and PSIP1 (negative TBI-I/TBI-C ratio). Because of their different expression patterns, these 73 genes became our first group of genes of interest (GOI; Table 1). Notable genes given their high TBI-I/TBI-C ratio included SPP1, TIMP1, LCN2, SERPINA3, KCNN4, HSPB1, RDX, Slpi, ATRX, DNAJB6, NAA15, SMARCA4, STAT3, and THOC2.
Table 1.
Genes that change differently on each side of the brain
| Gene symbol | Entrez gene name | TBI-I fold change | TBI-C fold change | TBI-I/TBI-C ratio | Molecular type |
|---|---|---|---|---|---|
| Extracellular Space | |||||
| SPP1 | secreted phosphoprotein 1 | 37.905 | 2.370 | 15.994 | cytokine |
| TIMP1 | TIMP metallopeptidase inhibitor 1 | 38.486 | 2.101 | 18.318 | cytokine |
| CP | ceruloplasmin (ferroxidase) | 27.838 | 8.477 | 3.284 | enzyme |
| FGL2 | fibrinogen-like 2 | 16.793 | 4.017 | 4.180 | peptidase |
| LCN2 | lipocalin 2 | 71.824 | 3.895 | 18.440 | transporter |
| SERPINA3 | serpin peptidase inhibitor, clade A (alpha-1 antiproteinase, antitrypsin), member 3 | 58.488 | 2.509 | 23.311 | other |
| Plasma Membrane | |||||
| CD44 | CD44 molecule (Indian blood group) | 15.558 | 2.399 | 6.485 | enzyme |
| EHD4 | EH-domain containing 4 | 2.361 | −2.056 | 4.854 | enzyme |
| SDC1 | syndecan 1 | 13.681 | 2.566 | 5.332 | enzyme |
| KCND2 | potassium voltage-gated channel, Shal-related subfamily, member 2 | −2.792 | −7.585 | 2.717 | ion channel |
| KCNN4 | potassium intermediate/small conductance calcium-activated channel, subfamily N, member 4 | 3.088 | −9.429 | 29.117 | ion channel |
| CAMK2N1 | calcium/calmodulin-dependent protein kinase II inhibitor 1 | −11.813 | −23.824 | 2.017 | kinase |
| EGFR | epidermal growth factor receptor | 6.773 | 2.374 | 2.853 | kinase |
| PTPRF | protein tyrosine phosphatase, receptor type, F | −6.365 | −20.492 | 3.219 | phosphatase |
| IL6ST | interleukin 6 signal transducer | 2.307 | −3.283 | 7.574 | transmembrane receptor |
| CD68 | CD68 molecule | 4.365 | 2.007 | 2.175 | other |
| HLA-A | major histocompatibility complex, class I, A | 9.296 | 3.657 | 2.542 | other |
| PMEPA1 | prostate transmembrane protein, androgen induced 1 | 2.682 | −2.937 | 7.877 | other |
| Cytoplasm | |||||
| CYP1B1 | cytochrome P450, family 1, subfamily B, polypeptide 1 | 10.998 | 4.808 | 2.287 | enzyme |
| KIF3A | kinesin family member 3A | −5.083 | −11.754 | 2.312 | enzyme |
| MX1 | MX dynamin-like GTPase 1 | 28.177 | 7.326 | 3.846 | enzyme |
| PDE4B | phosphodiesterase 4B, cAMP-specific | 5.602 | 2.359 | 2.375 | enzyme |
| RND3 | Rho family GTPase 3 | 2.864 | −2.971 | 8.509 | enzyme |
| SRXN1 | sulfiredoxin 1 | 6.306 | 2.402 | 2.625 | enzyme |
| CARD11 | caspase recruitment domain family, member 11 | 7.343 | 2.892 | 2.539 | kinase |
| CSNK2A1 | casein kinase 2, alpha 1 polypeptide | 2.992 | −2.750 | 8.228 | kinase |
| EIF5B | eukaryotic translation initiation factor 5B | −3.044 | −8.766 | 2.880 | translation regulator |
| RASA1 | RAS p21 protein activator (GTPase activating protein) 1 | 2.392 | −2.105 | 5.035 | transporter |
| AHI1 | Abelson helper integration site 1 | 2.243 | −2.897 | 6.498 | other |
| CISD2 | CDGSH iron sulfur domain 2 | −7.833 | −19.012 | 2.427 | other |
| CMIP | c-Maf inducing protein | −3.778 | −13.763 | 3.643 | other |
| Ctdspl | CTD (carboxy-terminal domain, RNA polymerase II, polypeptide A) small phosphatase-like | −7.271 | −36.886 | 5.073 | other |
| HSPB1 | heat shock 27 kDa protein 1 | 46.922 | 2.639 | 17.780 | other |
| KIFAP3 | kinesin-associated protein 3 | −2.281 | −7.831 | 3.433 | other |
| LCP1 | lymphocyte cytosolic protein 1 (L-plastin) | 6.082 | 2.799 | 2.173 | other |
| LSP1 | lymphocyte-specific protein 1 | 11.716 | 2.140 | 5.475 | other |
| PHLDA1 | pleckstrin homology-like domain, family A, member 1 | 5.129 | 2.160 | 2.375 | other |
| RDX | radixin | 4.828 | −5.274 | 25.463 | other |
| Slpi | secretory leukocyte peptidase inhibitor | 82.908 | 3.119 | 26.582 | other |
| Tpm3 | tropomyosin 3 | 2.592 | −2.715 | 7.037 | other |
| TRIM54 | tripartite motif containing 54 | −4.426 | −2.032 | −2.178 | other |
| Nucleus | |||||
| SETD8 | SET domain containing (lysine methyltransferase) 8 | 2.029 | −3.930 | 7.974 | enzyme |
| TOP2A | topoisomerase (DNA) II alpha 170 kDa | 2.260 | −2.406 | 5.438 | enzyme |
| CDK11A | cyclin-dependent kinase 11A | −4.290 | −14.872 | 3.467 | kinase |
| GSK3B | glycogen synthase kinase 3 beta | −2.733 | −6.635 | 2.428 | kinase |
| SRPK2 | SRSF protein kinase 2 | −5.614 | −23.589 | 4.202 | kinase |
| THRA | thyroid hormone receptor, alpha | −2.799 | −11.518 | 4.115 | ligand-dependent nuclear receptor |
| ATRX | alpha thalassemia/mental retardation syndrome X-linked | 2.091 | −5.964 | 12.471 | transcription regulator |
| BTG2 | BTG family, member 2 | −2.220 | −5.803 | 2.614 | transcription regulator |
| CCAR1 | cell division cycle and apoptosis regulator 1 | −2.943 | −11.648 | 3.958 | transcription regulator |
| CCND1 | cyclin D1 | 2.152 | −2.027 | 4.362 | transcription regulator |
| CEBPD | CCAAT/enhancer binding protein (C/EBP), delta | 11.271 | 2.037 | 5.533 | transcription regulator |
| DEK | DEK proto-oncogene | −3.006 | −7.352 | 2.446 | transcription regulator |
| DNAJB6 | DnaJ (Hsp40) homolog, subfamily B, member 6 | −4.383 | 5.614 | −24.606 | transcription regulator |
| KLF13 | Kruppel-like factor 13 | −2.006 | −4.582 | 2.284 | transcription regulator |
| KLF6 | Kruppel-like factor 6 | 6.003 | 2.865 | 2.095 | transcription regulator |
| NAA15 | N(alpha)-acetyltransferase 15, NatA auxiliary subunit | 3.605 | −3.751 | 13.522 | transcription regulator |
| NFIX | nuclear factor I/X (CCAAT-binding transcription factor) | −2.548 | −8.112 | 3.184 | transcription regulator |
| PA2G4 | proliferation-associated 2G4, 38 kDa | −2.702 | −5.783 | 2.140 | transcription regulator |
| SMARCA4 | SWI/SNF related, matrix associated, actin dependent regulator of chromatin, subfamily a, member 4 | 2.521 | −7.712 | 19.442 | transcription regulator |
| STAT3 | signal transducer and activator of transcription 3 (acute-phase response factor) | 4.219 | −3.771 | 15.910 | transcription regulator |
| TBL1XR1 | transducin (beta)-like 1 X-linked receptor 1 | 2.587 | −2.134 | 5.521 | transcription regulator |
| TCF4 | transcription factor 4 | −2.216 | −4.625 | 2.087 | transcription regulator |
| TPR | translocated promoter region, nuclear basket protein | 2.212 | −2.728 | 6.034 | transporter |
| Brd4 | bromodomain containing 4 | −3.528 | −15.202 | 4.309 | other |
| CDT1 | chromatin licensing and DNA replication factor 1 | 3.098 | −2.295 | 7.110 | other |
| GADD45G | growth arrest and DNA-damage-inducible, gamma | 3.191 | −2.384 | 7.607 | other |
| PSIP1 | PC4 and SFRS1 interacting protein 1 | −2.663 | 2.113 | −5.627 | other |
| Rbm25 | RNA binding motif protein 25 | −5.547 | −16.213 | 2.923 | other |
| THOC2 | THO complex 2 | 2.119 | −4.886 | 10.353 | other |
| Unknown | |||||
| EIF3C | eukaryotic translation initiation factor 3, subunit C | −4.369 | −9.072 | 2.076 | translation regulator |
| Nos1ap | nitric oxide synthase 1 (neuronal) adaptor protein | −2.698 | −5.717 | 2.119 | other |
| RASSF4 | Ras association (RalGDS/AF-6) domain family member 4 | 4.289 | 2.106 | 2.037 | other |
TBI-I/TBI-C Ratio: Gene increased on both sides (TBI-I > TBI-C): ratio = (TBI-I)/(TBI-C); Gene decreased on both sides (TBI-I > TBI-C): ratio = 1/[(TBI-I)/(TBI-C)]; Gene decreased on both sides (TBI-I < TBI-C): ratio = −1/[(TBI-C)/(TBI-I)]; Gene increased ipsilaterally and decreased contralaterally: ratio = (TBI-I)/-[1/(TBI-C)]; Gene decreased ipsilaterally and increased contralaterally: ratio = (TBI-C)/[1/(TBI-I)]
Canonical pathway analysis
We used canonical pathway and network analysis in IPA to identify genes in our datasets that were potentially most relevant to the observed CD gene response. We defined potential GOI, in this context, as those genes that either changed in expression uniquely on one side of the brain, or were one of the 73 common genes that changed differently (Table 1). GOI were identified by comparing the genes in the canonical pathway and gene networks to the list of unique TBI-I or TBI-C CD genes with the genes from Table 1 added to each list and identifying the overlapping genes. Canonical pathways in IPA are well-characterized metabolic and cell signaling pathways derived from information found in specific journal articles, review articles, text books, and KEGG Ligand [21]. Fig. 5 shows the apoptosis signaling canonical pathway with all relevant gene families, groups and complexes expanded to show the member genes. This pathway was chosen because apoptosis is a key process in cell death following TBI [22–24]. By overlaying the relative expression values of potential GOI for TBI-I (Fig. 5a) and TBI-C (Fig. 5b), we were able to identify 9 GOI that were increased (BCL2A1 (Bfl-1 in pathway), CASP3, CASP7, CDK1 (Cdc2), IKBKB, MAP4K4, MCL1, NFKB2, and TNFRSF1A) in the TBI-I dataset, 3 GOI that decreased (ACIN1 (Acinus), BAX and KRAS) and 1 GOI that increased (MAPK8 (JNK1)) in the TBI-C dataset.
Fig. 5.
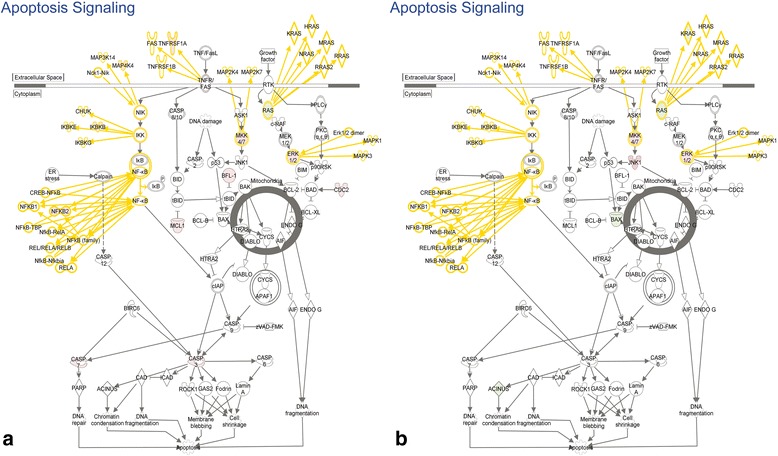
Canonical pathway analysis. The apoptosis signaling pathway with all gene families, groups and complexes expanded to show the member genes and showing the relative expression values of potential GOI for TBI-I (a) and TBI-C (b) included in this pathway. red: relative increase in expression; green: relative decrease in expression; white: no change in expression; gold connections and outlines: expansion of gene families, groups and complexes in the original pathway
Gene network analysis
In contrast to canonical pathways, which are relatively immutable in IPA, gene networks are generated de novo in IPA based on the list of genes that are imported. IPA takes “seed” molecules from the gene list, searches the Ingenuity Knowledge Base, and uses a network algorithm to draw connections between molecules based on biological function [25]. In order to generate the networks, we performed an IPA core analysis on the TBI-I and TBI-C CD datasets. IPA scores the networks in order to rank them according to their degree of relevance to the network eligible molecules in the dataset [25]. The top 6 scoring networks for each dataset were used to identify GOI.
Five of the top 6 networks for TBI-I and all 6 networks for TBI-C have cell death and survival as their top associated biological function (Tables 2 and 3). Only TBI-I network 4 does not have cell death and survival as one of the top 3 associated biological functions. Figure 6 shows networks 2 and 4 (Table 2) as examples of the TBI-I analysis. Figure 7 shows networks 2 and 4 (Table 3) as examples of the TBI-C analysis. (The other networks are available as supplemental materials (Additional files 1 and 2).) Like the canonical pathway analysis, all relevant gene families, groups and complexes were expanded to show the member genes. The relative TBI-I (Fig. 6) and TBI-C (Fig. 7) gene expression values of potential GOI were overlaid on these networks and additional GOI were identified. Tables 4 and 5 show the resulting GOI that were identified through this analysis. For TBI-I, a total of 110 GOI were found in these networks, 22 of which were previously identified (Table 4). Thus, 88 additional GOI were identified for TBI-I. For TBI-C, 38 additional GOI were identified as 28 of the 66 GOI found had been previously identified (Table 5). The most prevalent molecular types for TBI-I were transcription regulators, unspecified enzymes, kinases, and undefined molecules. Kinases transcription regulators, unspecified enzymes, and undefined molecules were most prevalent in the TBI-C analysis.
Table 2.
The top 6 gene networks associated with the TBI-I dataset
| Network ID | Molecules in network | Score | Focus molecules | Top diseases and functions |
|---|---|---|---|---|
| 1 | CADM1, CALB1, CBFB, CDCA7L, CMIP, Cytochrome bc1, cytochrome-c oxidase, DAB2, DEDD, FGF9, FLNA, FYN, GCLC, GCLM, GFAP, GFRA1, ITGA6, JDP2, MAOA, MED14, MGEA5, NFE2L1, NFE2L2, NPTX1, NRP1, PDHA1, PDLIM7, RET, Rnr, RPS24, RTN4, SLC18A2, Sos, STK17B, TAF4B | 46 | 31 | Cell Death and Survival, Drug Metabolism, Molecular Transport |
| 2 | AMOT, ANXA1, API5, ATF3, ATG12, BAG3, CCNA2, Cdc2, CDK1, CDK2, CDKN1B, ETV5, FGFR3, FN1, GJA1, Hedgehog, LATS1, MCL1, MCM2, MCM8, MLLT4, MMS22L, NAA15, Patched, PIK3C2A, PKP2, PSMA7, RAB35, RPRM, SPIN1, TAGLN2, THOC2, TJP2, UNC5B, XPO1 | 46 | 32 | Cell Death and Survival, Cell Cycle, Reproductive System Development and Function |
| 3 | AHCTF1, AKAP12, amylase, BCL11A, CA4, CACNA1G, CCND1, CLCN7, CREB1, CREBBP, CSF1, CSRNP1, CTNNB1, DES, Histone h3, IKK (complex), ITPR2, KLF6, KPNB1, MITF, MTMR1, NFIX, PRKD3, PTGR1, RAI14, RNA polymerase II, RRM2, SENP2, SMAD4, SMARCA4, SUDS3, TBL1XR1, TGM2, THRA, ZBTB18 | 43 | 31 | Cell Death and Survival, Organismal Survival, Gene Expression |
| 4 | ABCA1, ALB, ALDH1A2, BTG2, Ccl2, Ccl7, CD36, CEBPB, chemokine, CREM, CXCL3, DUSP5, EGR2, FGF2, FGL2, FOSL1, FSH, Hmgb2 (includes others), HMOX1, IL1, IL12 (family), IL6R, ITGB2, KLF4, MAPK9, NEK6, NEK7, PDE4B, Pld, PRKCI, PTGS2, SPP1, THBD, TLR4, WNT5A | 42 | 30 | Cellular Movement, Hematological System Development and Function, Immune Cell Trafficking |
| 5 | ACSL5, AGTR2, AMFR, AVP, CAMK2N1, CAPRIN1, CHSY1, CUL5, DCK, ELAVL1, Endothelin, GMCL1, GNRH, Insulin, MAP4K4, MSI2, MTORC1, NEO1, OPA1, Proinsulin, PTGER3, Relaxin, RNF2, SLC2A3, SMAD7, STAG1, TACR1, TCEB3, TMEM123, TRAF6, WAPAL, WFS1, WTAP, ZMYM2, ZNF280B | 41 | 29 | Cell Death and Survival, Cardiovascular System Development and Function, Hereditary Disorder |
| 6 | 26 s Proteasome, ARL11, BCL2L1, CAMK1G, CAMK2D, CASP3, CAV1, CISD2, CLASP1, CLN5, DLG4, EN2, ENC1, Esr1-Esr1-estrogen-estrogen, FBXO9, G2E3, Hsp70, Hsp90, HSP90AB1, IDE, KIF1B, MDM2, PCDH15, PGR, PI4K2A, PRDM2, PSEN1, SGPL1, SNCA, SPTBN1, SRC (family), SRPK2, TMEM109, TRIM2, VPS41 | 40 | 30 | Cell Death and Survival, Cancer, Neurological Disease |
Bold= > Gene included in the dataset
Note: Some of the nodes in the original networks represent gene groups, complexes or families that, when expanded, contain more potential GOI
Table 3.
The top 6 gene networks associated with the TBI-C dataset
| Network ID | Molecules in network | Score | Focus molecules | Top diseases and functions |
|---|---|---|---|---|
| 1 | ACER2, ACIN1, ACVR1C, ALDH1A2, ARHGEF7, BCL11B, caspase, CBFB, CD38, CD44, CLCN3, CUL5, DPYD, EEF1A2, FGL2, Fibrinogen, ITGB1, MAP3K1, MAP3K8, MAPK8, MAPK9, MIF, MTDH, PAK1, PRDX6, Rac, RAD23B, SPARC, Srebp, TNKS2, TTLL1, VCL, WNT5A, ZBTB18, ZYX | 50 | 31 | Cell Death and Survival, Cellular Movement, Ophthalmic Disease |
| 2 | ABCA1, AURKAIP1, BRINP1, BTG2, CACNA1G, CAV1, CCND1, CDK2, DCK, GCLC, Histone h3, Histone h4, Insulin, IRAK1, KMT2A, LCN2, MAFG, MTMR1, P110, PIAS1, PPARGC1B, Pro-inflammatory Cytokine, Ras homolog, RBM5, RNA polymerase II, SBF1, SETD8, SLC18A2, SMARCA2, SOX2, STAT1, TRPM7, ZBTB7A, ZMYND11, ZNF148 | 44 | 28 | Cell Death and Survival, Gene Expression, Cellular Growth and Proliferation |
| 3 | ADNP, AHI1, ANKS1B, ARL6IP1, CDK11A, CXCL12, DNAJB6, ENC1, estrogen receptor, FBXO9, FBXW7, FGFR3, G2E3, Hdac, HSP, Hsp90, HSP90AA1, HSP90AB1, HSPB1, KLF9, KLF13, LINGO1, MED1, MED14, mediator, PA2G4, PGR, PPP3CB, RNF4, STUB1, THRA, TRAP/Media, TUFM, Ubiquitin, VPS41 | 43 | 28 | Cell Death and Survival, Post-Translational Modification, Protein Folding |
| 4 | A2M, ACACA, AKT2, ALDH1A1, Alp, AMPK, ATG12, ATP1A1, BSG, CA3, EIF5B, ENTPD5, FGF9, FGFR1, Focal adhesion kinase, FOXO1, KRAS, MAP1B, MEF2A, Mlc, NLK, NTRK3, PALLD, PDPK1, PITX2, PPP3R1, PRKAA1, PRKCD, PSMA7, RASSF4, RPS24, Serbp1, Sfk, STK17B, TAOK1 | 41 | 30 | Cell Death and Survival, Carbohydrate Metabolism, Cellular Development |
| 5 | ACAC, AP2B1, APAF1, APC-AXIN-GSK3β, ATP2A2, ATP2B1, ATP2B2, BAX, Ca2 ATPase, calpain, CAST, CDH13, Cytochrome bc1, cytochrome C, cytochrome-c oxidase, DDIT4, DNM1L, GBX2, glutathione peroxidase, GSK3B, ITSN1, KCND2, LMO4, MAFB, MAOA, MFN1, Mitochondrial complex 1, MTF2, NCS1, NDUFAB1, NFE2L1, OPA1, PACS2, PEX11B, PRKAA2 | 39 | 26 | Cell Death and Survival, Cell Cycle, Cellular Compromise |
| 6 | Ap1, ARHGAP1, ARL6IP5, CCDC86, CCND2, CEBPD, Cg, COL1A1, DACH1, FSH, Growth hormone, Gsk3, IGFBP3, Lh, MGEA5, NEO1, PDHA1, PPP2R1A, PRLR, PSIP1, PURA, RAB27A, RPRM, RSF1, SMAD4, SMAD7, Smad1/5/8, Smad2/3, SP1, SPP1, TAF4B, Tgf beta, TIMP1, TNRC6A, ZMYM2 | 39 | 26 | Cell Death and Survival, Tissue Development, Cellular Growth and Proliferation |
Bold= > Gene included in the dataset
Note: Some of the nodes in the original networks represent gene groups, complexes or families that, when expanded, contain more potential GOI
Fig. 6.
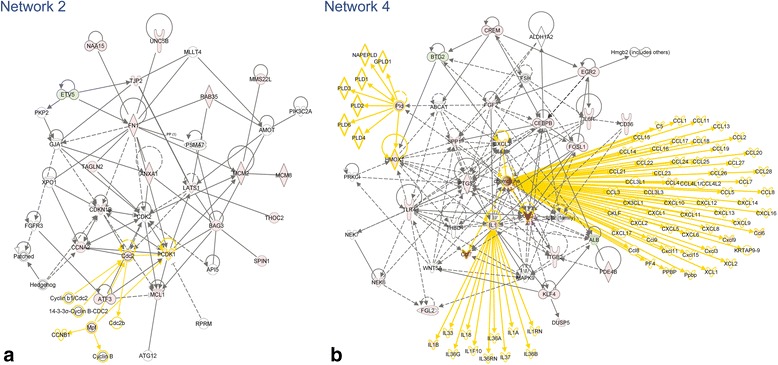
Examples of TBI-I networks. TBI-I CD networks 2 (a) and 4 (b) (see Table 2) with all gene families, groups and complexes expanded to show the member genes and showing the relative expression values of potential GOI for TBI-I. red: relative increase in expression; green: relative decrease in expression; white: no change in expression; gold connections and outlines: expansion of gene families, groups and complexes in the original network
Fig. 7.
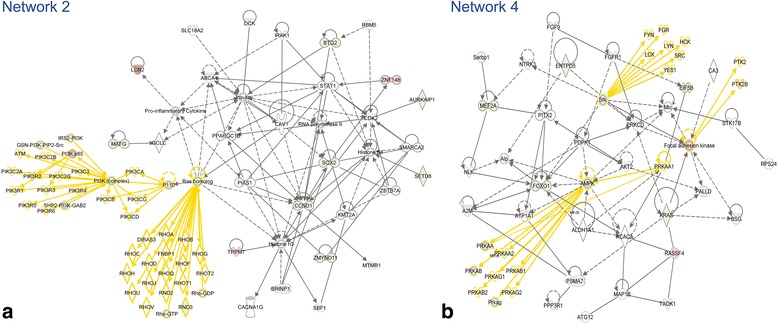
Examples of TBI-C networks. TBI-C CD networks 2 (a) and 4 (b) (see Table 3) with all gene families, groups and complexes expanded to show the member genes and showing the relative expression values of potential GOI for TBI-C. red: relative increase in expression; green: relative decrease in expression; white: no change in expression; gold connections and outlines: expansion of gene families, groups and complexes in the original network
Table 4.
Identification of genes of interest from TBI-I network analysis
| Network ID | GOI found | Total # of GOI | Overlap with previous analyses | Net # of GOI | Top molecular types |
|---|---|---|---|---|---|
| 1 | CALB1, CDCA7L, CMIP , DAB2, FLNA, GCLM, GFAP, NFE2L2, PDLIM7 | 9 | 1 | 8 | undefined |
| 2 | ANXA1, ATF3, BAG3, CCNA2, CDK1 , CDKN1B, ETV5, FN1, LATS1, MCL1 , MCM2, MCM8, MMS22L, NAA15 , RAB35, SPIN1, TAGLN2, THOC2 , TJP2, UNC5B | 20 | 4 | 16 | undefined, enzymes, and kinases |
| 3 | BCL11A, CCND1 , CREB1, CREBBP, CSRNP1, DES, IKBKB , ITPR2, KLF6 , KPNB1, MITF, NFIX , PTGR1, RAI14, RRM2, SENP2, SMARCA4 , SUDS3, TBL1XR1 , TGM2, THRA | 21 | 7 | 14 | transcription regulators and enzymes |
| 4 | ALB, BTG2 , Ccl2, CCL3L3, CCL4, Ccl6, Ccl7, CD36, CEBPB, CREM, CX3CL1, CXCL3, Cxcl9, DUSP5, EGR2, FGF2, FGL2 , FOSL1, HMOX1, IL1B, IL6R, ITGB2, KLF4, NEK6, PDE4B , PTGS2, SPP1 , TLR4 | 28 | 4 | 24 | cytokines, transcription regulators, and transmembrane receptors |
| 5 | ACSL5, CAMK2N1 , CHSY1, ELAVL1, MAP4K4 , MSI2, PTGER3, TCEB3, TMEM123, TRAF6, WFS1 | 11 | 2 | 9 | undefined and kinases |
| 6 | ARL11, CAMK1G, CASP3 , CISD2 , CLN5, DNAJB6, DNAJB9 , FGR, HCK, HSPA1A/HSPA1B, HSPA2, HSPA9, HSPB8, MDM2, PCDH15, PI4K2A, PRDM2, SGPL1, SNCA, SRPK2 , TMEM109 | 21 | 4 | 17 | undefined, kinases, and transcription regulators |
Italics= > gene of interest also found in a previous analysis; Bold= > GOI unique to this analysis
Table 5.
Identification of genes of interest from TBI-C network analysis
| Network ID | GOI found | Total # of GOI | Overlap with previous analyses | Net # of GOI | Top molecular types |
|---|---|---|---|---|---|
| 1 | ACIN1 , ACVR1C, CD44 , DPYD, FGL2 , MAPK8 , MTDH, RAD23B, TTLL1 | 9 | 4 | 5 | enzymes and kinases |
| 2 | AURKAIP1, BTG2 , CCND1 , LCN2 , MAFG, PIK3CD, PIK3R2, RND3 , SETD8 , SOX2, TRPM7, ZMYND11, ZNF148 | 13 | 5 | 8 | transcription regulators, kinases, and enzymes |
| 3 | AHI1 , CDK11A , CDK19, DNAJB6 , HSP90AA1, HSPB1 , KLF13 , LINGO1, MED1, PA2G4 , PPP3CB, THRA , TUFM | 13 | 7 | 6 | transcription regulators, undefined, and kinases |
| 4 | EIF5B , ENTPD5, FOXO1, KRAS , MEF2A, PALLD, PRKAA2, PTK2B, RASSF4 , Serbp | 10 | 3 | 7 | undefined, transcription regulators, enzymes, and kinases |
| 5 | ATP2A2, ATP2B2, BAX , CDH13, GBX2, GSK3B , KCND2 , MAFB, MFN1, NDUFAB1, PRKAA2 | 11 | 4 | 7 | transporters, kinases, enzymes, and undefined |
| 6 | CCDC86, CCND2, CEBPD , GSK3B , PRLR, PSIP1 , RSF1, SP1, SPP1 , TIMP1 | 10 | 5 | 5 | transcription regulators, undefined, and cytokines |
Italics= > gene of interest also found in a previous analysis; Bold= > GOI unique to this analysis
Compiling the gene interaction hierarchy (GIH)
TBI-I: By combining the GOI identified through canonical pathway and network analysis with those in Table 1, we identified a total of 170 GOI. In order to determine which genes might be most relevant to CD, we ranked these genes relative to each other by the number of direct interactions each had with the other GOI. Our analysis showed that 145 of the GOI formed an interconnected network, leaving 25 “orphan” genes (see Additional file 3). Genes having 1st order connections with more than 10 % of the other genes within the main GOI network (>14 connections) were considered “primary” in this analysis (see Fig. 8 for an example). Genes having connections with 5 %–10 % of the other genes (8–14 connections) were considered “secondary” (see Additional file 4 for an example) and those with connections with less than 5 % of the other genes (<8 connections) were considered “peripheral”. The resultant GIH is displayed in Table 6.
Fig. 8.

An example of calculating the number of direct connections for the TBI-I GOI network. In IPA, the gene in question was selected (MDM2 in this example). Then, its direct connections were selected by right clicking on MDM2 and using the “select nearest neighbors” option (highlighted in purple). A list of the selected genes was exported and MDM2 was removed from the list (upper right corner). The remaining genes were counted (26 in this example) and MDM2 was ranked in the TBI-I gene interaction hierarchy (primary tier) by this number
Table 6.
TBI-I Gene interaction hierarchy (GIH)
| Gene symbol | Entrez gene name | Fold change | Cellular compartment | Molecular type |
|---|---|---|---|---|
| Primary | ||||
| ATF3 | activating transcription factor 3 | 12.027 | Nucleus | transcription regulator |
| CCND1 | cyclin D1 | 2.152 | Nucleus | transcription regulator |
| CEBPB | CCAAT/enhancer binding protein (C/EBP), beta | 3.366 | Nucleus | transcription regulator |
| CREB1 | cAMP responsive element binding protein 1 | 2.666 | Nucleus | transcription regulator |
| CREBBP | CREB binding protein | 2.421 | Nucleus | transcription regulator |
| MDM2 | MDM2 proto-oncogene, E3 ubiquitin protein ligase | 2.01 | Nucleus | transcription regulator |
| NFE2L2 | nuclear factor, erythroid 2-like 2 | 2.452 | Nucleus | transcription regulator |
| SMARCA4 | SWI/SNF related, matrix associated, actin dependent regulator of chromatin, subfamily a, member 4 | 2.521 | Nucleus | transcription regulator |
| STAT3 | signal transducer and activator of transcription 3 (acute-phase response factor) | 4.219 | Nucleus | transcription regulator |
| CDK1 | cyclin-dependent kinase 1 | 2.105 | Nucleus | kinase |
| CSNK2A1 | casein kinase 2, alpha 1 polypeptide | 2.992 | Cytoplasm | kinase |
| EGFR | epidermal growth factor receptor | 6.773 | Plasma Membrane | kinase |
| GSK3B | glycogen synthase kinase 3 beta | −2.733 | Nucleus | kinase |
| CD44 | CD44 molecule (Indian blood group) | 15.558 | Plasma Membrane | enzyme |
| FN1 | fibronectin 1 | 3.97 | Extracellular Space | enzyme |
| TRAF6 | TNF receptor-associated factor 6, E3 ubiquitin protein ligase | 2.163 | Cytoplasm | enzyme |
| CASP3 | caspase 3, apoptosis-related cysteine peptidase | 2.535 | Cytoplasm | peptidase |
| ELAVL1 | ELAV like RNA binding protein 1 | 3.275 | Cytoplasm | other |
| Secondary | ||||
| CEBPD | CCAAT/enhancer binding protein (C/EBP), delta | 11.271 | Nucleus | transcription regulator |
| CREM | cAMP responsive element modulator | 2.165 | Nucleus | transcription regulator |
| EGR2 | early growth response 2 | 2.271 | Nucleus | transcription regulator |
| FOSL1 | FOS-like antigen 1 | 5.875 | Nucleus | transcription regulator |
| KLF4 | Kruppel-like factor 4 (gut) | 2.057 | Nucleus | transcription regulator |
| MITF | microphthalmia-associated transcription factor | 4.755 | Nucleus | transcription regulator |
| TCF4 | transcription factor 4 | −2.216 | Nucleus | transcription regulator |
| HSPA1A/HSPA1B | heat shock 70 kDa protein 1A | 3.137 | Cytoplasm | enzyme |
| MCM2 | minichromosome maintenance complex component 2 | 2.57 | Nucleus | enzyme |
| PTGS2 | prostaglandin-endoperoxide synthase 2 (prostaglandin G/H synthase and cyclooxygenase) | 3.106 | Cytoplasm | enzyme |
| IL1B | interleukin 1, beta | 5.166 | Extracellular Space | cytokine |
| SPP1 | secreted phosphoprotein 1 | 37.905 | Extracellular Space | cytokine |
| CDKN1B | cyclin-dependent kinase inhibitor 1B (p27, Kip1) | 3.732 | Nucleus | kinase |
| IKBKB | inhibitor of kappa light polypeptide gene enhancer in B-cells, kinase beta | 2.127 | Cytoplasm | kinase |
| KPNB1 | karyopherin (importin) beta 1 | 3.173 | Nucleus | transporter |
| MCL1 | myeloid cell leukemia 1 | 3.25 | Cytoplasm | transporter |
| THRA | thyroid hormone receptor, alpha | −2.799 | Nucleus | ligand-dependent nuclear receptor |
| CASP7 | caspase 7, apoptosis-related cysteine peptidase | 2.579 | Cytoplasm | peptidase |
| BAG3 | BCL2-associated athanogene 3 | 4.045 | Cytoplasm | other |
| CCNA2 | cyclin A2 | 2.633 | Nucleus | other |
| GFAP | glial fibrillary acidic protein | 3.011 | Cytoplasm | other |
| HSPA9 | heat shock 70 kDa protein 9 (mortalin) | 2.666 | Cytoplasm | other |
| HSPB1 | heat shock 27 kDa protein 1 | 46.922 | Cytoplasm | other |
| SNCA | synuclein, alpha (non A4 component of amyloid precursor) | −2.169 | Cytoplasm | other |
| Peripheral | ||||
| ACSL5 | acyl-CoA synthetase long-chain family member 5 | −2.361 | Cytoplasm | enzyme |
| ANXA1 | annexin A1 | 3.535 | Plasma Membrane | enzyme |
| CHSY1 | chondroitin sulfate synthase 1 | 2.873 | Cytoplasm | enzyme |
| CP | ceruloplasmin (ferroxidase) | 27.838 | Extracellular Space | enzyme |
| EHD4 | EH-domain containing 4 | 2.361 | Plasma Membrane | enzyme |
| GCLM | glutamate-cysteine ligase, modifier subunit | 2.019 | Cytoplasm | enzyme |
| HMOX1 | heme oxygenase (decycling) 1 | 9.778 | Cytoplasm | enzyme |
| MCM8 | minichromosome maintenance complex component 8 | 2.027 | Nucleus | enzyme |
| MX1 | MX dynamin-like GTPase 1 | 28.177 | Cytoplasm | enzyme |
| PDE4B | phosphodiesterase 4B, cAMP-specific | 5.602 | Cytoplasm | enzyme |
| RAB35 | RAB35, member RAS oncogene family | 2.086 | Cytoplasm | enzyme |
| RRM2 | ribonucleotide reductase M2 | 3.34 | Nucleus | enzyme |
| SDC1 | syndecan 1 | 13.681 | Plasma Membrane | enzyme |
| SETD8 | SET domain containing (lysine methyltransferase) 8 | 2.029 | Nucleus | enzyme |
| SGPL1 | sphingosine-1-phosphate lyase 1 | 3.108 | Cytoplasm | enzyme |
| SRXN1 | sulfiredoxin 1 | 6.306 | Cytoplasm | enzyme |
| TGM2 | transglutaminase 2 | 3.574 | Cytoplasm | enzyme |
| TOP2A | topoisomerase (DNA) II alpha 170 kDa | 2.26 | Nucleus | enzyme |
| BCL11A | B-cell CLL/lymphoma 11A (zinc finger protein) | −2.38 | Nucleus | transcription regulator |
| BTG2 | BTG family, member 2 | −2.22 | Nucleus | transcription regulator |
| CCAR1 | cell division cycle and apoptosis regulator 1 | −2.943 | Nucleus | transcription regulator |
| CSRNP1 | cysteine-serine-rich nuclear protein 1 | 2.821 | Nucleus | transcription regulator |
| DEK | DEK proto-oncogene | −3.006 | Nucleus | transcription regulator |
| DNAJB6 | DnaJ (Hsp40) homolog, subfamily B, member 6 | −4.383 | Nucleus | transcription regulator |
| ETV5 | ets variant 5 | −2.163 | Nucleus | transcription regulator |
| KLF13 | Kruppel-like factor 13 | −2.006 | Nucleus | transcription regulator |
| KLF6 | Kruppel-like factor 6 | 6.003 | Nucleus | transcription regulator |
| NAA15 | N(alpha)-acetyltransferase 15, NatA auxiliary subunit | 3.605 | Nucleus | transcription regulator |
| NFIX | nuclear factor I/X (CCAAT-binding transcription factor) | −2.548 | Nucleus | transcription regulator |
| NFKB2 | nuclear factor of kappa light polypeptide gene enhancer in B-cells 2 (p49/p100) | 2.768 | Nucleus | transcription regulator |
| PA2G4 | proliferation-associated 2G4, 38 kDa | −2.702 | Nucleus | transcription regulator |
| PRDM2 | PR domain containing 2, with ZNF domain | 3.677 | Nucleus | transcription regulator |
| TBL1XR1 | transducin (beta)-like 1 X-linked receptor 1 | 2.587 | Nucleus | transcription regulator |
| TCEB3 | transcription elongation factor B (SIII), polypeptide 3 (110 kDa, elongin A) | 3.053 | Nucleus | transcription regulator |
| CAMK1G | calcium/calmodulin-dependent protein kinase IG | −2.271 | Cytoplasm | kinase |
| CAMK2N1 | calcium/calmodulin-dependent protein kinase II inhibitor 1 | −11.813 | Plasma Membrane | kinase |
| CARD11 | caspase recruitment domain family, member 11 | 7.343 | Cytoplasm | kinase |
| CDK11A | cyclin-dependent kinase 11A | −4.29 | Nucleus | kinase |
| FGR | FGR proto-oncogene, Src family tyrosine kinase | 3.915 | Nucleus | kinase |
| HCK | HCK proto-oncogene, Src family tyrosine kinase | 3.887 | Cytoplasm | kinase |
| HSPB8 | heat shock 22 kDa protein 8 | 4.112 | Cytoplasm | kinase |
| LATS1 | large tumor suppressor kinase 1 | 2.003 | Nucleus | kinase |
| MAP4K4 | mitogen-activated protein kinase kinase kinase kinase 4 | 2.258 | Cytoplasm | kinase |
| NEK6 | NIMA-related kinase 6 | 2.322 | Nucleus | kinase |
| SRPK2 | SRSF protein kinase 2 | −5.614 | Nucleus | kinase |
| TJP2 | tight junction protein 2 | 2.552 | Plasma Membrane | kinase |
| Ccl2 | chemokine (C-C motif) ligand 2 | 195.455 | Extracellular Space | cytokine |
| CCL3L3 | chemokine (C-C motif) ligand 3-like 3 | 5.269 | Extracellular Space | cytokine |
| CCL4 | chemokine (C-C motif) ligand 4 | 2.162 | Extracellular Space | cytokine |
| Ccl6 | chemokine (C-C motif) ligand 6 | 10.291 | Extracellular Space | cytokine |
| Ccl7 | chemokine (C-C motif) ligand 7 | 124.78 | Extracellular Space | cytokine |
| CXCL3 | chemokine (C-X-C motif) ligand 3 | 13.211 | Extracellular Space | cytokine |
| Cxcl9 | chemokine (C-X-C motif) ligand 9 | 2.846 | Extracellular Space | cytokine |
| TIMP1 | TIMP metallopeptidase inhibitor 1 | 38.486 | Extracellular Space | cytokine |
| IL6R | interleukin 6 receptor | 2.315 | Plasma Membrane | transmembrane receptor |
| IL6ST | interleukin 6 signal transducer | 2.307 | Plasma Membrane | transmembrane receptor |
| ITGB2 | integrin, beta 2 (complement component 3 receptor 3 and 4 subunit) | 2.675 | Plasma Membrane | transmembrane receptor |
| TLR4 | toll-like receptor 4 | 2.699 | Plasma Membrane | transmembrane receptor |
| TNFRSF1A | tumor necrosis factor receptor superfamily, member 1A | 3.555 | Plasma Membrane | transmembrane receptor |
| UNC5B | unc-5 homolog B (C. elegans) | 2.067 | Plasma Membrane | transmembrane receptor |
| ALB | albumin | −3.125 | Extracellular Space | transporter |
| LCN2 | lipocalin 2 | 71.824 | Extracellular Space | transporter |
| RASA1 | RAS p21 protein activator (GTPase activating protein) 1 | 2.392 | Cytoplasm | transporter |
| TPR | translocated promoter region, nuclear basket protein | 2.212 | Nucleus | transporter |
| FGL2 | fibrinogen-like 2 | 16.793 | Extracellular Space | peptidase |
| SENP2 | SUMO1/sentrin/SMT3 specific peptidase 2 | 2.051 | Nucleus | peptidase |
| DUSP5 | dual specificity phosphatase 5 | 3.285 | Nucleus | phosphatase |
| PTPRF | protein tyrosine phosphatase, receptor type, F | −6.365 | Plasma Membrane | phosphatase |
| EIF3C | eukaryotic translation initiation factor 3, subunit C | −4.369 | Other | translation regulator |
| EIF5B | eukaryotic translation initiation factor 5B | −3.044 | Cytoplasm | translation regulator |
| FGF2 | fibroblast growth factor 2 (basic) | 2.387 | Extracellular Space | growth factor |
| KCND2 | potassium voltage-gated channel, Shal-related subfamily, member 2 | −2.792 | Plasma Membrane | ion channel |
| AHI1 | Abelson helper integration site 1 | 2.243 | Cytoplasm | other |
| BCL2A1 | BCL2-related protein A1 | 3.055 | Cytoplasm | other |
| CALB1 | calbindin 1, 28 kDa | −2.091 | Cytoplasm | other |
| CD68 | CD68 molecule | 4.365 | Plasma Membrane | other |
| CDCA7L | cell division cycle associated 7-like | 2.648 | Nucleus | other |
| CDT1 | chromatin licensing and DNA replication factor 1 | 3.098 | Nucleus | other |
| CISD2 | CDGSH iron sulfur domain 2 | −7.833 | Cytoplasm | other |
| CMIP | c-Maf inducing protein | −3.778 | Cytoplasm | other |
| DAB2 | Dab, mitogen-responsive phosphoprotein, homolog 2 (Drosophila) | 3.053 | Plasma Membrane | other |
| DES | desmin | 2.857 | Cytoplasm | other |
| DNAJB9 | DnaJ (Hsp40) homolog, subfamily B, member 9 | 2.128 | Nucleus | other |
| FLNA | filamin A, alpha | 3.45 | Cytoplasm | other |
| GADD45G | growth arrest and DNA-damage-inducible, gamma | 3.191 | Nucleus | other |
| HLA-A | major histocompatibility complex, class I, A | 9.296 | Plasma Membrane | other |
| HSPA2 | heat shock 70 kDa protein 2 | 3.51 | Cytoplasm | other |
| LCP1 | lymphocyte cytosolic protein 1 (L-plastin) | 6.082 | Cytoplasm | other |
| LSP1 | lymphocyte-specific protein 1 | 11.716 | Cytoplasm | other |
| MMS22L | MMS22-like, DNA repair protein | 2.918 | Nucleus | other |
| MSI2 | musashi RNA-binding protein 2 | 2.288 | Cytoplasm | other |
| PDLIM7 | PDZ and LIM domain 7 (enigma) | 4.695 | Cytoplasm | other |
| PHLDA1 | pleckstrin homology-like domain, family A, member 1 | 5.129 | Cytoplasm | other |
| PMEPA1 | prostate transmembrane protein, androgen induced 1 | 2.682 | Plasma Membrane | other |
| PSIP1 | PC4 and SFRS1 interacting protein 1 | −2.663 | Nucleus | other |
| RDX | radixin | 4.828 | Cytoplasm | other |
| SERPINA3 | serpin peptidase inhibitor, clade A (alpha-1 antiproteinase, antitrypsin), member 3 | 58.488 | Extracellular Space | other |
| SPIN1 | spindlin 1 | 2.178 | Nucleus | other |
| SUDS3 | suppressor of defective silencing 3 homolog (S. cerevisiae) | 2.228 | Nucleus | other |
| TAGLN2 | transgelin 2 | 3.891 | Cytoplasm | other |
| THOC2 | THO complex 2 | 2.119 | Nucleus | other |
| TMEM109 | transmembrane protein 109 | 2.106 | Cytoplasm | other |
| TMEM123 | transmembrane protein 123 | 2.348 | Plasma Membrane | other |
| Orphan | ||||
| CYP1B1 | cytochrome P450, family 1, subfamily B, polypeptide 1 | 10.998 | Cytoplasm | enzyme |
| KIF3A | kinesin family member 3A | −5.083 | Cytoplasm | enzyme |
| PTGR1 | prostaglandin reductase 1 | 2.258 | Cytoplasm | enzyme |
| RND3 | Rho family GTPase 3 | 2.864 | Cytoplasm | enzyme |
| WFS1 | Wolfram syndrome 1 (wolframin) | 2.083 | Cytoplasm | enzyme |
| ITPR2 | inositol 1,4,5-trisphosphate receptor, type 2 | 2.489 | Cytoplasm | ion channel |
| KCNN4 | potassium intermediate/small conductance calcium-activated channel, subfamily N, member 4 | 3.088 | Plasma Membrane | ion channel |
| ATRX | alpha thalassemia/mental retardation syndrome X-linked | 2.091 | Nucleus | transcription regulator |
| RAI14 | retinoic acid induced 14 | 3.284 | Nucleus | transcription regulator |
| CX3CL1 | chemokine (C-X3-C motif) ligand 1 | −2.044 | Extracellular Space | cytokine |
| PTGER3 | prostaglandin E receptor 3 (subtype EP3) | 2.425 | Plasma Membrane | G-protein coupled receptor |
| PI4K2A | phosphatidylinositol 4-kinase type 2 alpha | 2.96 | Cytoplasm | kinase |
| CD36 | CD36 molecule (thrombospondin receptor) | 5.08 | Plasma Membrane | transmembrane receptor |
| ARL11 | ADP-ribosylation factor-like 11 | 3.143 | Other | other |
| Brd4 | bromodomain containing 4 | −3.528 | Nucleus | other |
| CLN5 | ceroid-lipofuscinosis, neuronal 5 | 2.041 | Cytoplasm | other |
| Ctdspl | CTD (carboxy-terminal domain, RNA polymerase II, polypeptide A) small phosphatase-like | −7.271 | Cytoplasm | other |
| KIFAP3 | kinesin-associated protein 3 | −2.281 | Cytoplasm | other |
| Nos1ap | nitric oxide synthase 1 (neuronal) adaptor protein | −2.698 | Other | other |
| PCDH15 | protocadherin-related 15 | 2.147 | Plasma Membrane | other |
| RASSF4 | Ras association (RalGDS/AF-6) domain family member 4 | 4.289 | Other | other |
| Rbm25 | RNA binding motif protein 25 | −5.547 | Nucleus | other |
| Slpi | secretory leukocyte peptidase inhibitor | 82.908 | Cytoplasm | other |
| Tpm3 | tropomyosin 3 | 2.592 | Cytoplasm | other |
| TRIM54 | tripartite motif containing 54 | −4.426 | Cytoplasm | other |
Primary: >14 connections in GOI network (see text); Secondary: 8–14 connections in GOI network; Peripheral: <8 connections in GOI network; Orphan: No connections in GOI network; Italics= > Gene changes on both sides of the brain
TBI-C: A total of 115 GOI were identified. Our analysis showed that 78 of the GOI formed an interconnected network, leaving 37 “orphan” genes (see Additional file 5). Genes having 1st order connections with more than 10 % of the other genes within the main GOI network (>8 connections) were considered “primary” in this analysis (see Fig. 9 for an example). Genes having connections with 5 %–10 % of the other genes (4–8 connections) were considered “secondary” (see Additional file 6 for an example) and those with connections with less than 5 % of the other genes (<4 connections) were considered “peripheral”. The resultant GIH is displayed in Table 7.
Fig. 9.

An example of calculating the number of direct connections for the TBI-C GOI network. In IPA, the gene in question was selected (SOX2 in this example). Then, its direct connections were selected by right clicking on SOX2 and using the “select nearest neighbors” option (highlighted in blue). A list of the selected genes was exported and SOX2 was removed from the list (upper right corner). The remaining genes were counted (13 in this example) and SOX2 was ranked in the TBI-C gene interaction hierarchy (primary tier) by this number
Table 7.
TBI-C Gene interaction hierarchy (GIH)
| Gene symbol | Entrez gene name | Fold change | Cellular compartment | Molecular type |
|---|---|---|---|---|
| Primary | ||||
| CCND1 | cyclin D1 | −2.027 | Nucleus | transcription regulator |
| MED1 | mediator complex subunit 1 | −4.011 | Nucleus | transcription regulator |
| SMARCA4 | SWI/SNF related, matrix associated, actin dependent regulator of chromatin, subfamily a, member 4 | −7.712 | Nucleus | transcription regulator |
| SOX2 | SRY (sex determining region Y)-box 2 | −4.791 | Nucleus | transcription regulator |
| SP1 | Sp1 transcription factor | −2.076 | Nucleus | transcription regulator |
| STAT3 | signal transducer and activator of transcription 3 (acute-phase response factor) | −3.771 | Nucleus | transcription regulator |
| CSNK2A1 | casein kinase 2, alpha 1 polypeptide | −2.75 | Cytoplasm | kinase |
| EGFR | epidermal growth factor receptor | 2.374 | Plasma Membrane | kinase |
| GSK3B | glycogen synthase kinase 3 beta | −6.635 | Nucleus | kinase |
| CD44 | CD44 molecule (Indian blood group) | 2.399 | Plasma Membrane | enzyme |
| HSP90AA1 | heat shock protein 90 kDa alpha (cytosolic), class A member 1 | −4.843 | Cytoplasm | enzyme |
| Secondary | ||||
| FOXO1 | forkhead box O1 | −3.329 | Nucleus | transcription regulator |
| MEF2A | myocyte enhancer factor 2A | −6.31 | Nucleus | transcription regulator |
| NFIX | nuclear factor I/X (CCAAT-binding transcription factor) | −8.112 | Nucleus | transcription regulator |
| TCF4 | transcription factor 4 | −4.625 | Nucleus | transcription regulator |
| MAPK8 | mitogen-activated protein kinase 8 | 2.102 | Cytoplasm | kinase |
| PIK3R2 | phosphoinositide-3-kinase, regulatory subunit 2 (beta) | 2.332 | Cytoplasm | kinase |
| PTK2B | protein tyrosine kinase 2 beta | 2.15 | Cytoplasm | kinase |
| KRAS | Kirsten rat sarcoma viral oncogene homolog | −2.027 | Cytoplasm | enzyme |
| TOP2A | topoisomerase (DNA) II alpha 170 kDa | −2.406 | Nucleus | enzyme |
| ATP2A2 | ATPase, Ca++ transporting, cardiac muscle, slow twitch 2 | −2.607 | Cytoplasm | transporter |
| BAX | BCL2-associated X protein | −3.306 | Cytoplasm | transporter |
| SPP1 | secreted phosphoprotein 1 | 2.37 | Extracellular Space | cytokine |
| THRA | thyroid hormone receptor, alpha | −11.518 | Nucleus | ligand-dependent nuclear receptor |
| TUFM | Tu translation elongation factor, mitochondrial | −2.109 | Cytoplasm | translation regulator |
| CCND2 | cyclin D2 | −3.617 | Nucleus | other |
| HSPB1 | heat shock 27 kDa protein 1 | 2.639 | Cytoplasm | other |
| Peripheral | ||||
| BTG2 | BTG family, member 2 | −5.803 | Nucleus | transcription regulator |
| CCAR1 | cell division cycle and apoptosis regulator 1 | −11.648 | Nucleus | transcription regulator |
| CEBPD | CCAAT/enhancer binding protein (C/EBP), delta | 2.037 | Nucleus | transcription regulator |
| DEK | DEK proto-oncogene | −7.352 | Nucleus | transcription regulator |
| DNAJB6 | DnaJ (Hsp40) homolog, subfamily B, member 6 | 5.614 | Nucleus | transcription regulator |
| GBX2 | gastrulation brain homeobox 2 | 2.59 | Nucleus | transcription regulator |
| KLF6 | Kruppel-like factor 6 | 2.865 | Nucleus | transcription regulator |
| MAFG | v-maf avian musculoaponeurotic fibrosarcoma oncogene homolog G | −2.632 | Nucleus | transcription regulator |
| MTDH | metadherin | −2.544 | Cytoplasm | transcription regulator |
| PA2G4 | proliferation-associated 2G4, 38 kDa | −5.783 | Nucleus | transcription regulator |
| RSF1 | remodeling and spacing factor 1 | −2.618 | Nucleus | transcription regulator |
| TBL1XR1 | transducin (beta)-like 1 X-linked receptor 1 | −2.134 | Nucleus | transcription regulator |
| ZMYND11 | zinc finger, MYND-type containing 11 | −2.211 | Nucleus | transcription regulator |
| ZNF148 | zinc finger protein 148 | 2.114 | Nucleus | transcription regulator |
| ACIN1 | apoptotic chromatin condensation inducer 1 | −2.515 | Nucleus | enzyme |
| CYP1B1 | cytochrome P450, family 1, subfamily B, polypeptide 1 | 4.808 | Cytoplasm | enzyme |
| DPYD | dihydropyrimidine dehydrogenase | 2.292 | Cytoplasm | enzyme |
| MFN1 | mitofusin 1 | 2.304 | Cytoplasm | enzyme |
| MX1 | MX dynamin-like GTPase 1 | 7.326 | Cytoplasm | enzyme |
| SETD8 | SET domain containing (lysine methyltransferase) 8 | −3.93 | Nucleus | enzyme |
| TTLL1 | tubulin tyrosine ligase-like family, member 1 | 2.284 | Extracellular Space | enzyme |
| ACVR1C | activin A receptor, type IC | −9.107 | Plasma Membrane | kinase |
| CARD11 | caspase recruitment domain family, member 11 | 2.892 | Cytoplasm | kinase |
| CDK11A | cyclin-dependent kinase 11A | −14.872 | Nucleus | kinase |
| CDK19 | cyclin-dependent kinase 19 | −2.191 | Nucleus | kinase |
| PIK3CD | phosphatidylinositol-4,5-bisphosphate 3-kinase, catalytic subunit delta | −2.113 | Cytoplasm | kinase |
| PRKAA2 | protein kinase, AMP-activated, alpha 2 catalytic subunit | −2.546 | Cytoplasm | kinase |
| SRPK2 | SRSF protein kinase 2 | −23.589 | Nucleus | kinase |
| PPP3CB | protein phosphatase 3, catalytic subunit, beta isozyme | 2.1 | Plasma Membrane | phosphatase |
| PTPRF | protein tyrosine phosphatase, receptor type, F | −20.492 | Plasma Membrane | phosphatase |
| IL6ST | interleukin 6 signal transducer | −3.283 | Plasma Membrane | transmembrane receptor |
| PRLR | prolactin receptor | −3.192 | Plasma Membrane | transmembrane receptor |
| LCN2 | lipocalin 2 | 3.895 | Extracellular Space | transporter |
| RASA1 | RAS p21 protein activator (GTPase activating protein) 1 | −2.105 | Cytoplasm | transporter |
| TIMP1 | TIMP metallopeptidase inhibitor 1 | 2.101 | Extracellular Space | cytokine |
| EIF5B | eukaryotic translation initiation factor 5B | −8.766 | Cytoplasm | translation regulator |
| AHI1 | Abelson helper integration site 1 | −2.897 | Cytoplasm | other |
| CDT1 | chromatin licensing and DNA replication factor 1 | −2.295 | Nucleus | other |
| CISD2 | CDGSH iron sulfur domain 2 | −19.012 | Cytoplasm | other |
| GADD45G | growth arrest and DNA-damage-inducible, gamma | −2.384 | Nucleus | other |
| HLA-A | major histocompatibility complex, class I, A | 3.657 | Plasma Membrane | other |
| LINGO1 | leucine rich repeat and Ig domain containing 1 | −2.173 | Plasma Membrane | other |
| MAFB | v-maf avian musculoaponeurotic fibrosarcoma oncogene homolog B | −2.018 | Nucleus | other |
| PHLDA1 | pleckstrin homology-like domain, family A, member 1 | 2.16 | Cytoplasm | other |
| PMEPA1 | prostate transmembrane protein, androgen induced 1 | −2.937 | Plasma Membrane | other |
| PSIP1 | PC4 and SFRS1 interacting protein 1 | 2.113 | Nucleus | other |
| RAD23B | RAD23 homolog B (S. cerevisiae) | −2.217 | Nucleus | other |
| RASSF4 | Ras association (RalGDS/AF-6) domain family member 4 | 2.106 | Other | other |
| RDX | radixin | −5.274 | Cytoplasm | other |
| Serbp1 | Serpine1 mRNA binding protein 1 | −2.059 | Cytoplasm | other |
| SERPINA3 | serpin peptidase inhibitor, clade A (alpha-1 antiproteinase, antitrypsin), member 3 | 2.509 | Extracellular Space | other |
| Orphan | ||||
| AURKAIP1 | aurora kinase A interacting protein 1 | −2.023 | Nucleus | enzyme |
| CP | ceruloplasmin (ferroxidase) | 8.477 | Extracellular Space | enzyme |
| EHD4 | EH-domain containing 4 | −2.056 | Plasma Membrane | enzyme |
| ENTPD5 | ectonucleoside triphosphate diphosphohydrolase 5 | −2.055 | Cytoplasm | enzyme |
| KIF3A | kinesin family member 3A | −11.754 | Cytoplasm | enzyme |
| NDUFAB1 | NADH dehydrogenase (ubiquinone) 1, alpha/beta subcomplex, 1, 8 kDa | −2.028 | Cytoplasm | enzyme |
| PDE4B | phosphodiesterase 4B, cAMP-specific | 2.359 | Cytoplasm | enzyme |
| RND3 | Rho family GTPase 3 | −2.971 | Cytoplasm | enzyme |
| SDC1 | syndecan 1 | 2.566 | Plasma Membrane | enzyme |
| SRXN1 | sulfiredoxin 1 | 2.402 | Cytoplasm | enzyme |
| ATRX | alpha thalassemia/mental retardation syndrome X-linked | −5.964 | Nucleus | transcription regulator |
| KLF13 | Kruppel-like factor 13 | −4.582 | Nucleus | transcription regulator |
| NAA15 | N(alpha)-acetyltransferase 15, NatA auxiliary subunit | −3.751 | Nucleus | transcription regulator |
| KCND2 | potassium voltage-gated channel, Shal-related subfamily, member 2 | −7.585 | Plasma Membrane | ion channel |
| KCNN4 | potassium intermediate/small conductance calcium-activated channel, subfamily N, member 4 | −9.429 | Plasma Membrane | ion channel |
| CAMK2N1 | calcium/calmodulin-dependent protein kinase II inhibitor 1 | −23.824 | Plasma Membrane | kinase |
| TRPM7 | transient receptor potential cation channel, subfamily M, member 7 | 2.226 | Plasma Membrane | kinase |
| ATP2B2 | ATPase, Ca++ transporting, plasma membrane 2 | 2.276 | Plasma Membrane | transporter |
| TPR | translocated promoter region, nuclear basket protein | −2.728 | Nucleus | transporter |
| FGL2 | fibrinogen-like 2 | 4.017 | Extracellular Space | peptidase |
| EIF3C | eukaryotic translation initiation factor 3, subunit C | −9.072 | Other | translation regulator |
| Brd4 | bromodomain containing 4 | −15.202 | Nucleus | other |
| CCDC86 | coiled-coil domain containing 86 | −2.149 | Nucleus | other |
| CD68 | CD68 molecule | 2.007 | Plasma Membrane | other |
| CDH13 | cadherin 13 | −2.692 | Plasma Membrane | other |
| CMIP | c-Maf inducing protein | −13.763 | Cytoplasm | other |
| Ctdspl | CTD (carboxy-terminal domain, RNA polymerase II, polypeptide A) small phosphatase-like | −36.886 | Cytoplasm | other |
| KIFAP3 | kinesin-associated protein 3 | −7.831 | Cytoplasm | other |
| LCP1 | lymphocyte cytosolic protein 1 (L-plastin) | 2.799 | Cytoplasm | other |
| LSP1 | lymphocyte-specific protein 1 | 2.14 | Cytoplasm | other |
| Nos1ap | nitric oxide synthase 1 (neuronal) adaptor protein | −5.717 | Other | other |
| PALLD | palladin, cytoskeletal associated protein | −5.086 | Plasma Membrane | other |
| Rbm25 | RNA binding motif protein 25 | −16.213 | Nucleus | other |
| Slpi | secretory leukocyte peptidase inhibitor | 3.119 | Cytoplasm | other |
| THOC2 | THO complex 2 | −4.886 | Nucleus | other |
| Tpm3 | tropomyosin 3 | −2.715 | Cytoplasm | other |
| TRIM54 | tripartite motif containing 54 | −2.032 | Cytoplasm | other |
Primary: >8 connections in GOI network (see text); Secondary: 4–8 connections in GOI network; Peripheral: <4 connections in GOI network; Orphan: No connections in GOI network; Italics= > Gene changes on both sides of the brain
Cell cycle genes included in the GIHs
We performed an IPA molecular and cellular functional analysis on the unranked GOI for both datasets and the top 2 tiers (most significant by our definition) of our resultant GIHs to further elucidate the most significant biological functions post-TBI (Fig. 10). The cell death and survival category was removed from this analysis since all genes were initially selected from this functional category. When analyzing the top 2 tiers of the GIHs, cell cycle was ranked second for TBI-I and first for TBI-C. Is was also the highest ranked molecular and cellular function common to both sides (Fig. 10b, d). The cell cycle moved up 5 functional ranking spots on both sides of the brain from where it was ranked prior to the GIH analysis. This result was intriguing because aberrant attempts to reactivate the cell cycle by post-mitotic neurons have been implicated as a trigger for apoptosis [26, 27]. By cross-referencing our GIHs with genes that IPA includes in the cell cycle upper level biological function, we determined that 74 genes in the TBI-I GIH and 47 genes in the TBI-C GIH were associated with the cell cycle (Tables 8 and 9). Just over 85 % of the cell cycle genes increased in expression ipsilaterally compared to controls. The relative inverse is true contralaterally with nearly 79 % of the cell cycle genes decreasing in expression. Remarkably, 83 % of TBI-I and 70 % of TBI-C primary and secondary tier genes were classified as cell cycle genes (TBI-I: 35 of 42 genes; TBI-C: 19 of 27 genes).
Fig. 10.
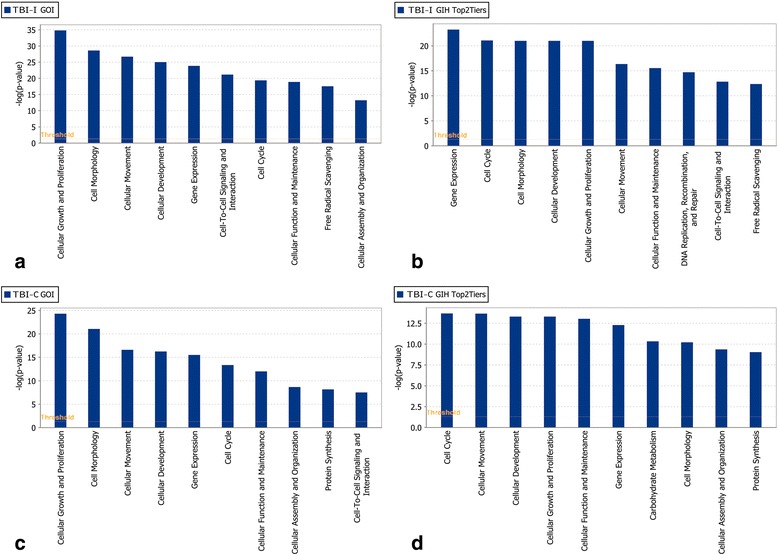
Functional analysis of GOI and top 2 GIH tiers. The top 10 molecular and cellular functions determined by IPA to be associated with the unranked GOI for TBI-I (a) and TBI-C (c) and the primary and secondary tiers of the TBI-I (b) and TBI-C (d) GIHs. Side by side comparison allowed for visualization of how functions changed in significance order once the genes were put into a ranked order. Notably, cell cycle moved up to be ranked second on both sides of the brain. The cell death and survival category was removed from this analysis because all genes were initially selected from that functional category
Table 8.
Cell cycle genes in the TBI-I gene interaction hierarchy by tier
| Primary | Secondary | Peripheral | Orphan | |
|---|---|---|---|---|
| ATF3 | BAG3 | BCL2A1 | NEK6 | ATRX |
| CASP3 | CASP7 | BTG2 | NFIX | Brd4 |
| CCND1 | CCNA2 | CAMK2N1 | PA2G4 | CYP1B1 |
| CD44 | CDKN1B | Ccl2 | PDLIM7 | |
| CDK1 | CEBPD | CDK11A | PMEPA1 | |
| CEBPB | CREM | CDT1 | PRDM2 | |
| CREB1 | FOSL1 | DEK | PTPRF | |
| CREBBP | HSPA1A/HSPA1B | ETV5 | RAB35 | |
| CSNK2A1 | HSPB1 | FGF2 | SETD8 | |
| EGFR | IKBKB | FLNA | SRPK2 | |
| ELAVL1 | IL1B | GADD45G | SUDS3 | |
| FN1 | KLF4 | HMOX1 | TBL1XR1 | |
| GSK3B | KPNB1 | HSPA2 | TCEB3 | |
| MDM2 | MCL1 | IL6R | THOC2 | |
| NFE2L2 | MCM2 | KLF6 | TIMP1 | |
| SMARCA4 | MITF | LATS1 | TNFRSF1A | |
| STAT3 | PTGS2 | MCM8 | TOP2A | |
| SPP1 | MMS22L | TPR |
Table 9.
Cell cycle genes in the TBI-C gene interaction hierarchy by tier
| Primary | Secondary | Peripheral | Orphan | |
|---|---|---|---|---|
| CCND1 | BAX | ACIN1 | MTDH | ATRX |
| CD44 | CCND2 | BTG2 | PA2G4 | Brd4 |
| CSNK2A1 | FOXO1 | CDK11A | PMEPA1 | CAMK2N1 |
| EGFR | HSPB1 | CDK19 | PRKAA2 | CDH13 |
| GSK3B | KRAS | CDT1 | PTPRF | ENTPD5 |
| SMARCA4 | MAPK8 | CEBPD | RSF1 | THOC2 |
| SOX2 | NFIX | CYP1B1 | SETD8 | TPR |
| SP1 | PTK2B | DEK | SRPK2 | |
| STAT3 | SPP1 | GADD45G | TBL1XR1 | |
| TOP2A | KLF6 | TIMP1 | ||
| MAFB |
Real-time PCR
As expected, ipsilateral expression was significantly increased compared to naïve for all genes tested following TBI (Fig. 11). However, ipsilateral expression was only significantly different from contralateral expression for SPP1 and HSPB1 while this comparison for STAT3 (p = 0.088) and CCND1 (p = 0.063) fell short of statistical significance. Contralateral expression was not significantly different from naïve for any of the genes tested.
Fig. 11.

Real-time PCR results for selected genes. SPP1, HSPB1, STAT3, and CCND1 were chosen for real-time PCR studies. Using the ΔΔCt method, the normalized target gene expression level was given by 2-ΔΔCt. For all genes, ipsilateral (IPSI) expression was significantly different from naïve (a-d). Ipsilateral expression was also significantly different from contralateral (CONTRA) expression for SPP1 (a) and HSPB1 (b). The comparison of ipsilateral to contralateral expression for STAT3 (c; p = 0.088) and CCND1 (d; p = 0.063) fell short of statistical significance. Contralateral expression was not significantly different from naïve for any genes. The results are shown as mean ± SE. * p < 0.05, ** p < 0.01, *** p < 0.005
Discussion
We used microarray technology and subsequent bioinformatic analysis in this study to examine molecular and functional alterations following TBI. Not surprisingly, cell death and survival was determined to be a significant molecular and cellular function associated with the genes expressed ipsilateral to the injury. Interestingly, while cell death was not observed on the contralateral side of the brain, there was significant modulation of cell death and survival genes and this molecular and cellular function is very highly associated with the gene expression pattern.
Our histology results using markers for cell damage (FJB) and DNA fragmentation (TUNEL) suggest a potential opportunity for therapeutic intervention. At 24 h post-injury, there is a developing cortical cavity at the site of impact surrounded with FJB and TUNEL-positive cells. Therapy aimed at preserving cortical tissue should be administered in the acute period to exert maximal neuroprotective effects. However, while there is significant correlation between FJB and TUNEL staining in the cortex at this time point, no TUNEL-positive cells were detected in the hippocampus where FJB detected some neuronal damage on the ipsilateral side. Similar histology results were recently seen with our model of nerve agent exposure [20] and a neuroprotective agent was able to rescue the hippocampal neurons [28]. This suggests that these hippocampal neurons have not yet progressed to the point of apoptosis and an extended therapeutic window may exist for subcortical brain areas.
Our microarray data showed that TBI resulted in significant alterations in CD gene expression on both sides of the brain. Nearly 45 % of the differentially expressed CD genes were common to both sides of the brain and 82 % of those genes changed similarly. However, a distinct expression pattern was exhibited by the balance of the common CD genes and those that change in expression uniquely on one side of the brain. The vast majority of these ipsilateral CD genes increased in expression compared to controls, while the majority of these contralateral CD genes decreased in expression compared to controls or were reduced compared to ipsilateral expression. Notable was the expression of key apoptosis-related genes. BCL2A1, caspases 3 and 7, CDK1, cyclins A2 and D1, and NFKB2 showed increased expression ipsilaterally, while BAX, cyclins D1and D2, KRAS and PIK3CD showed decreased expression contralaterally.
It is important to note here that the real-time PCR results for the genes selected did not agree totally with the microarray results. This was especially true for the contralateral samples. However, it has been shown that the correlation between microarray and real-time PCR results is lower for genes showing decreased expression and having lower fold changes [29]. Our results do show better correlation with the large TBI-I fold change genes SPP1 (37.9 fold) and HSPB1 (46.9 fold). The remaining fold changes for the selected genes are less than ± 4.22 with most in the 2.0-2.6 range. While further validation including more genes and a larger sample size may be needed for subsequent studies, these PCR results are consistent with expression of these genes being higher for TBI-I and lower for TBI-C. It is in this context that the discussion of the microarray results continues.
As stated above, this contralateral expression pattern in our model may indicate an endogenous effort to suppress cell death promoting genes remote from the injury in order to prevent spreading of the injury and offer additional protection from additional insults, similar to gene expression changes in ischemic preconditioning [30, 31]. An analogous and potentially neuroprotective gene expression pattern was observed in an in vitro model of mild TBI where the modulation of genes reflected an endogenous effort to prevent oxidative/nitrosative stress and apoptosis during a transient period of mitochondrial malfunctioning [32]. We have previously reported a similar gene expression pattern for inflammatory response genes following TBI [12]. In that previous study, genes from both sides of the brain were pooled for analysis. Because we now believe that analyzing gene expression on the contralateral side is critical to understanding endogenous protective mechanisms, the full GIH analysis [33] was performed on each side of the brain separately. By determining the key molecules involved in the endogenous effort to suppress cell death, it may be possible to develop molecular strategies to provide neuroprotection for the injured brain as well as augment the endogenous neuroprotective process.
We identified 170 TBI-I and 115 TBI-C GOI through canonical pathway and network analysis combined with the common genes that change differently on each side of the brain. Many of these genes have been previously associated with acute brain injuries (i.e., TBI, stroke) but not all of them have been connected to the cell death caused by these injuries. These genes include BAX, CASP3, CCNA2, CCND1, CD44, CD68, CEBPD, GSK3B, HSPB1, IL1B, LCN2, NFKB2, SERPINA3, SPP1, STAT3, TIMP1, TNFRSF1A, and TOP2A [14, 34–42]. This supported the idea that our methods for identifying genes of interest targets important genes in the post-injury response. Several genes which have been linked to cell death in cancer, epilepsy, or psychological disorders but not yet associated with brain injury, including CSNK2A1, ELAVL1, MITF, and SMARCA4, were also identified which may provide additional therapeutic targets for prevention of cell death following TBI. We next wanted to determine which genes were central to cell death processes. We approached this by creating a network of our GOI within IPA and determining how many 1st order connections each gene had with the other genes in the network. A GIH was created based on these numbers and distinct patterns in terms of molecular type were found.
For TBI-I, transcription regulators were the predominant molecular type in the top 2 tiers of the GIH. This result was expected from our previous GIH analyses [12]. After the transcription regulators, kinases and unspecified enzymes were prominent in the top 2 tiers of the TBI-I GIH. In the peripheral tier, unspecified enzymes, transcription regulators and kinases were most represented. Cytokines, transmembrane receptors, and transporters also had notable numbers in the peripheral tier. Remarkably, only 2 cytokines, IL1B and SPP1, are included in the top 2 tiers of this GIH. This result is not unexpected as previous GIH analysis had shown that the near 1-to-1 relationship that cytokines have with their receptors limits the 1st order connections these molecules have in the GOI network [12].
Transcription regulators were also predominant in the top 2 tiers of the TBI-C GIH followed by kinases and unspecified enzymes. These same molecular types headed the peripheral tier as well with transcription regulators ahead of enzymes and kinases. Other notable molecular types in the peripheral tier were phosphatases, transmembrane receptors, and transporters. Again, cytokines do not have significant numbers in this GIH. Our analysis strongly suggests that other molecular types, transcription regulators, kinases, and other enzymes in this case, may be better therapeutic targets because they have the potential to impact the overall cell death process to a greater extent.
Very intriguing in our cell death analysis was how cell cycle moved up significantly in functional ranking on both sides of the brain when comparing the functional analysis for unranked GOI to that for the top 2 tiers of our GIHs. Cell cycle molecules have be implicated as apoptotic mediators for post-mitotic cells under stress due to trauma or neurological disease. It is believed that there is an aberrant attempt the re-enter the cell cycle that causes the cells to eventually undergo apoptosis [26, 43–48]. Much attention has been given to the cyclin-dependent kinases (CDKs), cyclins, which activate the CDKs [27, 48, 49], and CDK inhibitors. Significant evidence for CDK involvement in cell cycle-related apoptosis has come from the experimental use of exogenous CDK inhibitors that prevented apoptosis [47, 50–56]. Pertinent to this discussion, evidence has shown that CDK1, when activated by cyclin A [57], and CDK4 and CDK6, when activated by cyclin D in post-mitotic neurons, can lead to cell death via caspase-dependent apoptosis [26, 27, 44, 49]. Additionally, ablation of cyclin D1 reduces neurodegeneration caused by TBI [58]. CDK11 has been shown to initiate apoptosis by interacting with either cyclin D3 [59] or eukaryotic translation initiation factor 3 subunit F (EIF3F) [60]. In our model, cyclins A2 and D1 are increased ipsilaterally, consistent with other studies [27, 47, 50], while both cyclins D1 and D2 are decreased contralaterally. CDK1 and the CDK4 inhibitors, CDKN1A (p21,Cip1 (not in GIH)) and CDKN1B (p27,Kip1), are all increased ipsilaterally. CDK11 (CDK11A (both sides); CDK19 (TBI-C only)) decreases in expression on both sides of the brain. While not found in our analysis, EIF3F is part of the functional core of EIF along with EIF3A (TBI-C only (not in GIH)) and EIF3C (both sides) which decrease in expression following TBI [61]. It is plausible that apoptosis would occur in this injury state because these molecules are not being expressed in the tightly controlled manner necessary to properly navigate the cell cycle [46, 55]. Other CDKs have also been implicated in apoptosis and excitotoxic cell death [26, 49, 51, 52, 62, 63] but our GIH does not point to those as major players.
In addition to 4 TBI-I and 2 TBI-C CDK-related genes, IPA classified 31 other TBI-I genes and 17 other TBI-C genes in the top 2 tiers of their respective GIHs as cell cycle genes. It should be noted that cell cycle is an upper level function in IPA. That means these genes, while associated with the cell cycle, are not necessarily integral to its progression. These genes fell into 3 general categories. The first category included those genes that have been experimentally linked to a model of TBI. Genes in this category were ATF3, BAG3, CASP3, CASP7, CD44, CEBPB, CEBPD, CREB1, CREM, EGFR, FN1, FOSL1, GSK3B, HSPA1A/HSPA1B, HSPB1, IKBKB, IL1B, KLF4, MCL1, MDM2, NFE2L2, PTGS2, SPP1, and STAT3 for TBI-I [22, 36, 40–42, 64–78] and BAX, CD44, EGFR, FOXO1, GSK3B, HSPB1, MAPK8, SOX2, SPP1, and STAT3 for TBI-C [22, 36, 40, 41, 67, 71, 78–81]. The second category included genes that had been observed in models of hypoxia/ischemia, chemical brain lesions, or spinal cord injury. Genes in this category were CREBBP and KPNB1 for TBI-I [82, 83] and KRAS, PTK2B, SP1, and TOP2A for TBI-C [84–87]. The third category included genes that were previously linked only to the progression of cancers or psychotic disorders and, therefore, novel to a discussion of cell death following TBI. Genes in this category were CSNK2A1, ELAVL1, MCM2, MITF, and SMARCA4 for TBI-I and CSNK2A1, NFIX, and SMARCA4 for TBI-C. The specifics of how these genes are associated with the cell cycle and affect cell death are beyond the scope of this analysis. However, our GIH analysis would suggest that these genes would be intriguing targets for further study in relation to post-TBI cell death. Specifically, CCND1, CSNK2A1, SMARCA4, and STAT3 were included in the top 2 tiers for both datasets and exhibit increased expression in TBI-I and decreased expression in TBI-C. Additionally, cyclin D2 and 2 apoptosis signaling genes, BAX and KRAS, are in the secondary tier of the TBI-C GIH and show decreased expression. Targeting these key molecules showing contralateral suppression for potential therapies may prove effective because their expression correlates to the observed absence of cell death.
Conclusions
Unilateral TBI results in significant gene expression changes on both sides of the brain. The overall gene expression pattern in the brain suggests a suppression of CD genes contralateral to the injury which may be an endogenous protective mechanism. Using canonical pathways and IPA generated networks as a guide, we were able to identify genes that were central to the post-TBI CD gene response. Further network analysis allowed for the ranking of these genes into GIHs. The GIH ranking then led to the identification of cell cycle as a key molecular and cellular function on both sides of the brain. Significantly, several cell cycle molecules were identified in this analysis that exhibit increased expression ipsilaterally and decreased expression contralaterally. GIH analysis relies on connections in a virtual network. Future experiments will use discrete microdissected portions of the brain (cortex, hippocampus, striatum) in order to increase the likelihood that the molecular interactions described in the network actually do occur in vivo. This will increase the power of the GIH analysis. Further real-time PCR confirmation will be necessary with an emphasis on contralateral and decreased gene expression. Also, proteomic confirmation will be necessary to show that in vivo protein levels match our microarray results [88, 89]. Once confirmed, the key CD molecules suggested by our GIH can be further explored. Additional exploration into the remote suppression of CD genes may provide insight into neuroprotective mechanisms that could be used to develop therapies to prevent cell death following TBI.
Acknowledgements
The authors would like to thank Brock Wester, Kaelin Brewster, and Samantha Simon for their technical assistance. This work was supported by National Institutes of Health (NIH) grants U01 NS 057993 (BDF), U54 NS060659 (BDF), Department of Defense Contract #W81XWH-10-2-0055 (BDF), the W.M. Keck Foundation (BDF); BRIC NIH grant #5P20M006131-02 (GDF), Howard Hughes Medical Institute grant #52006306 (GDF) and PHS Grant (UL1 RR025008, KL2 RR025009 or TL1 RR025010) from the Clinical and Translational Science Award program, NIH, National Center for Research Resources (NCRR) (MCL). The project described was supported by Morehouse School of Medicine Grants Number U54 RR026137, G12RR003034 and S21MD000101 from the NCRR, a component of NIH, and its contents are solely the responsibility of the authors and do not necessarily represent the official views of NCRR or NIH.
Abbreviations
- CCI
controlled cortical impact
- FJB
fluoro-Jade B
- GIH
gene interaction hierarchy
- GOI
genes of interest
- IPA
ingenuity pathway analysis
- CD
cell death and survival
- TBI
traumatic brain injury
- TBI-C
contralateral vs naïve gene dataset
- TBI-I
ipsilateral vs naïve gene dataset
- TUNEL
terminal deoxynucleotidyl transferase dUTP nick end labeling
Additional files
Examples of TBI-I networks. TBI-I CD networks 1 (A), 3 (B), 5 (C), and 6 (D) (see Table 2) with all gene families, groups and complexes expanded to show the member genes and showing the relative expression values of potential GOI for TBI-I. red: relative increase in expression; green: relative decrease in expression; white: no change in expression; gold connections and outlines: expansion of gene families, groups and complexes in the original network. (TIF 4.06 mb)
Examples of TBI-C networks. TBI-C CD networks 1 (A), 3 (B), 5 (C), and 6 (D) (see Table 3) with all gene families, groups and complexes expanded to show the member genes and showing the relative expression values of potential GOI for TBI-C. red: relative increase in expression; green: relative decrease in expression; white: no change in expression; gold connections and outlines: expansion of gene families, groups and complexes in the original network. (TIF 4.30 mb)
The TBI-I GOI network. This is the resultant network when IPA connected our 170 TBI-I GOI using only direct (1st order) connections between the genes. 145 of the GOI formed an interconnected network, leaving 25 “orphan” genes. (TIF 4.20 mb)
An example of calculating the number of direct connections for the TBI-I GOI network. In IPA, the gene in question was selected (HSPB1 in this example). Then, its direct connections were selected by right clicking on HSPB1 and using the “select nearest neighbors” option (highlighted in purple). A list of the selected genes was exported and HSPB1 was removed from the list (upper right corner). The remaining genes were counted (11 in this example) and HSPB1 was ranked in the TBI-I gene interaction hierarchy (secondary tier) by this number. (TIF 3.99 mb)
The TBI-C GOI network. This is the resultant network when IPA connected our 115 TBI-C GOI using only direct (1st order) connections between the genes. 78 of the GOI formed an interconnected network, leaving 37 “orphan” genes. (TIF 4.84 mb)
An example of calculating the number of direct connections for the TBI-C GOI network. In IPA, the gene in question was selected (CCND2 in this example). Then, its direct connections were selected by right clicking on CCND2 and using the “select nearest neighbors” option (highlighted in purple). A list of the selected genes was exported and CCND2 was removed from the list (upper right corner). The remaining genes were counted (6 in this example) and CCND2 was ranked in the TBI-C gene interaction hierarchy (secondary tier) by this number. (TIF 4.69 mb)
Footnotes
Competing interests
The authors declare that they have no competing interests.
Authors’ contributions
TEW, GDF and BDF were responsible for overall study design and execution. TEW, MCS. TD and MCL were responsible for the animal models, sample preparation and histological analysis. TEW, GDF, ASG and BDF were responsible for carrying out microarray studies and bioinformatic data analysis. BD was responsible for data management. The manuscript was written by TEW and BDF. All authors have read and approved the final manuscript.
Contributor Information
Todd E. White, Email: twhite@msm.edu
Monique C. Surles-Zeigler, Email: msurles@msm.edu
Gregory D. Ford, Email: gford@highlands.edu
Alicia S. Gates, Email: arenee277@yahoo.com
Benem Davids, Email: benemdavids@gmail.com.
Timothy Distel, Email: timothy.distel@medsch.ucr.edu.
Michelle C. LaPlaca, Email: laplaca@gatech.edu
Byron D. Ford, Email: byron.ford@ucr.edu
References
- 1.Faul M, Xu L, Wald MM, Coronado VG. Traumatic brain injury in the United States: emergency department visits, hospitalizations and deaths 2002–2006. Atlanta: Centers for Disease Control and Prevention, National Center for Injury Prevention and Control; 2010. [Google Scholar]
- 2.Coronado VG, Xu L, Basavaraju SV, McGuire LC, Wald MM, Faul MD, et al. Surveillance for traumatic brain injury-related deaths--United States, 1997–2007. Morb Mortal Wkly Rep Surveill Summ. 2011;60(5):1–32. [PubMed] [Google Scholar]
- 3.Selassie AW, Zaloshnja E, Langlois JA, Miller T, Jones P, Steiner C. Incidence of long-term disability following traumatic brain injury hospitalization, United States, 2003. J Head Trauma Rehabil. 2008;23(2):123–31. doi: 10.1097/01.HTR.0000314531.30401.39. [DOI] [PubMed] [Google Scholar]
- 4.Zaloshnja E, Miller T, Langlois JA, Selassie AW. Prevalence of long-term disability from traumatic brain injury in the civilian population of the United States, 2005. J Head Trauma Rehabil. 2008;23(6):394–400. doi: 10.1097/01.HTR.0000341435.52004.ac. [DOI] [PubMed] [Google Scholar]
- 5.Gubata ME, Packnett ER, Blandford CD, Piccirillo AL, Niebuhr DW, Cowan DN. Trends in the Epidemiology of Disability Related to Traumatic Brain Injury in the US Army and Marine Corps: 2005 to 2010. J Head Trauma Rehabil. 2013 doi: 10.1097/HTR.0b013e318295f590. [DOI] [PubMed] [Google Scholar]
- 6.Wojcik BE, Stein CR, Bagg K, Humphrey RJ, Orosco J. Traumatic brain injury hospitalizations of U.S. army soldiers deployed to Afghanistan and Iraq. Am J Prev Med. 2010;38(1 Suppl):S108–16. doi: 10.1016/j.amepre.2009.10.006. [DOI] [PubMed] [Google Scholar]
- 7.McIntosh TK, Saatman KE, Raghupathi R, Graham DI, Smith DH, Lee VM, et al. The Dorothy Russell Memorial Lecture. The molecular and cellular sequelae of experimental traumatic brain injury: pathogenetic mechanisms. Neuropathol Appl Neurobiol. 1998;24(4):251–67. doi: 10.1046/j.1365-2990.1998.00121.x. [DOI] [PubMed] [Google Scholar]
- 8.Bramlett HM, Dietrich WD. Pathophysiology of cerebral ischemia and brain trauma: similarities and differences. J Cereb Blood Flow Metab. 2004;24(2):133–50. doi: 10.1097/01.WCB.0000111614.19196.04. [DOI] [PubMed] [Google Scholar]
- 9.Loane DJ, Faden AI. Neuroprotection for traumatic brain injury: translational challenges and emerging therapeutic strategies. Trends Pharmacol Sci. 2010;31(12):596–604. doi: 10.1016/j.tips.2010.09.005. [DOI] [PMC free article] [PubMed] [Google Scholar]
- 10.Kumar A, Loane DJ. Neuroinflammation after traumatic brain injury: opportunities for therapeutic intervention. Brain Behav Immun. 2012;26(8):1191–201. doi: 10.1016/j.bbi.2012.06.008. [DOI] [PubMed] [Google Scholar]
- 11.IPA®. Ingenuity® Web Site. 2011. www.ingenuity.com. Accessed September 2015.
- 12.White TE, Ford GD, Surles-Zeigler MC, Gates AS, Laplaca MC, Ford BD. Gene expression patterns following unilateral traumatic brain injury reveals a local pro-inflammatory and remote anti-inflammatory response. BMC Genomics. 2013;14:282. doi: 10.1186/1471-2164-14-282. [DOI] [PMC free article] [PubMed] [Google Scholar]
- 13.Xu Z, Jiang J, Ford G, Ford BD. Neuregulin-1 is neuroprotective and attenuates inflammatory responses induced by ischemic stroke. Biochem Biophys Res Commun. 2004;322(2):440–6. doi: 10.1016/j.bbrc.2004.07.149. [DOI] [PubMed] [Google Scholar]
- 14.Xu Z, Ford GD, Croslan DR, Jiang J, Gates A, Allen R, et al. Neuroprotection by neuregulin-1 following focal stroke is associated with the attenuation of ischemia-induced pro-inflammatory and stress gene expression. Neurobiol Dis. 2005;19(3):461–70. doi: 10.1016/j.nbd.2005.01.027. [DOI] [PubMed] [Google Scholar]
- 15.Bye N, Habgood MD, Callaway JK, Malakooti N, Potter A, Kossmann T, et al. Transient neuroprotection by minocycline following traumatic brain injury is associated with attenuated microglial activation but no changes in cell apoptosis or neutrophil infiltration. Exp Neurol. 2007;204(1):220–33. doi: 10.1016/j.expneurol.2006.10.013. [DOI] [PubMed] [Google Scholar]
- 16.Lee HF, Lee TS, Kou YR. Anti-inflammatory and neuroprotective effects of triptolide on traumatic brain injury in rats. Respir Physiol Neurobiol. 2012;182(1):1–8. doi: 10.1016/j.resp.2012.01.016. [DOI] [PubMed] [Google Scholar]
- 17.Yu S, Kaneko Y, Bae E, Stahl CE, Wang Y, van Loveren H, et al. Severity of controlled cortical impact traumatic brain injury in rats and mice dictates degree of behavioral deficits. Brain Res. 2009;1287:157–63. doi: 10.1016/j.brainres.2009.06.067. [DOI] [PubMed] [Google Scholar]
- 18.Affymetrix. GeneChip® 3′ IVT Express Kit User Manual. 2010. http://www.affymetrix.com/support/technical/manuals.affx. Accessed March 2015.
- 19.IPA®. FAQs about Statistical Calculations. 2015. http://ingenuity.force.com/ipa/IPATutorials?id=kA250000000TNACCA4. Accessed September 2015.
- 20.Li Y, Lein PJ, Liu C, Bruun DA, Tewolde T, Ford G, et al. Spatiotemporal pattern of neuronal injury induced by DFP in rats: a model for delayed neuronal cell death following acute OP intoxication. Toxicol Appl Pharmacol. 2011;253(3):261–9. doi: 10.1016/j.taap.2011.03.026. [DOI] [PMC free article] [PubMed] [Google Scholar]
- 21.IPA®. IPA® Canonical Pathways Overview. 2013. http://ingenuity.force.com/ipa/IPATutorials?id=kA250000000TN3aCAG. Accessed September 2015.
- 22.Kaya SS, Mahmood A, Li Y, Yavuz E, Goksel M, Chopp M. Apoptosis and expression of p53 response proteins and cyclin D1 after cortical impact in rat brain. Brain Res. 1999;818(1):23–33. doi: 10.1016/S0006-8993(98)01204-9. [DOI] [PubMed] [Google Scholar]
- 23.Raghupathi R, Graham DI, McIntosh TK. Apoptosis after traumatic brain injury. J Neurotrauma. 2000;17(10):927–38. doi: 10.1089/neu.2000.17.927. [DOI] [PubMed] [Google Scholar]
- 24.Dressler J, Vemuganti R. Apoptosis and gene expression after TBI. Leg Med (Tokyo) 2009;11(Suppl 1):S54–S5. doi: 10.1016/j.legalmed.2009.02.024. [DOI] [PubMed] [Google Scholar]
- 25.IPA®. IPA® Network Generation. 2013. http://ingenuity.force.com/ipa/IPATutorials?id=kA250000000TNBZCA4. Accessed September 2015.
- 26.Stoica BA, Byrnes KR, Faden AI. Cell cycle activation and CNS injury. Neurotox Res. 2009;16(3):221–37. doi: 10.1007/s12640-009-9050-0. [DOI] [PubMed] [Google Scholar]
- 27.Byrnes KR, Faden AI. Role of cell cycle proteins in CNS injury. Neurochem Res. 2007;32(10):1799–807. doi: 10.1007/s11064-007-9312-2. [DOI] [PubMed] [Google Scholar]
- 28.Li Y, Lein PJ, Liu C, Bruun DA, Giulivi C, Ford G, et al. Neuregulin-1 is Neuroprotective in a Rat Model of Organophosphate-Induced Delayed Neuronal Injury. Toxicol Appl Pharmacol. 2012;262(2):194–204. doi: 10.1016/j.taap.2012.05.001. [DOI] [PMC free article] [PubMed] [Google Scholar]
- 29.Morey JS, Ryan JC, Van Dolah FM. Microarray validation: factors influencing correlation between oligonucleotide microarrays and real-time PCR. Biological Procedures Online. 2006;8:175–93. doi: 10.1251/bpo126. [DOI] [PMC free article] [PubMed] [Google Scholar]
- 30.Stenzel-Poore MP, Stevens SL, Simon RP. Genomics of preconditioning. Stroke. 2004;35(11 Suppl 1):2683–6. doi: 10.1161/01.STR.0000143735.89281.bb. [DOI] [PubMed] [Google Scholar]
- 31.Stenzel-Poore MP, Stevens SL, Xiong Z, Lessov NS, Harrington CA, Mori M, et al. Effect of ischaemic preconditioning on genomic response to cerebral ischaemia: similarity to neuroprotective strategies in hibernation and hypoxia-tolerant states. Lancet. 2003;362(9389):1028–37. doi: 10.1016/S0140-6736(03)14412-1. [DOI] [PubMed] [Google Scholar]
- 32.Di Pietro V, Amorini AM, Tavazzi B, Hovda DA, Signoretti S, Giza CC, et al. Potentially neuroprotective gene modulation in an in vitro model of mild traumatic brain injury. Mol Cell Biochem. 2013;375(1–2):185–98. doi: 10.1007/s11010-012-1541-2. [DOI] [PubMed] [Google Scholar]
- 33.White TE, Ford BD. Gene Interaction Hierarchy Analysis Can Be an Effective Tool for Managing Big Data Related to Unilateral Traumatic Brain Injury. In: Kobeissy FH, editor. Brain Neurotrauma: Molecular, Neuropsychological, and Rehabilitation Aspects. Boca Raton (FL): CRC Press/Taylor & Francis; 2015. Chapter 28. p. 378-398. [PubMed]
- 34.Israelsson C, Bengtsson H, Kylberg A, Kullander K, Lewen A, Hillered L, et al. Distinct cellular patterns of upregulated chemokine expression supporting a prominent inflammatory role in traumatic brain injury. J Neurotrauma. 2008;25(8):959–74. doi: 10.1089/neu.2008.0562. [DOI] [PubMed] [Google Scholar]
- 35.Fahlenkamp AV, Coburn M, Czaplik M, Ryang YM, Kipp M, Rossaint R, et al. Expression analysis of the early chemokine response 4 h after in vitro traumatic brain injury. Inflamm Res. 2011;60(4):379–87. doi: 10.1007/s00011-010-0281-6. [DOI] [PubMed] [Google Scholar]
- 36.von Gertten C, Flores MA, Holmin S, Mathiesen T, Nordqvist AC. Genomic responses in rat cerebral cortex after traumatic brain injury. BMC Neurosci. 2005;6:69. doi: 10.1186/1471-2202-6-69. [DOI] [PMC free article] [PubMed] [Google Scholar]
- 37.Kobori N, Clifton GL, Dash P. Altered expression of novel genes in the cerebral cortex following experimental brain injury. Brain Res Mol Brain Res. 2002;104(2):148–58. doi: 10.1016/S0169-328X(02)00331-5. [DOI] [PubMed] [Google Scholar]
- 38.Poulsen CB, Penkowa M, Borup R, Nielsen FC, Caceres M, Quintana A, et al. Brain response to traumatic brain injury in wild-type and interleukin-6 knockout mice: a microarray analysis. J Neurochem. 2005;92(2):417–32. doi: 10.1111/j.1471-4159.2004.02877.x. [DOI] [PubMed] [Google Scholar]
- 39.DeGracia DJ, Neumar RW, White BC, Krause GS. Global brain ischemia and reperfusion: modifications in eukaryotic initiation factors associated with inhibition of translation initiation. J Neurochem. 1996;67(5):2005–12. doi: 10.1046/j.1471-4159.1996.67052005.x. [DOI] [PubMed] [Google Scholar]
- 40.Dash PK, Johnson D, Clark J, Orsi SA, Zhang M, Zhao J, et al. Involvement of the glycogen synthase kinase-3 signaling pathway in TBI pathology and neurocognitive outcome. PLoS One. 2011;6(9):e24648. doi: 10.1371/journal.pone.0024648. [DOI] [PMC free article] [PubMed] [Google Scholar]
- 41.Redell JB, Moore AN, Grill RJ, Jr, Johnson D, Zhao J, Liu Y, et al. Analysis of Functional Pathways Altered Following Mild Traumatic Brain Injury. J Neurotrauma. 2012 doi: 10.1089/neu.2012.2437. [DOI] [PMC free article] [PubMed] [Google Scholar]
- 42.Hua F, Wang J, Ishrat T, Wei W, Atif F, Sayeed I, et al. Genomic profile of Toll-like receptor pathways in traumatically brain-injured mice: effect of exogenous progesterone. J Neuroinflammation. 2011;8:42. doi: 10.1186/1742-2094-8-42. [DOI] [PMC free article] [PubMed] [Google Scholar]
- 43.Hernandez-Ortega K, Quiroz-Baez R, Arias C. Cell cycle reactivation in mature neurons: a link with brain plasticity, neuronal injury and neurodegenerative diseases? Neurosci Bull. 2011;27(3):185–96. doi: 10.1007/s12264-011-1002-z. [DOI] [PMC free article] [PubMed] [Google Scholar]
- 44.Wang W, Bu B, Xie M, Zhang M, Yu Z, Tao D. Neural cell cycle dysregulation and central nervous system diseases. Prog Neurobiol. 2009;89(1):1–17. doi: 10.1016/j.pneurobio.2009.01.007. [DOI] [PubMed] [Google Scholar]
- 45.Rashidian J, Iyirhiaro GO, Park DS. Cell cycle machinery and stroke. Biochim Biophys Acta. 2007;1772(4):484–93. doi: 10.1016/j.bbadis.2006.11.009. [DOI] [PubMed] [Google Scholar]
- 46.Becker EB, Bonni A. Cell cycle regulation of neuronal apoptosis in development and disease. Prog Neurobiol. 2004;72(1):1–25. doi: 10.1016/j.pneurobio.2003.12.005. [DOI] [PubMed] [Google Scholar]
- 47.Di Giovanni S, Movsesyan V, Ahmed F, Cernak I, Schinelli S, Stoica B, et al. Cell cycle inhibition provides neuroprotection and reduces glial proliferation and scar formation after traumatic brain injury. Proc Natl Acad Sci U S A. 2005;102(23):8333–8. doi: 10.1073/pnas.0500989102. [DOI] [PMC free article] [PubMed] [Google Scholar]
- 48.O’Hare M, Wang F, Park DS. Cyclin-dependent kinases as potential targets to improve stroke outcome. Pharmacol Ther. 2002;93(2–3):135–43. doi: 10.1016/S0163-7258(02)00183-3. [DOI] [PubMed] [Google Scholar]
- 49.Rashidian J, Iyirhiaro G, Aleyasin H, Rios M, Vincent I, Callaghan S, et al. Multiple cyclin-dependent kinases signals are critical mediators of ischemia/hypoxic neuronal death in vitro and in vivo. Proc Natl Acad Sci U S A. 2005;102(39):14080–5. doi: 10.1073/pnas.0500099102. [DOI] [PMC free article] [PubMed] [Google Scholar]
- 50.Kabadi SV, Stoica BA, Byrnes KR, Hanscom M, Loane DJ, Faden AI. Selective CDK inhibitor limits neuroinflammation and progressive neurodegeneration after brain trauma. J Cerebral Blood Flow Metabolism. 2012;32(1):137–49. doi: 10.1038/jcbfm.2011.117. [DOI] [PMC free article] [PubMed] [Google Scholar]
- 51.Kabadi SV, Stoica BA, Hanscom M, Loane DJ, Kharebava G, Murray Ii MG, et al. CR8, a selective and potent CDK inhibitor, provides neuroprotection in experimental traumatic brain injury. Neurotherapeutics. 2012;9(2):405–21. doi: 10.1007/s13311-011-0095-4. [DOI] [PMC free article] [PubMed] [Google Scholar]
- 52.Tian DS, Xie MJ, Yu ZY, Zhang Q, Wang YH, Chen B, et al. Cell cycle inhibition attenuates microglia induced inflammatory response and alleviates neuronal cell death after spinal cord injury in rats. Brain Res. 2007;1135(1):177–85. doi: 10.1016/j.brainres.2006.11.085. [DOI] [PubMed] [Google Scholar]
- 53.Cernak I, Stoica B, Byrnes KR, Di Giovanni S, Faden AI. Role of the cell cycle in the pathobiology of central nervous system trauma. Cell Cycle. 2005;4(9):1286–93. doi: 10.4161/cc.4.9.1996. [DOI] [PubMed] [Google Scholar]
- 54.Appert-Collin A, Hugel B, Levy R, Niederhoffer N, Coupin G, Lombard Y, et al. Cyclin dependent kinase inhibitors prevent apoptosis of postmitotic mouse motoneurons. Life Sci. 2006;79(5):484–90. doi: 10.1016/j.lfs.2006.01.032. [DOI] [PubMed] [Google Scholar]
- 55.Park DS, Farinelli SE, Greene LA. Inhibitors of cyclin-dependent kinases promote survival of post-mitotic neuronally differentiated PC12 cells and sympathetic neurons. J Biol Chem. 1996;271(14):8161–9. doi: 10.1074/jbc.271.14.8161. [DOI] [PubMed] [Google Scholar]
- 56.Meikrantz W, Schlegel R. Suppression of apoptosis by dominant negative mutants of cyclin-dependent protein kinases. J Biol Chem. 1996;271(17):10205–9. doi: 10.1074/jbc.271.17.10205. [DOI] [PubMed] [Google Scholar]
- 57.Meikrantz W, Gisselbrecht S, Tam SW, Schlegel R. Activation of cyclin A-dependent protein kinases during apoptosis. Proc Natl Acad Sci U S A. 1994;91(9):3754–8. doi: 10.1073/pnas.91.9.3754. [DOI] [PMC free article] [PubMed] [Google Scholar]
- 58.Kabadi SV, Stoica BA, Loane DJ, Byrnes KR, Hanscom M, Cabatbat RM, et al. Cyclin D1 gene ablation confers neuroprotection in traumatic brain injury. J Neurotrauma. 2012;29(5):813–27. doi: 10.1089/neu.2011.1980. [DOI] [PMC free article] [PubMed] [Google Scholar]
- 59.Ji Y, Xiao F, Sun L, Qin J, Shi S, Yang J, et al. Increased expression of CDK11p58 and cyclin D3 following spinal cord injury in rats. Mol Cell Biochem. 2008;309(1–2):49–60. doi: 10.1007/s11010-007-9642-z. [DOI] [PubMed] [Google Scholar]
- 60.Shi J, Hershey JW, Nelson MA. Phosphorylation of the eukaryotic initiation factor 3f by cyclin-dependent kinase 11 during apoptosis. FEBS Lett. 2009;583(6):971–7. doi: 10.1016/j.febslet.2009.02.028. [DOI] [PMC free article] [PubMed] [Google Scholar]
- 61.Masutani M, Sonenberg N, Yokoyama S, Imataka H. Reconstitution reveals the functional core of mammalian eIF3. EMBO J. 2007;26(14):3373–83. doi: 10.1038/sj.emboj.7601765. [DOI] [PMC free article] [PubMed] [Google Scholar]
- 62.Golsteyn RM. Cdk1 and Cdk2 complexes (cyclin dependent kinases) in apoptosis: a role beyond the cell cycle. Cancer Lett. 2005;217(2):129–38. doi: 10.1016/j.canlet.2004.08.005. [DOI] [PubMed] [Google Scholar]
- 63.Nguyen MD, Mushynski WE, Julien JP. Cycling at the interface between neurodevelopment and neurodegeneration. Cell Death Differ. 2002;9(12):1294–306. doi: 10.1038/sj.cdd.4401108. [DOI] [PubMed] [Google Scholar]
- 64.Natale JE, Ahmed F, Cernak I, Stoica B, Faden AI. Gene expression profile changes are commonly modulated across models and species after traumatic brain injury. J Neurotrauma. 2003;20(10):907–27. doi: 10.1089/089771503770195777. [DOI] [PubMed] [Google Scholar]
- 65.Arifin MZ, Faried A, Shahib MN, Wiriadisastra K, Bisri T. Inhibition of activated NR2B gene- and caspase-3 protein-expression by glutathione following traumatic brain injury in a rat model. Asian J Neurosurgery. 2011;6(2):72–7. doi: 10.4103/1793-5482.92160. [DOI] [PMC free article] [PubMed] [Google Scholar]
- 66.Shojo H, Kaneko Y, Mabuchi T, Kibayashi K, Adachi N, Borlongan CV. Genetic and histologic evidence implicates role of inflammation in traumatic brain injury-induced apoptosis in the rat cerebral cortex following moderate fluid percussion injury. Neuroscience. 2010;171(4):1273–82. doi: 10.1016/j.neuroscience.2010.10.018. [DOI] [PubMed] [Google Scholar]
- 67.Jones LL, Liu Z, Shen J, Werner A, Kreutzberg GW, Raivich G. Regulation of the cell adhesion molecule CD44 after nerve transection and direct trauma to the mouse brain. J Comp Neurol. 2000;426(3):468–92. doi: 10.1002/1096-9861(20001023)426:3<468::AID-CNE9>3.0.CO;2-I. [DOI] [PubMed] [Google Scholar]
- 68.Sandhir R, Berman NE. Age-dependent response of CCAAT/enhancer binding proteins following traumatic brain injury in mice. Neurochem Int. 2010;56(1):188–93. doi: 10.1016/j.neuint.2009.10.002. [DOI] [PMC free article] [PubMed] [Google Scholar]
- 69.Zhang X, Chen Y, Ikonomovic MD, Nathaniel PD, Kochanek PM, Marion DW, et al. Increased phosphorylation of protein kinase B and related substrates after traumatic brain injury in humans and rats. J Cereb Blood Flow Metab. 2006;26(7):915–26. doi: 10.1038/sj.jcbfm.9600238. [DOI] [PubMed] [Google Scholar]
- 70.Wu X, Jin W, Liu X, Fu H, Gong P, Xu J, et al. Cyclic AMP response element modulator-1 (CREM-1) involves in neuronal apoptosis after traumatic brain injury. J Mol Neurosci. 2012;47(2):357–67. doi: 10.1007/s12031-012-9761-1. [DOI] [PubMed] [Google Scholar]
- 71.Thomsen GM, Le Belle JE, Harnisch JA, Mc Donald WS, Hovda DA, Sofroniew MV, et al. Traumatic brain injury reveals novel cell lineage relationships within the subventricular zone. Stem Cell Res. 2014;13(1):48–60. doi: 10.1016/j.scr.2014.04.013. [DOI] [PMC free article] [PubMed] [Google Scholar]
- 72.Tate CC, Garcia AJ, LaPlaca MC. Plasma fibronectin is neuroprotective following traumatic brain injury. Exp Neurol. 2007;207(1):13–22. doi: 10.1016/j.expneurol.2007.05.008. [DOI] [PubMed] [Google Scholar]
- 73.Sharp JW, Sagar SM, Hisanaga K, Jasper P, Sharp FR. The NMDA receptor mediates cortical induction of fos and fos-related antigens following cortical injury. Exp Neurol. 1990;109(3):323–32. doi: 10.1016/S0014-4886(05)80023-8. [DOI] [PubMed] [Google Scholar]
- 74.Michael DB, Byers DM, Irwin LN. Gene expression following traumatic brain injury in humans: analysis by microarray. J Clin Neurosci. 2005;12(3):284–90. doi: 10.1016/j.jocn.2004.11.003. [DOI] [PubMed] [Google Scholar]
- 75.Lotocki G, Alonso OF, Dietrich WD, Keane RW. Tumor necrosis factor receptor 1 and its signaling intermediates are recruited to lipid rafts in the traumatized brain. J Neurosci. 2004;24(49):11010–6. doi: 10.1523/JNEUROSCI.3823-04.2004. [DOI] [PMC free article] [PubMed] [Google Scholar]
- 76.Hong Y, Yan W, Chen S, Sun CR, Zhang JM. The role of Nrf2 signaling in the regulation of antioxidants and detoxifying enzymes after traumatic brain injury in rats and mice. Acta Pharmacol Sin. 2010;31(11):1421–30. doi: 10.1038/aps.2010.101. [DOI] [PMC free article] [PubMed] [Google Scholar]
- 77.Strauss KI, Barbe MF, Marshall RM, Raghupathi R, Mehta S, Narayan RK. Prolonged cyclooxygenase-2 induction in neurons and glia following traumatic brain injury in the rat. J Neurotrauma. 2000;17(8):695–711. doi: 10.1089/089771500415436. [DOI] [PMC free article] [PubMed] [Google Scholar]
- 78.Dziennis S, Alkayed NJ. Role of signal transducer and activator of transcription 3 in neuronal survival and regeneration. Rev Neurosci. 2008;19(4–5):341–61. doi: 10.1515/revneuro.2008.19.4-5.341. [DOI] [PMC free article] [PubMed] [Google Scholar]
- 79.Wu H, Lu D, Jiang H, Xiong Y, Qu C, Li B, et al. Increase in phosphorylation of Akt and its downstream signaling targets and suppression of apoptosis by simvastatin after traumatic brain injury. J Neurosurg. 2008;109(4):691–8. doi: 10.3171/JNS/2008/109/10/0691. [DOI] [PMC free article] [PubMed] [Google Scholar]
- 80.Raghupathi R, Muir JK, Fulp CT, Pittman RN, McIntosh TK. Acute activation of mitogen-activated protein kinases following traumatic brain injury in the rat: implications for posttraumatic cell death. Exp Neurol. 2003;183(2):438–48. doi: 10.1016/S0014-4886(03)00166-3. [DOI] [PubMed] [Google Scholar]
- 81.Zheng W, Zhuge Q, Zhong M, Chen G, Shao B, Wang H, et al. Neurogenesis in Adult Human Brain after Traumatic Brain Injury. J Neurotrauma. 2011 doi: 10.1089/neu.2010.1579. [DOI] [PMC free article] [PubMed] [Google Scholar]
- 82.Saha RN, Ghosh A, Palencia CA, Fung YK, Dudek SM, Pahan K. TNF-alpha preconditioning protects neurons via neuron-specific up-regulation of CREB-binding protein. J Immunol. 2009;183(3):2068–78. doi: 10.4049/jimmunol.0801892. [DOI] [PMC free article] [PubMed] [Google Scholar]
- 83.Datta A, Jingru Q, Khor TH, Teo MT, Heese K, Sze SK. Quantitative neuroproteomics of an in vivo rodent model of focal cerebral ischemia/reperfusion injury reveals a temporal regulation of novel pathophysiological molecular markers. J Proteome Res. 2011;10(11):5199–213. doi: 10.1021/pr200673y. [DOI] [PubMed] [Google Scholar]
- 84.Wainwright MS, Brennan LA, Dizon ML, Black SM. p21ras activation following hypoxia-ischemia in the newborn rat brain is dependent on nitric oxide synthase activity but p21ras does not contribute to neurologic injury. Brain Res Dev Brain Res. 2003;146(1–2):79–85. doi: 10.1016/j.devbrainres.2003.09.012. [DOI] [PubMed] [Google Scholar]
- 85.Liu Y, Hou XY, Zhang GY, Xu TL. L-type voltage-gated calcium channel attends regulation of tyrosine phosphorylation of NMDA receptor subunit 2A induced by transient brain ischemia. Brain Res. 2003;972(1–2):142–8. doi: 10.1016/S0006-8993(03)02519-8. [DOI] [PubMed] [Google Scholar]
- 86.Qiu Z, Norflus F, Singh B, Swindell MK, Buzescu R, Bejarano M, et al. Sp1 is up-regulated in cellular and transgenic models of Huntington disease, and its reduction is neuroprotective. J Biol Chem. 2006;281(24):16672–80. doi: 10.1074/jbc.M511648200. [DOI] [PubMed] [Google Scholar]
- 87.Chang YW, Goff LA, Li H, Kane-Goldsmith N, Tzatzalos E, Hart RP, et al. Rapid induction of genes associated with tissue protection and neural development in contused adult spinal cord after radial glial cell transplantation. J Neurotrauma. 2009;26(7):979–93. doi: 10.1089/neu.2008.0762. [DOI] [PMC free article] [PubMed] [Google Scholar]
- 88.Kochanek PM, Berger RP, Bayir H, Wagner AK, Jenkins LW, Clark RS. Biomarkers of primary and evolving damage in traumatic and ischemic brain injury: diagnosis, prognosis, probing mechanisms, and therapeutic decision making. Curr Opin Crit Care. 2008;14(2):135–41. doi: 10.1097/MCC.0b013e3282f57564. [DOI] [PubMed] [Google Scholar]
- 89.Li HH, Lee SM, Cai Y, Sutton RL, Hovda DA. Differential gene expression in hippocampus following experimental brain trauma reveals distinct features of moderate and severe injuries. J Neurotrauma. 2004;21(9):1141–53. doi: 10.1089/0897715041953777. [DOI] [PubMed] [Google Scholar]