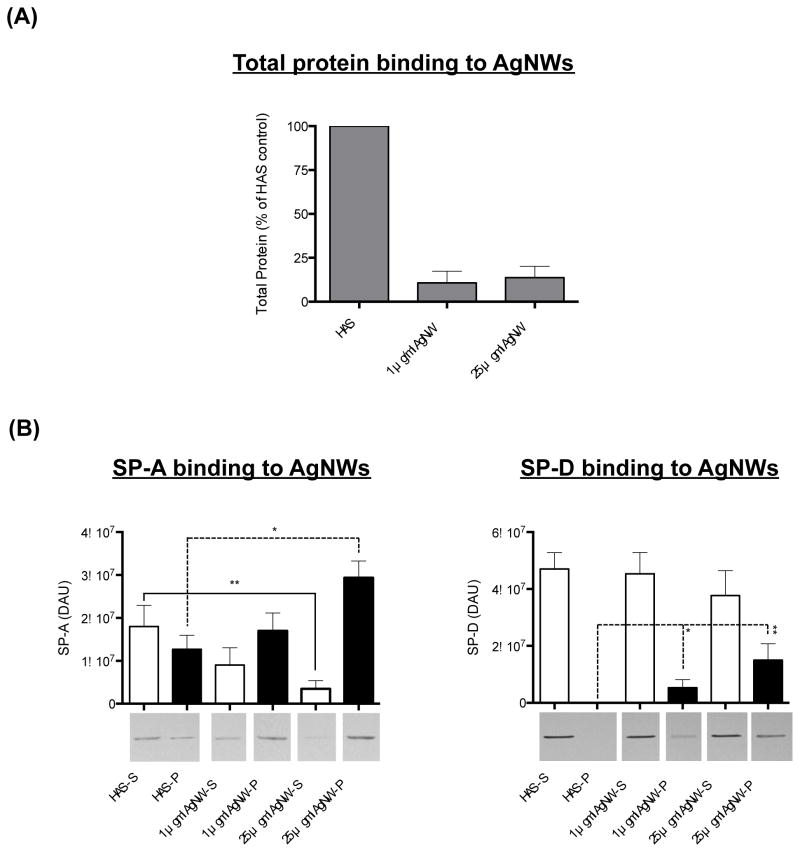
Figure 2.
Total HAS protein and SP-A/SP-D protein binding to AgNWs. Proportion of total protein available in HAS, bound to 1 and 25 μg/ml AgNW (A). Amount of SP-A and SP-D protein bound to 1 and 25 μg/ml AgNW (B). The amount of SP-A or SP-D in the pellet (P) and the amount of SP-A or SP-D in the corresponding supernatant (S) is shown following centrifugation, in the absence and presence of AgNWs.

