

Abstract
Phenome-Wide Association Studies (PheWAS) comprehensively investigate the association between genetic variation and a wide array of outcome traits. Electronic health record (EHR) based PheWAS uses various abstractions of International Classification of Diseases, Ninth Revision (ICD-9) codes to identify case/control status for diagnoses that are used as the phenotypic variables. However, there have not been comparisons within a PheWAS between results from high quality derived phenotypes and high-throughput but potentially inaccurate use of ICD-9 codes for case/control definition. For this study we first developed a group of high quality algorithms for five phenotypes. Next we evaluated the association of these “gold standard” phenotypes and 4,636,178 genetic variants with minor allele frequency > 0.01 and compared the results from high-throughput associations at the 3 digit, 5 digit, and PheWAS codes for defining case/control status. We found that certain diseases contained similar patient populations across phenotyping methods but had differences in PheWAS.
Introduction
Phenome-Wide Association Studies (PheWAS) are used to investigate the association between a collection of genetic variants and a wide and diverse range of phenotypes, diagnoses, traits, and/or outcomes1. PheWAS highlight novel connections between multiple phenotypes and can elucidate more of the phenotype-genotype landscape as well as generate new hypotheses for further exploration. The complex results of PheWAS also have the potential for uncovering new mechanistic insights. Electronic health record (EHR) data coupled with genetic data have been used repeatedly for PheWAS. For example, through the Electronic Medical Records and Genomics (eMERGE) network2, EHR based International Classification of Diseases, Ninth Revision (ICD-9) codes have been used to establish case/control status for identifying significant associations between medical record diagnoses and genetic data3–6, including using datasets from the Geisinger Health System (GHS) MyCode™ biorepository7. Each PheWAS has shown the ability to replicate previously reported associations, clearly showing that the high-throughput PheWAS approach is valid as well as identifying hypothesis-generating novel associations.
EHR based PheWAS have used various methods of grouping and counting ICD-9 codes to define case/control status for analyses. For example, there are three digit ICD-9 codes that specify disease categories (e.g. code 405 for “secondary hypertension”) that can be further subdivided using multiple four or five digit sub ICD-9 codes (e.g. 405.1 for “benign secondary hypertension”, 405.11 “benign renovascular hypertension”), that are more specific. The most common methods of defining case/control status using EHR data include grouping ICD-9 codes by three digits (e.g. 250.02 rolls up to 250), five digits (e.g. 250.02 stays 250.02)7, and “PheWAS Codes”8. The choice of which patients to consider a case or control based on their number of instances of a given code and who should be excluded (not classified as case or control) for a code has varied depending on the study. For example, one approach defines case status by requiring three or more instances of a given code per individual (rule of three), considering those with no instances of the code a control, and one or two instances of a code are excluded from further analysis. PheWAS Codes (http://phewas.mc.vanderbilt.edu/) go a step further by collapsing and grouping ICD-9 codes that are highly related and expanding the exclusion of individuals based on ICD-9 codes with revisions based on code frequency and human review.
Case and control status based on the presence of an ICD-9 code has been one of the most accessible forms of EHR-based high-throughput phenotypes allowing researchers to look for known and novel associations across a very broad range of phenotypes. This can be attributed to the fact that the phenotype definitions can be easily applied across the spectrum of ICD-9 codes and results are more easily compared to other EHR based PheWAS. These methods have limitations, however; the positive and negative predictive values (PPV/NPV) vary greatly from phenotype to phenotype. For example a single diagnosis of myocardial infarction is highly predictive9 whereas a single diagnosis of stroke is not highly predictive10.
While existing studies have demonstrated that PheWAS is a viable method to identifying genome/phenome associations which replicate well known associations, the measurement of EHR based PheWAS success have been focused on known associations and not a comparison of the phenotype definitions themselves. Thus, for this study, using the Geisinger Health System MyCode™ Biorepository, we identified ICD-9 code based case/control status using multiple methods. We then compared the results of the existing phenotype algorithms case/control status to high-quality algorithmically defined EHR phenotypes (“gold standard”) case/control status for type 2 diabetes (T2DM), acute coronary syndrome (ACS), non-obstructive coronary artery disease (CAD), obstructive CAD, and obesity. Finally, we performed a genome-wide association study for each phenotype and contrasted highly significant results of these GWAS with association results from performing PheWAS using different ICD-9 code based case/control definitions.
Methods
Study Participants
The MyCode dataset had a total of 3,022 individuals available with both phenotypic and genotypic data for this study. Because the majority of subjects were of European ancestry (EA), only EA subjects were selected for these analyses.
Gold Standard Algorithmically Defined Phenotypes
Five phenotype algorithms developed within Geisinger Health System with a high PPV/NPV (≥ 95%) were selected to compare to the phenotype definitions from various approaches for identifying case/control status based only on ICD-9 codes. These phenotype algorithms are considered to be “gold-standard” because of their high PPV. The algorithms for these gold standard phenotypes incorporate EHR data (labs, meds, procedures, etc.) and temporality in addition to ICD-9 codes used in traditional PheWAS phenotyping. Table 1 illustrates the different types of data used in the gold standard phenotypes and shows the gold-standard phenotype overlaps with ICD-9 codes for different ICD-9 code levels/abstractions. The asterisks (*) in the table refer to a wildcard operator which would indicate any digit (0–9) included in the range.
Table 1.
Algorithmically Defined Phenotypes of This Study and Matched ICD-9 Based Diagnoses
| Phenotype | Data Entities Used in Gold Standard Algorithm | PheWAS Codes | 3 Digit | 5 Digit |
|---|---|---|---|---|
| Type II Diabetes Mellitus | ICD-9 Codes, Medications, Laboratory Results | 250.2 | 250* | 250.*0, 250.*2 |
| Acute Coronary Syndrome | ICD-9 Codes, Laboratory Results, Cardiac Catheterization Results, Radiology Results, ECG Results | 411, 411.2, 411.4, 411.9 | 410*, 411* | 410.*, 411.1 |
| Non-Obstructive Coronary Artery Disease | ICD-9 Codes, Laboratory Results, Procedures, Interventional Radiology Results | 411, 411.3 | 413* | 413.* |
| Obesity | ICD-9 Codes, Laboratory Results, Procedures, Interventional Radiology Results | 278.*, 513.* | 278.* | 278.* |
| Obstructive Coronary Artery Disease | ICD-9 Codes, Laboratory Results, Procedures, Interventional Radiology Results | 411, 411.3 | 413* | 413.* |
At Geisinger Health System, data for creating phenotype algorithms are extracted from Geisinger’s Clinical Decision Intelligence System (CDIS), an enterprise data warehouse, additionally supplemented data from the Department of Cardiology. CDIS is updated every 24 hours with feeds from multiple source systems, including the EHR, tumor registry, financial decision support, claims, patient satisfaction and high-use third-party reference datasets. The source data are transformed through a complex “Extract-Transform-Load” (ETL) process. Laboratory results, medications, procedures, past medical history, and encounter setting are often key components of validated phenotypes and help to improve PPV/NPV.
Phenotype algorithm development is a very iterative process that incorporates input from researchers, clinicians, clinical support staff, and Information Technology (IT) teams to understand how and why data was captured at the point of care in order to inform algorithm development. Programmer/Analysts in the Phenomic-Analytics and Clinical Data Core (P-ACDC) use existing methods of phenotyping and expand the process to allow for increased iteration and validation. First, analysts receive input from the members of the research team to determine if all data needed for the phenotype exists in the data warehouse and if not, the analyst will work with IT staff to incorporate that data into CDIS. Once complete data is obtained to define a phenotype, the algorithm is developed. Using the algorithm, one hundred positive (cases) and 100 negative patients (controls) for that phenotype are identified, and an analyst reviews the clinical records to validate the algorithm and calculate the PPV/NPV. If the predictive values are below desired levels (ie, < 85%), the analyst will identify areas of improvement, modify the algorithm, and repeat the validation process until desired results are achieved.
All attributes of the validated phenotypes are saved as value sets (terminology) and business rules (setting, timing, etc.). The collection of value sets and business rules is based on existing processes and repositories so that phenotypes can be consumed and shared across organizations. The National Library of Medicine (NLM) Value Set Authority Center (VSAC) (https://vsac.nlm.nih.gov/), the Center for Disease Control and Prevention (CDC) Public Health Information Network Vocabulary Access Distribution System (PHIN VADS) (http://www.cdc.gov/phin/tools/PHINvads/index.html), Phenotype Knowledge Base (PheKB) (https://phekb.org/), and PhenotypePortal (http://phenotypeportal.org/) are well known national standards for consuming and authoring value sets and business rules.
Matching ICD-9 Based Phenotypes to Gold Standard Phenotypes
ICD-9 codes from the MyCode participants EHR that also had genotypic data were used for this study. For our 3 digit and 5 digit PheWAS analyses, case status was defined as having ≥ 3 visits per individual, zero instances of an ICD-9 code to be considered a control. Individuals between 0 and 3 instances of a code (i.e., 1–2 visits) were omitted from the analyses for that code. At least ten case subjects per ICD-9 code to retain that ICD-9 code in association testing was required.
Genotypic Data and Quality Control
GHS MyCode subjects were genotyped using the Illumina HumanOmniExpress-12 v1.0 array a total of 729,078 SNPs. Imputation was used to improve genomic coverage of the datasets. The imputation was performed using the IMPUTE2 algorithm after phasing with SHAPEIT211 using the 1,000 Genomes cosmopolitan reference panel, resulting in a total of 38,054,243 SNPs in 3,111 samples for MyCode12. Genotype Quality Control (QC) procedures were performed prior to association testing using the R programming statistical package13 and PLINK software14. The first step was to filter out the SNPs with poor imputation quality; SNPs with imputation quality scores > 0.9 were used for further analyses. Data were filtered further for 99% genotype and sample call rates and minor allele frequency (MAF) threshold of 1%. Also, related samples were removed using Identity by Descent (IBD) kinship coefficient estimates. After QC, the genotypic data consisted of 4,636,178 SNPs and 3,022 samples with both phenotypic and genotypic data from MyCode.
Association Testing
Logistic regression with an additive encoding for the SNPs was used to evaluate the association between SNPs and the gold standard phenotypes. For each association, models were adjusted for decade of birth and sex. Association results were filtered for p-values < 1×10⁻⁴, to focus further analyses on highly significant results associated with the gold standard variables. Results were annotated using Biofilter15, to add information about any genes that the SNPs were in or near, as well as to annotate the SNPs with any known results from the NHGRI GWAS catalog16. The NHGRI GWAS catalog contains results from published GWAS in the literature reaching genome-wide significance. Next, a PheWAS was performed using all SNPs identified through the previous step with p < 1×10⁻⁴. As described above, logistic regression with an additive encoding of the SNPs was used while controlling for decade of birth and sex. This was performed at the 3 digit and 5 digit ICD-9 code diagnosis level, and with PheWAS codes. Results for the association testing were plotted using GGPlot217 and PheWAS-View18 software.
Results
Comparing Case and Control Status: Gold Standard Phenotypes and ICD-9 Methods
After patients were classified as either a case or control using the various methods a comparison was conducted to demonstrate the overlap existing between the defined case/controls sets according to each method (Table 2). Not surprisingly, it was found that the methods agree in some areas and not in others. For example, T2DM was very closely matched across all of the methods (Figure 1) and obesity showed a large overlap (Figure 2) using diagnosis codes but incorporating vital measurements in the gold standard picked up additional patients that were otherwise missed. The cardiovascular phenotypes did not show agreement between the 3-digit and 5-digit code methods with the gold standard because of the inherent lack of information in the ICD-9 codes themselves. Using results from the cardiac catheterization laboratory and elevated biomarkers helps to appropriately classify the disease state. Overall, evaluating the absolute value of the difference in the number of cases according to the gold standard definition with that of PheWAS Codes, 3 digit codes, and 5 digit codes, it is observed that 3 digit and 5 digit codes have the closest case counts to the gold standard in all phenotypes except for obesity. To better understand the various case classifications, Venn diagrams were used to show the differences in actual patient overlap, not just absolute count.
Table 2.
Counts of patients identified by phenotype method.
| Phenotype | Gold Standard | PheWAS Code | 3 digit | 5 digit |
|---|---|---|---|---|
| T2DM | 1012 | 1029 | 1033 | 1024 |
| ACS | 158 | 870 | 129 | 74 |
| Non-Obstructive CAD | 208 | 870 | 134 | 134 |
| Obesity | 1741 | 1334 | 1321 | 1283 |
| Obstructive CAD | 315 | 870 | 134 | 134 |
Figure 1.
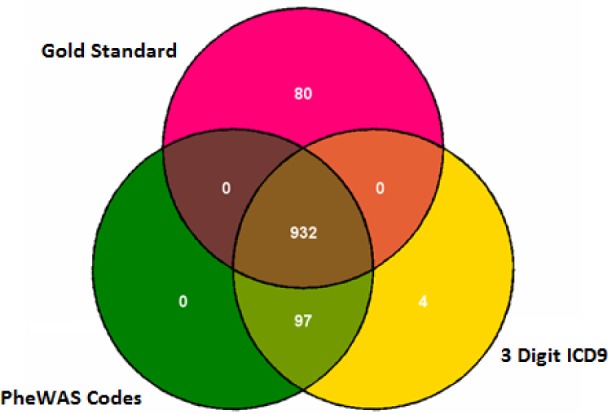
Venn diagram demonstrating the overlap of cases by phenotype method for T2DM
Figure 2.
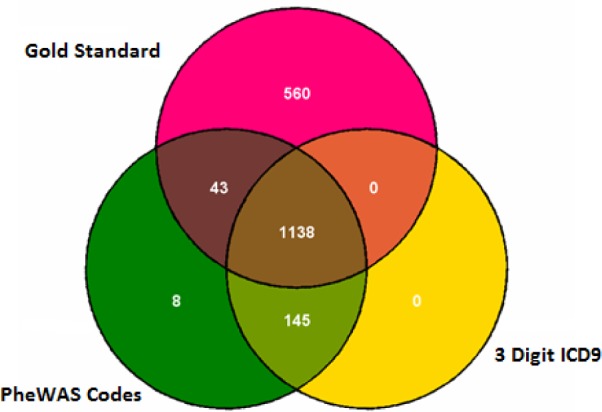
Venn diagram demonstrating the overlap of cases by phenotype method for Obesity
Comparing Association Results between Gold Standard Phenotypes and ICD-9 Code Based PheWAS
A total of 2,585 SNPs passed the p-value cutoff for the gold-standard phenotypes. Eight of these SNPs were present in the NHGRI GWAS Catalog. Those SNPs significantly associated with gold-standard phenotype at p-value > 1×10⁻⁴ were evaluated by performing a PheWAS with the ICD-9 codes at 3 digit, 5 digit diagnosis level, and PheWAS code level. Table 3 shows the average p-value of the gold standard associations passing our p-value cutoff, and what the maximum p-value was. Table 3 also shows for each gold standard phenotype the number of associations with p < 1×10⁻⁴ matching the same SNP-phenotype gold association. Note, more than one ICD-9 code corresponds to some of the gold standard phenotypes (Table 1), thus matches were only counted once when they occurred. The results of the PheWAS using different ways to define case control status recapitulate what was observed in the case/control definition comparisons of Table 2. For phenotypes where the ICD-9 codes offer more specific or appropriate terminology about a diagnosis, such as with T2DM, there is a better match in associations identified through PheWAS. For phenotypes poorly represented in ICD-9 code terminology compared to high-quality algorithmic development using multiple inclusion and exclusion criteria, the number of associations repeated in PheWAS compared to gold standard results is reduced, particularly in ACS.
Table 3.
Range of gold standard p-value results and number of associations for the same SNP and phenotype matched across three methods of defining ICD-9 case/control status.
| Phenotype | Gold p-value avg | Gold p-value max | Number Gold Phenotype SNPs | Matched PheWAS Code Associations | Matched 5 Digit Associations | Matched 3 Digit Associations |
|---|---|---|---|---|---|---|
| T2DM | 5.33E-05 | 1.00E-04 | 563 | 559 | 558 | 562 |
| ACS | 5.17E-05 | 9.99E-05 | 399 | 13 | 19 | 4 |
| Non-Obstructive CAD | 3.80E-05 | 9.97E-05 | 738 | 114 | 76 | 76 |
| Obesity | 5.03E-05 | 9.99E-05 | 310 | 109 | 149 | 90 |
| Obstructive CAD | 5.14E-05 | 1.00E-04 | 721 | 159 | 22 | 22 |
Also, of note, while PheWAS Codes had higher case numbers than the algorithms for CAD, this did not result in more overlap in associations with the gold standard associations when compared to the 5-digit and 3-digit approaches. Ranges of p-values for associations where there was the same SNP from the gold standard phenotype and a matching ICD-9 code from Table 1 were evaluated and shown in Table 4. Depending on the gold standard phenotype, one case/control approach (PheWAS codes, 5 digit, and 3 digit) performs better than another method, however the differences are mostly minimal across the definitions of case/control status. While the case numbers can be lower for ICD-9 codes compared to gold standard algorithms, which can affect power to detect associations, there will also be more individuals incorrectly defined as cases and controls when using ICD-9 based case/control definitions alone. As a result, this will impact the ability to detect significant associations, as well as the degree of the significance of the association. Supplementary materials have containing all the individual association results used for Table 3 and 4 are located online: https://ritchielab.psu.edu/publications/supplementary-data/amia-phewas.
Table 4.
The range of p-values (minimum, average, maximum) for associations matching the same SNP and gold-standard defined phenotype across three methods of defining case/control status.
| Phenotype | Phecode p-value min | Phecode p-value avg | Phecode p-value max | 5 Digit p-value min | 5 Digit p-value avg | 5 Digit p-value max | 3 Digit p-value min | 3 Digit p-value avg | 3 Digit p-value max |
|---|---|---|---|---|---|---|---|---|---|
| T2DM | 1.01E-04 | 7.54E-04 | 9.81E-05 | 1.01E-04 | 7.54E-04 | 9.87E-05 | 1.00E-04 | 6.84E-04 | 9.80E-05 |
| ACS | 2.54E-04 | 5.88E-03 | 9.25E-03 | 1.16E-03 | 3.54E-03 | 9.10E-03 | 5.10E-04 | 3.28E-03 | 8.38E-03 |
| Non-Obstr uctive CAD | 1.59E-04 | 2.60E-03 | 9.93E-03 | 1.86E-03 | 4.76E-03 | 7.88E-03 | 1.87E-03 | 4.80E-03 | 7.94E-03 |
| Obesity | 1.05E-04 | 3.72E-03 | 4.56E-05 | 1.21E-04 | 3.25E-03 | 9.77E-06 | 1.07E-04 | 3.87E-03 | 1.83E-05 |
| Obstructive CAD | 1.59E-04 | 3.21E-03 | 3.70E-05 | 1.38E-03 | 5.58E-03 | 9.38E-03 | 1.40E-03 | 5.67E-03 | 9.51E-03 |
Variability in the identification and significance of associations was observed across the various methods of defining case/control status definitions when compared to the results using gold standard phenotypes. Some of this variability may be due to shifting case identification; different ICD-9 approaches resulted in identifying different individuals. Interestingly, the study did not observe the 3 digit or PheWAS code approach as having the most significant results of the three approaches from SNP to SNP, even though there could have been increased power through increased case numbers. Three examples are shown (Figure 5–7) of single SNPs. and the results across three different methods for the phenotypes of obesity, non-obstructive and obstructive CAD, and T2DM. Larger versions of figures are available in the online supplementary materials. For all three of these SNPs the ICD-9 diagnoses most similar to these gold-standard phenotypes have a similar direction of effect of the association. Figures 5–7 illustrate the significance of association through ordering by most significant at the top of the figure with decreasing significance plotted clockwise. The length of the each line corresponds to the −log(p-value) of each result.
Figure 5.

Sun Plot of association results for SNP rs7127254, coded allele T, present across the three methods of identifying case/control status used for these analyses. This SNP was associated with the gold standard phenotype of obesity in our study with p-value 6.19×10⁻⁷, and the array of metabolic syndrome comorbidities also associated with SNP notable. The most significant association for this SNP was with the 5 digit ICD-9 of T2DM.
Figure 6.

Sun Plot of results for SNP rs2277251, coded allele T. This SNP was associated with the gold standard phenotype of T2DM with p-value 7.08×10⁻⁷. SNP-phenotype associations (p < 0.01) that were also present for this SNP across the 3 methods of identifying case/control status. The spectrum of other comorbidities related to T2DM also associated with this SNP is notable.
Figure 7.

Sun Plot of results for SNP rs10009355, coded allele T. This SNP was associated with the gold standard phenotype of obstructive CAD with p-value 8.24×10⁻⁷. SNP-phenotype associations (p < 0.01) that were also present for this SNP across the 3 methods of identifying case/control status. Additional comorbidities related to CAD are associated with this SNP.
Discussion
Studies have shown that PheWAS can be a viable method for identifying known and/or novel associations in phenotypes and genotypes for hypothesis generation. The current methods used to define phenotypes allow for simple application of business rules to define a wide range of diseases. Defining gold standard methods for phenotypes is a laborious task that cannot be reasonably applied to all diseases. Comparing these methods of defining phenotypes shows that there are certain diseases where using code based case methods agree with more complex phenotype algorithms (“gold standard”) while other diseases cannot use codes alone and require additional data from the EHR. For example, good agreement across the various methods was observed for T2DM, whereas ACS exhibited poor agreement due to the lack of specificity PheWAS codes.
For the gold-standard phenotypes, some associations were identified from previously published replicated results (annotated in the supplementary results of associations). The sample size was relatively small and thus the analysis had low power to identify new associations or replicate known associations. Therefore, for these exploratory analyses, a less stringent p-value cutoff of 1×10⁻⁴ was used and p-values for multiple testing were not corrected for. Future directions include exploring these analyses within a larger genetic dataset linked to EHR based phenotypic data as well as repeating these analyses with a “rule of one” applied, where the presence of an ICD-9 code will indicate an individual is a control, instead of the “rule of three” applied here. Requiring less instances of an ICD-9 code for case/status will increase the number of controls. For some ICD-9 codes this may increase the number of false-controls; however it may increase the power of associations for ICD-9 codes that are rare and unlikely to have been assigned to a patient incorrectly.
Additional research needs to be done to compare the positive and negative predictive value of the ICD-9 code based method phenotypes and compare the patient populations that do not agree to potentially identify additional methods that are generalizable and can be added broadly to phenotype definitions. In addition, comparing more gold standard phenotypes to code based approaches would help to identify disease areas that have a high degree of agreement between the simple and complex approaches. Collaborating with existing efforts such as eMERGE, VSAC, and PHIN VADS would allow comparison to be completed at a much larger scale and across multiple institutions. Machine learning approaches are also a next step in developing phenotypes that perhaps can be semi-automated.
Figure 3.
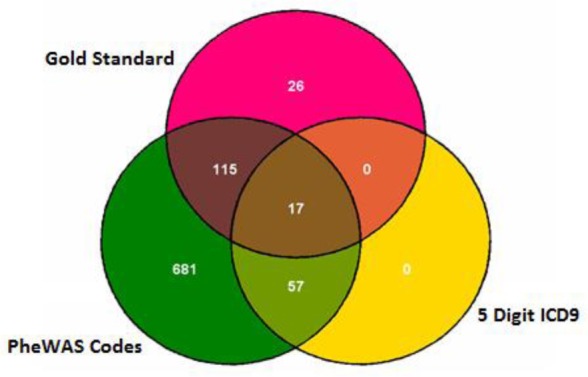
Venn diagram demonstrating the overlap of cases by phenotype method for ACS
Figure 4.

Manhattan-plots of all results. These are the results for the 5-digit ICD-9 code defined case/control diagnoses. Supplementary figures show the results for the 3-digit and PheWAS Code defined case/control status and are available online. The points in gold show the significance of the association result for the ICD-9 based diagnoses most similar to the gold-standard defined phenotype, for example the ICD-9 code 250.00 is the ICD-9 code for T2DM.
References
- 1.Pendergrass SA, Brown-Gentry K, Dudek SM, Torstenson ES, Ambite JL, Avery CL, et al. The use of phenome-wide association studies (PheWAS) for exploration of novel genotype-phenotype relationships and pleiotropy discovery. Genet Epidemiol. 2011 Jul;35(5):410–22. doi: 10.1002/gepi.20589. [DOI] [PMC free article] [PubMed] [Google Scholar]
- 2.Crawford DC, Crosslin DR, Tromp G, Kullo IJ, Kuivaniemi H, Hayes MG, et al. eMERGEing progress in genomics-the first seven years. Front Genet. 2014;5:184. doi: 10.3389/fgene.2014.00184. [DOI] [PMC free article] [PubMed] [Google Scholar]
- 3.Denny JC, Ritchie MD, Basford MA, Pulley JM, Bastarache L, Brown-Gentry K, et al. PheWAS: demonstrating the feasibility of a phenome-wide scan to discover gene-disease associations. Bioinformatics. 2010 May 1;26(9):1205–10. doi: 10.1093/bioinformatics/btq126. [DOI] [PMC free article] [PubMed] [Google Scholar]
- 4.Hebbring SJ, Schrodi SJ, Ye Z, Zhou Z, Page D, Brilliant MH. A PheWAS approach in studying HLA-DRB1*1501. Genes Immun. 2013 Apr;14(3):187–91. doi: 10.1038/gene.2013.2. [DOI] [PMC free article] [PubMed] [Google Scholar]
- 5.Namjou B, Marsolo K, Caroll RJ, Denny JC, Ritchie MD, Verma SS, et al. Phenome-wide association study (PheWAS) in EMR-linked pediatric cohorts, genetically links PLCL1 to speech language development and IL5-IL13 to Eosinophilic Esophagitis. Front Genet. 2014;5:401. doi: 10.3389/fgene.2014.00401. [DOI] [PMC free article] [PubMed] [Google Scholar]
- 6.Denny JC, Bastarache L, Ritchie MD, Carroll RJ, Zink R, Mosley JD, et al. Systematic comparison of phenome-wide association study of electronic medical record data and genome-wide association study data. Nat Biotechnol. 2013 Dec;31(12):1102–10. doi: 10.1038/nbt.2749. [DOI] [PMC free article] [PubMed] [Google Scholar]
- 7.Verma A, Kuivaniemi H, Tromp G, Carey DJ, Gerhard GS, Crowe JE, et al. Exploring the relationship between immune system related genetic variants and complex traits and disease through a Phenome-Wide Association Study. PheWAS; [DOI] [PMC free article] [PubMed] [Google Scholar]
- 8.Carroll RJ, Bastarache L, Denny JC. R PheWAS: data analysis and plotting tools for phenome-wide association studies in the R environment. Bioinformatics. 2014 Aug 15;30(16):2375–6. doi: 10.1093/bioinformatics/btu197. [DOI] [PMC free article] [PubMed] [Google Scholar]
- 9.Gottesman O, Kuivaniemi H, Tromp G, Faucett WA, Li R, Manolio TA, et al. The Electronic Medical Records and Genomics (eMERGE) Network: Past, Present and Future. Genet Med. 2013 Oct;15(10):761–71. doi: 10.1038/gim.2013.72. [DOI] [PMC free article] [PubMed] [Google Scholar]
- 10.Roumie CL, Mitchel E, Gideon PS, Varas-Lorenzo C, Castellsague J, Griffin MR. Validation of ICD-9 codes with a high positive predictive value for incident strokes resulting in hospitalization using Medicaid health data. Pharmacoepidem Drug Safe. 2008;17:20–26. doi: 10.1002/pds.1518. [DOI] [PubMed] [Google Scholar]
- 11.Pendergrass SA, Frase AT, Wallace JR, Wolfe D, Katiyar N, Moore CB, et al. Biofilter 2.0 – Using Biological Knowledge for Advanced Filtering, Annotation, and Model Development for Genomic Analysis. doi: 10.1186/1756-0381-6-25. [DOI] [PMC free article] [PubMed] [Google Scholar]
- 12.Verma SS, de Andrade M, Tromp G, Kuivaniemi H, Pugh E, Namjou-Khales B, et al. Imputation and Quality Control Steps for combining multiple genome-wide datasets. Journal of FRONT GENT. 2014;5:370. doi: 10.3389/fgene.2014.00370. [DOI] [PMC free article] [PubMed] [Google Scholar]
- 13.R Core Team . R: A language and environment for statistical computing. R Foundation for Statistical Computing; Vienna, Austria: 2015. URL http://www.R-project.org/. [Google Scholar]
- 14.Purcell S, Neale B, Todd-Brown K, Thomas L, Ferreira MAR, Bender D, et al. PLINK: a tool set for whole-genome association and population-based linkage analyses. Am J Hum Genet. 2007 Sep;81(3):559–75. doi: 10.1086/519795. [DOI] [PMC free article] [PubMed] [Google Scholar]
- 15.Pendergrass SA, Frase AT, Wallace JR, Wolfe D, Katiyar N, Moore CB, et al. Biofilter 2.0 – Using Biological Knowledge for Advanced Filtering, Annotation, and Model Development for Genomic Analysis. doi: 10.1186/1756-0381-6-25. [DOI] [PMC free article] [PubMed] [Google Scholar]
- 16.Hindorff LA, Sethupathy P, Junkins HA, Ramos EM, Mehta JP, Collins FS, et al. Potential etiologic and functional implications of genome-wide association loci for human diseases and traits. PNAS. 2009 Jun 9;106(23):9362–7. doi: 10.1073/pnas.0903103106. [DOI] [PMC free article] [PubMed] [Google Scholar]
- 17.Wickham H. ggplot2: elegant graphics for data analysis [Internet] Springer; New York: Available from: http://had.co.nz/ggplot2/book. [Google Scholar]
- 18.Pendergrass SA, Dudek SM, Crawford DC, Ritchie MD. Visually integrating and exploring high throughput Phenome-Wide Association Study (PheWAS) results using PheWAS-View. BioData Min. 2012;5(1):5. doi: 10.1186/1756-0381-5-5. [DOI] [PMC free article] [PubMed] [Google Scholar]