

Abstract
Utilization of patient-reported outcome measures (PROs) had been limited by the lack of psychometrically sound measures scored in real-time. The Patient Reported Outcomes Measurement Information System (PROMIS) initiative developed a broad array of high-quality PRO measures. Towards reducing the number of items administered in measuring PROs, PROMIS employs Item Response Theory (IRT) and Computer Adaptive Testing (CAT). By only administering questions targeted to the subject’s trait level, CAT has cut testing times in half1. The IRT/CAT implementation in PROMIS is unidimensional in that there is a separate set of questions administered for each measured trait. However, there are often correlations among traits. Multidimensional IRT (MIRT) and multidimensional CAT (MCAT) provide items concerning several correlated traits, and should ameliorate patient burden. We developed an MIRT model using existing PROMIS item banks for depression and anxiety, developed MCAT software, and compared the efficiency of the MCAT approach to the unidimensional approach.
Note: Research reported in this publication was supported in part by the National Library of Medicine of the National Institutes of Health under Award Number R01LM011962.
Introduction
There is increasing pressure for integration of the patient’s perspective in clinical research. An indication of this growth is the recent establishment of the Patient-Centered Outcomes Research Institute (PCORI) by Congress. PCORI’s goals include identifying the best available evidence to help patients and their healthcare providers make more informed decisions. Patient-reported outcomes (PROs) offer the patient’s perspective. The notion of the preeminence of the patient perspective has been prominent in literature for at least 20 years5–7. The research literature contains ample evidence for not relying solely on clinician reporting of patients’ subjective experiences. Discordance between patient and clinician reports of Health-Related Quality of Life (HRQL) and health status has been widely reported8,9. In general, clinicians have reported fewer symptoms10–13 and lower symptom severity14,15 compared to patient reports.
There is also increasing evidence that PROs can provide more information about toxicity and symptoms than physician or adverse event (AE) reports16,17. Studies have shown that, for some subjective symptoms (e.g., in sexual function), clinician ratings are no better than chance in predicting PROs of the same symptoms18,19. These findings support the need for tools to collect patient-reported symptoms and HRQL. The inclusion of PRO measures of AEs and other symptoms in clinical trials and other research recently has been recommended as a means to improve the quality and completeness of data, provide a more comprehensive reflection of patient experiences, and improve the operational efficiency of conducting studies20–22.
The need to reduce patient burden in measuring PROs has long been a concern in health outcomes research. This concern has led researchers away from reliance on classical testing models and toward item response theory (IRT) and computer adaptive testing (CAT). These methods have been used successfully for decades in education, licensure, personality assessment, and selection of military personnel. By only administering questions targeted to the individual’s ability or trait level, testing times have on average been cut in half while at the same time improving overall test reliability1. The efficiencies long noted in educational testing and credentialing are equally applicable in the measurement of PROs. Underlying every CAT is a bank of items “calibrated” to an IRT model. This model allows scores estimated from any subset of the entire bank to be expressed in the same metric. Therefore, although different individuals take different subsets of items, their scores are directly comparable23. In a CAT-based measure, an initial item from the bank is administered. A person’s response to that item provides a rough estimate of the person’s level of the trait being measured. For example, a patient who initially chooses the response, “Very Much,” when asked, “How much did pain interfere with your day to day activities?” likely has a high level of pain interference24. The items subsequently administered would be those known to be effective in discriminating among people experiencing high pain. On the other hand, an individual who responded “Never” to this question would be asked additional questions known to be good at discriminating among people with low levels of pain interference. Because the CAT only administers the items that are most informative for each individual, patients can typically complete a PRO CAT in an average of five questions with reliability similar to a traditional 15–25-item survey measure23. Reducing the number of items on each instrument lowers the burden on patients and allows the measurement of more PROs, thereby supporting more comprehensive assessments.
The Patient Reported Outcomes Measurement Information System (PROMIS) is an initiative, funded by the National Institutes of Health (NIH) Common Fund, to improve assessment of self-reported symptoms and other health-related quality of life domains. CAT-based PROs have become much more accessible through PROMIS. A primary goal for PROMIS was the creation of CATs to enable efficient, psychometrically robust assessment of PROs for a wide range of health outcomes research25. To achieve this goal, customized banks of items for measuring PROs were developed and tested at 12 primary research and data collection sites. Initially PROMIS developed and validated 27 adult and 9 pediatric item banks across the domains of physical, mental and social health. Many PROMIS instruments were developed by scientists who had previously authored well-known PROs including the Short Form-36, the Functional Assessment of Chronic Illness Therapy, and the Health Assessment Questionnaire. In practice, PROMIS banks have shown greater reliability, fewer ceiling and floor effects and more responsiveness to change than the “gold standard” instruments25.
The PROMIS initiative lays the foundation for widespread health outcomes screening to take place in the waiting room of healthcare providers. These screenings can coincide with the current activities that usually occur while a patient is waiting for their healthcare provider, such as filling out or updating their past medical history and insurance forms. The data collected from these screenings can be incorporated into the patient’s electronic health record (EHR) alongside other clinical patient data. This will give healthcare providers a more accurate picture of their patients overall health and healthcare needs. Healthcare providers can make more informed decisions with regards to mental health referrals or treatment options.
In order to realize these benefits, PRO screenings must capture maximum information with minimum patient burden. PROMIS is unidimensional in that there is a separate item bank and therefore a separate set of questions administered for each measured trait. This has been a good initial step in addressing the issue of patient burden, but in the real world things are not always as simple as the one dimensional approach; that is, there are correlations between many of the traits assessed by the PROMIS system. For example, depression and anxiety are closely related37, which means many questions that ascertain level of depression can also provide information about the level of anxiety. A multidimensional IRT (MIRT) model represents items concerning several correlated traits. A multidimensional CAT (MCAT)26–29 selects items from an item pool such that the items selected maximize information provided on several correlated traits. Such a model would significantly reduce the number of items administered in measuring PROs and thereby ameliorate the patient’s burden of answering many questions.
Researchers have recently realized the acute value of the MCAT approach in health services30–32. In this research we investigated whether MCAT can lessen patient burden relative to unidimensional CAT (UCAT) in the domain of PROs. We performed this investigation using the related traits “anxiety” and “depression.” First, we developed an MIRT model for these two traits using existing PROMIS item banks. Then we developed MCAT software to administer questions based on this MIRT model. We compared the performance of this MCAT approach to the unidimensional approach currently used by PROMIS using 20,000 simulated individuals. We found that the MCAT consistently provided comparable estimates of anxiety and depression with fewer items, relative to administering separate UCATs.
IRT and CAT Review
Since the methodology concerns IRT and CAT, we first briefly review these two.
Item Response Theory
In item response theory (IRT)33,34, we estimate an individual’s traits from the individual’s responses. Each trait is a skill, knowledge, or quality in some domain. For example, a trait may be “arithmetic ability,” while the responses are answers to arithmetic problems. Traits are hidden variables; responses are observed variables. Figure 1 shows a Bayesian network (BN)35 representing an IRT model with one trait θ (unidimensional) and five items.
Figure 1.
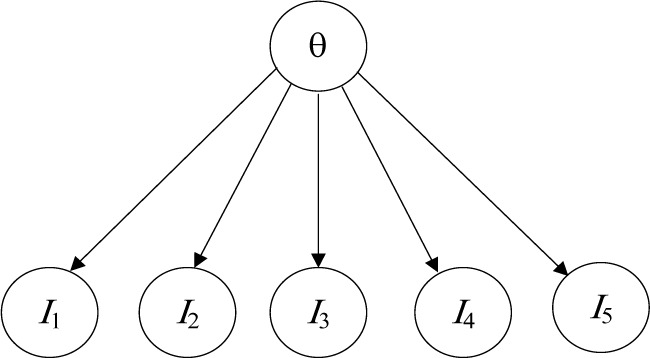
A unidimensional IRT model.
The probability distribution of correctly answering a dichotomous item given the level of a trait is commonly modeled using the following two parameter logistic evidence model:
| (1) |
where bj measures the location of the item on the latent trait continuum (e.g., whether it is easy or difficult), and aj is a discrimination parameter reflecting how sensitive the item is to differences in the latent trait.
In the case of PROs there is no “correct” response. Instead, a polytomous IRT model is use to represent the probability of each option on the response scale. The probability distribution of a polytomous item with m + 1 categories given trait θ in the graded response model36 is computed as follows:
where bj1 < bj2< … < bj,m. The probability of selecting option k, k = 0,2,…,m, is given by
Traits in a given domain can be related, which means many items that ascertain the level of one trait can also provide information about the level of other traits. For example, many items that ascertain depression level can also provide information about anxiety level37. These relationships can be modeled using an MIRT model. In the case of MIRT, Equation 1 for the two parameter dichotomous logistic model is as follows:
| (2) |
where θ = (θ1,θ2,…,θn) is a vector of traits and aj is a vector of discrimination parameters.
Computer Adaptive Testing
Computer adaptive testing (CAT)38 improves test measurement quality and efficiency by striving to administer optimal items to each examinee. CAT selects items sequentially to minimize the standard error of the estimate of θ. Commonly employed item selection criteria used in CAT include maximizing Fisher’s information (FI)39, and using the Kullback-Leibler information40. Chen et al.41
In unidimensional IRT, Fisher’s information for a polytomous item given trait level θ is as follows:
As indicated in this expression, information is a function of the individual’s standing on the latent variable θ, which is unknown. To address the uncertainty inherent in the estimate of θ, we computed the maximum posterior weighted information (MPWI)42, where the expected value of is taken across the posterior distribution of based on the individual’s responses so far. The next item chosen is the one that maximizes the MPWI.
In the case of MIRT, FI takes the form of a matrix, and the determinant of the information matrix serves as a summary measure of the information regarding the set of traits29. Thus, the next item is chosen that maximizes the posterior weighted determinant of the information.
Methods
The current study presents the result of a Monte Carlo simulation designed to evaluate the reduction in test length when using multidimensional versus unidimensional CAT. In order to represent a typical PRO assessment situation, we simulated responses to the actual PROMIS Anxiety and Depression banks. The PROMIS banks were developed using unidimensional IRT analyses. Therefore, an initial step toward building the simulation was to estimate the item parameters of a 2-dimensional MIRT model.
Measures
The PROMIS item banks were developed though a mixture of qualitative and quantitative methods. Rigorous scale construction practices were followed, with substantial input from domain experts, as well as revision based on respondent feedback. Statistical item analyses were conducted using both classical and IRT-based methods to identify the best items for inclusion in the final bank. Cella et al.25 The banks consist of 29 anxiety items and 28 depression items from the current PROMIS item banks.
For these items, respondents are asked to report the frequency of experiences during the past seven days. Examples of item content are as follows: “I was easily startled” (anxiety), and “I felt worthless” (depression). Responses were indicated on a 5-point scale (1 = Never, 2 = Rarely, 3 = Sometimes, 4 = Often, 5 = Always).
Estimating the MIRT Model
Calibrating an IRT model involves obtaining estimates of item parameters described in Equation 2. Unidimensional item parameters were available from prior work on the development of the PROMIS banks25. For the MCAT, a preliminary analysis was conducted to obtain the necessary item parameters. Item parameters for a 2-dimensional Graded Response Model were estimated using the program IRTPRO.
This step utilized existing data collected for the development of PROMIS instruments25. The sample was 52% female with a median age of 50. The racial composition was 82% white, 9% black, 8% multi-racial, and 1% other. Nine percent were Latino/Hispanic25. The current study used a subsample of 7945 adults sampled from the general population who completed the anxiety and depression items.
The parameter estimates from the MIRT model were found to correspond closely to those from the unidimensional analyses (all correlations > .9). Items tended to have large discrimination parameters, indicating that each item was a strong indicator of the underlying trait. The average a parameter value was 2.78 (ranging from 1.41 to 3.76) for Anxiety and 3.23 (ranging from 2.21 to 4.72 for Depression).
Item location (b) parameters indicated that the items tended to reflect higher levels of anxiety and depression. For example, among individuals with a slightly below average level of the trait (0.5 SD below the mean), the most common response selected was the lowest option on the 5-point scale. This indicates that the items in this bank are primarily sensitive to moderate to high levels of anxiety and depression, and are less able to distinguish among individuals with low levels of anxiety and depression.
The preliminary analysis also yielded estimates of Anxiety and Depression levels for each individual in the data. The distribution of both anxiety and depression were positive skewed, with approximately 70% of individuals obtaining trait values near the mean (θ = 0) or slightly below (θ = −1), and the remaining 30% demonstrating higher levels of the trait. The two traits were highly correlated, r = 0.88, p<0.001.
Monte Carlo Simulation
The simulation consisted of generating data for 20,000 respondents who completed both the UCAT and MCAT versions of the PROMIS Anxiety and Depression measures.
We first generated the true trait levels of each respondent by sampling from the bivariate frequency distribution obtained during the IRT calibration step. This approach produced simulated data representative of anxiety and depression levels observed in the general population.
Each simulated respondent was administered three CATs: MCAT for anxiety and depression, UCAT for anxiety, and UCAT for depression. First, an initial item was selected by the CAT algorithm. Next, a probability distribution for the individual was generated according to that individual’s true trait levels and the IRT model for that item. The IRT model corresponding to each CAT (i.e., unidimensional or multidimensional) was used to generate a probability distribution. Next, a response was generated according to this probability distribution.
After each item, the CAT then updated the posterior distribution of θ based on the individual’s response, along with the expected a posteriori (EAP) estimate , and the standard error (SE) of this estimate. This updated theta distribution was used by the CAT algorithm to select the next item. This was repeated for the first 20 items administered by each of the CATs.
The CAT was designed to stop when the SE of each θ estimate falls below a threshold. The SE is a measure of uncertainty in the trait estimate (i.e., how far the estimate is expected to fall from the true trait level). Consequently, when the SE falls below the threshold, this indicates that the trait has been estimated to an acceptable level of precision, and is unlikely to change substantially on further testing. For the current study, we considered a variety of thresholds, ranging from 0.2 to 0.4 in increments of .025. This range was centered on the threshold of 0.3 currently implemented in the unidimensional PROMIS CATs.
Two primary outcomes of interest were the number of items required to achieve the stopping rule, and the accuracy of the resulting EAP estimates, operationalized as the root mean square error,
where and θt,i represent the EAP estimate and true value of trait t for respondent i, and N is the number of simulated respondents.
Results
An initial analysis indicated that not all simulated respondents reached the stopping rule within the 20 simulated items (see Table 1). This was particularly problematic for the more stringent stopping rules, which required a SE below 0.3. Further analyses revealed that the cases that failed to meet the stopping rule generally occurred when one or both of the traits were less than 0. As noted above, the items available in the Anxiety and Depression banks tend to be more sensitive to higher levels of these traits. The absence of items targeted toward lower levels of these traits limits the precision obtainable for individuals with below-average anxiety or depression. Thus, the administration of additional items is unlikely to change this result.
Table 1.
Percent of simulated respondents meeting the stopping rule on both anxiety and depression within 20 items.
| SE Cutoff | MCAT | UCAT |
|---|---|---|
| 0.2 | 56% | 63% |
| 0.225 | 63% | 64% |
| 0.25 | 67% | 67% |
| 0.275 | 71% | 72% |
| 0.3 | 79% | 76% |
| 0.325 | 82% | 80% |
| 0.35 | 85% | 86% |
| 0.375 | 88% | 89% |
| 0.4 | 91% | 90% |
Because the outcome measures could be computed only for cases that met the stopping rule, respondents who did not satisfy this requirement were excluded from subsequent analyses. To ensure comparability, a respondent was included in the results only when the stopping rule was reached for both the UCAT and MCAT for a particular cutoff. However, the number of examinees was allowed to vary across cutoffs, so that more data was available for less stringent cutoffs (e.g., N=16,817 for SE<0.4) than for more stringent cutoffs (e.g., N=11,262 for SE < 0.2).
The average number of items required to reach the stopping rule is presented in Table 2. The MCAT required fewer items at each of the cutoff levels (differences were all significant, p<0.001). On average the MCAT required 1.2 fewer item than the UCAT. Furthermore, despite the reduced number of items, the MCAT and UCAT resulted in equally accurate trait estimates, as indicated by similar RMSE values. The greater efficiency of the MCAT is illustrated in Figure 2, which plots the RMSE against the average number of items required for each stopping rule. The lower curve for the MCAT represents greater accuracy given the same number of items, relative to the UCAT.
Table 2.
Number of Items Required to Reach the Stopping Rule on Both Traits and RMSE of UCAT and MCAT.
| SE | # Items To Cutoff | RMSE | |||
|---|---|---|---|---|---|
| Cutoff | N | UCAT | MCAT | UCAT | MCAT |
| 0.2 | 11262 | 16.3 | 14.9 | 0.27 | 0.25 |
| 0.225 | 12454 | 12.6 | 11.6 | 0.30 | 0.28 |
| 0.25 | 12727 | 10.1 | 9.3 | 0.33 | 0.31 |
| 0.275 | 13137 | 8.8 | 7.6 | 0.35 | 0.34 |
| 0.3 | 13910 | 7.7 | 6.6 | 0.39 | 0.37 |
| 0.325 | 14565 | 7.4 | 5.7 | 0.39 | 0.40 |
| 0.35 | 15489 | 6.9 | 5.3 | 0.41 | 0.43 |
| 0.375 | 16343 | 6.2 | 5.2 | 0.45 | 0.44 |
| 0.4 | 16817 | 5.9 | 4.8 | 0.46 | 0.46 |
| Average | 9.1 | 7.9 | 0.37 | 0.37 | |
Figure 2.

RMSE for UCAT and MCAT estimates as a function of number of items required to reach the stopping rule.
Discussion
The results of the Monte Carlo simulation clearly demonstrate the benefits of multidimensional adaptive testing for patient reported outcomes. Consistent with prior research28, MCAT was found to produce accuracy similar to UCAT while reducing the number of items administered.
The absolute reduction is the test length was considerable. The UCAT required 9 items on the average, while the MCAT required only 8 items. This corresponds to an 11% reduction of the test length, which represents an important reduction in patient burden. However, the reduction in test length observed here is less that has been found in other MCAT applications28. This may be due to the nature of the items examined in study. In general, each item provides considerable information about the trait. The small number of items needed to obtain precise trait estimates may limit the potential for refinements such as MCAT to reduce test length to the same degree as that achieved when there are a large number of items.
A strength of the current simulation is the use of actual items from the widely used PROMIS anxiety and depression banks to build the simulation, thereby enhancing the realism of the simulation. Nevertheless, the results represent only these two traits, and may not generalize to other PRO measures.
A distinctive characteristic of anxiety and depression is their very high correlation (r=0.88). It is possible that MCAT will demonstrate less benefit over UCAT when less correlated traits are modeled, because each trait will provide less information about the other. On the other hand, EAP trait estimates tend to be slightly biased toward the mean of the prior distribution, and this effect is heightened in MCAT when the traits are highly correlated. Therefore, MCAT with less correlated traits may exhibit less bias and greater accuracy. Further research is needed to replicate these findings with other combinations of traits.
The sample of participants for the current study was mostly white (82%), and the generalizability of these findings across ethnic groups merits further study. Mean differences across groups should not affect the performance of MCAT assessments. However, if ethic subgroups interpret and respond to items differently, this will affect the parameters of the IRT model, and consequently the accuracy of the IRT-based adaptive tests. Although there is evidence that measures of depression may function differentially across ethnic groups43,44, little is known about the impact of these differences on UCAT and MCAT measures.
References
- 1.Sands WA, Waters BK. Introduction to ASVAB and CAT. In: Sands WA, Waters BK, McBride JR, editors. Computerized adaptive testing: from inquiry to operation. Washington, DC: American Psychological Association; 1997. pp. 3–9. [Google Scholar]
- 2.Reeve BB, Hays RD, Bjorner JB, et al. Psychometric Evaluation and Calibration of Health-Related Quality of Life Item Banks: Plans for the Patient-Reported Outcomes Measurement Information System (PROMIS) Med Care. 2007;45(5 Suppl 1):S22–S31. doi: 10.1097/01.mlr.0000250483.85507.04. [DOI] [PubMed] [Google Scholar]
- 3.Gershon R, Lai J, Bode R, et al. Neuro-QOL: quality of life item banks for adults with neurological disorders: item development and calibrations based upon clinical and general population testing. Qual Life Res. 2012;21(3):475–486. doi: 10.1007/s11136-011-9958-8. [DOI] [PMC free article] [PubMed] [Google Scholar]
- 4.Gershon RC, Cella D, Fox NA, Havlik RJ, Hendrie HC, Wagster MV. Assessment of neurological and behavioural function: the NIH Toolbox. Lancet Neurol. 2010;9(2):138–139. doi: 10.1016/S1474-4422(09)70335-7. [DOI] [PubMed] [Google Scholar]
- 5.Cella DF. Quality of life: The concept. J Palliat Care. 1992;8(3):8–13. [PubMed] [Google Scholar]
- 6.Cella DF, Cherin EA. Measuring quality of life in patients with cancer. Proceedings of the Fifth National Conference on Human Values & Cancer - 1987: A Service and Rehabilitation Education Publication; 1987. pp. 23–31. [Google Scholar]
- 7.Cella DF, Tulsky DS. Quality of life in cancer: definition, purpose, and method of measurement. Cancer Invest. 1993;11(3):327–336. doi: 10.3109/07357909309024860. [DOI] [PubMed] [Google Scholar]
- 8.Cella D, Wagner L, Cashy J, Hensing TA, Yount S, Lilenbaum RC. Should health-related quality of life be measured in cancer symptom management clinical trials? Lessons learned using the functional assessment of cancer therapy. J Natl Cancer Inst Monogr. 2007(37):53–60. doi: 10.1093/jncimonographs/lgm009. [DOI] [PubMed] [Google Scholar]
- 9.Sneeuw KC, Sprangers MA, Aaronson NK. The role of health care providers and significant others in evaluating the quality of life of patients with chronic disease. J Clin Epidemiol. 2002 Nov;55(11):1130–1143. doi: 10.1016/s0895-4356(02)00479-1. [DOI] [PubMed] [Google Scholar]
- 10.Fromme EK, Eilers KM, Mori M, Hsieh YC, Beer TM. How accurate is clinician reporting of chemotherapy adverse effects? A comparison with patient-reported symptoms from the Quality-of-Life Questionnaire C30. J Clin Oncol. 2004 Sep 01;22(17):3485–3490. doi: 10.1200/JCO.2004.03.025. [DOI] [PubMed] [Google Scholar]
- 11.Grossman SA, Sheidler VR, Swedeen K, Mucenski J, Piantadosi S. Correlation of patient and caregiver ratings of cancer pain. J Pain Symptom Manage. 1991 Feb;6(2):53–57. doi: 10.1016/0885-3924(91)90518-9. [DOI] [PubMed] [Google Scholar]
- 12.Litwin MS, Lubeck DP, Henning JM, Carroll PR. Differences in urologist and patient assessments of health related quality of life in men with prostate cancer: results of the CaPSURE database. J Urol. 1998 Jun;159(6):1988–1992. doi: 10.1016/S0022-5347(01)63222-1. [DOI] [PubMed] [Google Scholar]
- 13.Vogelzang NJ, Breitbart W, Cella D, et al. Patient, caregiver, and oncologist perceptions of cancer-related fatigue: Results of a tripart assessment survey. The Fatigue Coalition. Semin Hematol 07. 1997;34(3 Suppl 2):4–12. [PubMed] [Google Scholar]
- 14.Huschka M, Burger K. Does QOL provide the same information as toxicity data? Curr Probl Cancer. 2006 Nov;30(6):244–254. doi: 10.1016/j.currproblcancer.2006.08.003. [DOI] [PubMed] [Google Scholar]
- 15.Patrick DL, Curtis JR, Engelberg RA, Nielsen E, McCown E. Measuring and improving the quality of dying and death. Ann Intern Med. 2003 Sep 02;139(5 Pt 2):410–415. doi: 10.7326/0003-4819-139-5_part_2-200309021-00006. [DOI] [PubMed] [Google Scholar]
- 16.Parliament MB, Danjoux CE, Clayton T. Is cancer treatment toxicity accurately reported? Int J Radiat Oncol Biol Phys. 1985 Mar;11(3):603–608. doi: 10.1016/0360-3016(85)90195-6. [DOI] [PubMed] [Google Scholar]
- 17.Varricchio CG, Sloan JA. The need for and characteristics of randomized, phase III trials to evaluate symptom management in patients with cancer. J Natl Cancer Inst. 2002 Aug 21;94(16):1184–1185. doi: 10.1093/jnci/94.16.1184. [DOI] [PubMed] [Google Scholar]
- 18.Bruner DW, Scott C, McGowan D, et al. Factors influencing sexual outcomes in prostate cancer patients enrolled on Radiation Therapy Oncology Group (RTOG) studies 90–20. Qual Life Res. 1998;7:575–576. [Google Scholar]
- 19.Watkins-Bruner D, Scott C, Lawton C, et al. RTOG’s first quality of life study–RTOG 90-20: A phase II trial of external beam radiation with etanidazole for locally advanced prostate cancer. Int J Radiat Oncol Biol Phys. 1995 Nov 01;33(4):901–906. doi: 10.1016/0360-3016(95)02002-5. [DOI] [PubMed] [Google Scholar]
- 20.Fowler FJ, Jr, Barry MJ, Lu-Yao G, Roman A, Wasson J, Wennberg JE. Patient-reported complications and follow-up treatment after radical prostatectomy. The National Medicare Experience: 1988–1990 (updated June 1993) Urology. 1993;42(6):622–629. doi: 10.1016/0090-4295(93)90524-e. [DOI] [PubMed] [Google Scholar]
- 21.Sloan JA, Cella D, Hays RD. Clinical significance of patient-reported questionnaire data: another step toward consensus. J Clin Epidemiol. 2005;58(12):1217–1219. doi: 10.1016/j.jclinepi.2005.07.009. [DOI] [PubMed] [Google Scholar]
- 22.Velikova G, Booth L, Smith AB, et al. Measuring quality of life in routine oncology practice improves communication and patient well-being: A randomized controlled trial. J Clin Oncol. 2004;22(4):714–724. doi: 10.1200/JCO.2004.06.078. [DOI] [PubMed] [Google Scholar]
- 23.Amtmann D, Cook KF, Jensen MP, et al. Development of a PROMIS item bank to measure pain interference. Pain. 2010;150(1):173–182. doi: 10.1016/j.pain.2010.04.025. [DOI] [PMC free article] [PubMed] [Google Scholar]
- 24.Gershon RC, Cook K. Use of Computer Adaptive Testing in the Development of Machine Learning Algorithms. Pain Med. 2011;12(10):1450–1452. doi: 10.1111/j.1526-4637.2011.01235.x. [DOI] [PubMed] [Google Scholar]
- 25.Cella D, Riley W, Stone A, et al. Initial item banks and first wave testing of the Patient-Reported Outcomes Measurement Information System (PROMIS) network: 2005–2008. J Clin Epidemiol. 2011;63(11):1179–1194. doi: 10.1016/j.jclinepi.2010.04.011. [DOI] [PMC free article] [PubMed] [Google Scholar]
- 26. HealthIT.gov Policymaking, Regulation, & Strategy. [Accessed September 9, 2013]. http://www.healthit.gov/policy-researchers-implementers/meaningful-use.
- 27.Mulder J, Van Der Landen WJ. Multidimensional adaptive testing with optimal design criteria for item selection. Pyschometrika. 2009;74(2):273–296. doi: 10.1007/s11336-008-9097-5. [DOI] [PMC free article] [PubMed] [Google Scholar]
- 28.Luecht RM. Multidimensional computer adaptive testing. Applied Psychological Measurement. 1996;20:389–404. [Google Scholar]
- 29.Segall DO. Multidimensional adaptive testing. Pyschometrika. 1996;61:331–354. [Google Scholar]
- 30.Mulcahey MJ, Haley SM, Duffy T, Ni P, Betz RR. Measuring physical functioning in children with spinal impairments with computerized adaptive testing. Journal of Pediatric Orthopaedics. 2008;28(3):330–335. doi: 10.1097/BPO.0b013e318168c792. [DOI] [PMC free article] [PubMed] [Google Scholar]
- 31.Gibbons RD, et al. Using computer adaptive testing to reduce the burden of mental health assessment. Psychiatric Services. 2008;59(4):361–368. doi: 10.1176/appi.ps.59.4.361. [DOI] [PMC free article] [PubMed] [Google Scholar]
- 32.Haley SM, et al. Measuring global physical health in children with cerebral palsy: Illustration of a multidimensional bi-factor model and computerized adaptive testing. Quality of Life Research. 2009;18:359–370. doi: 10.1007/s11136-009-9447-5. [DOI] [PMC free article] [PubMed] [Google Scholar]
- 33.Hambleton RK. Fundamentals of item response theory. Newbury Park, CA: Sage; 1991. [Google Scholar]
- 34.Embretsen SE, Reise SP. Item response theory for psychologists. Mahwah, NJ: Erlbaum; 2000. [Google Scholar]
- 35.Neapolitan RE. Learning Bayesian Networks. Upper Saddle River, NJ: Prentice Hall; 2004. [Google Scholar]
- 36.Samejima F. Estimation of latent ability using a response pattern of graded scores. Psychometric Monograph. 1969;(17) [Google Scholar]
- 37.Clark LA, Watson D. Tripartite model of anxiety and depression: Psychometric evidence and taxonomic implications. Journal of Abnormal Psychology. 1991;100:316–336. doi: 10.1037//0021-843x.100.3.316. [DOI] [PubMed] [Google Scholar]
- 38.Wainer H, et al. Computer adaptive testing: a primer. Mahwah, NJ: Erlbaum; 2000. [Google Scholar]
- 39.Veerkamp WJJ, Berger MPF. Some new item selection criteria for adaptive testing. Journal of Educational and Behavior Statistics. 1997;22:203–226. [Google Scholar]
- 40.Chang H, Ying Z. A global information approach to computer adaptive testing. Applied Psychological Measurement. 1996;20:213–229. [Google Scholar]
- 41.Chen SY, Ankenmann RD, Chang H. A comparison of item selection rules at the early stages of computerized adaptive testing. Applied Psychological Measurement. 2000;24(3):241–255. [Google Scholar]
- 42.Choi SW, Swartz RJ. Comparison of CAT Item selection criteria for polytomous items. Applied Psychological Measurement. 2009;33:419–440. doi: 10.1177/0146621608327801. [DOI] [PMC free article] [PubMed] [Google Scholar]
- 43.Hambrick JP, Rodebaugh TL, Balsis S, Woods CM, Mendez JL, Heimberg RG. Cross-ethnic measurement equivalence of measures of depression, social anxiety, and worry. Assessment. 2010;17:155–171. doi: 10.1177/1073191109350158. [DOI] [PubMed] [Google Scholar]
- 44.Perreira KM, Deeb-Sossa N, Harris KM, Bollen K. What are we measuring? An evaluation of the CES-D across race/ethnicity and immigrant generation. Social Forces. 2005;83:1567–1601. [Google Scholar]