

Abstract
Objective:
To create a relevant and clinically informative visualization of passively collected patient mobility data from smartphones of rheumatoid arthritis (RA) patients for rheumatologists.
Methods:
(1) Pilot analysis of smartphone mobility data in RA; (2) Assessment of rheumatologists’ needs for patient data through semi-structured interviews; and (3) Evaluation of the visual format of the RA data using scenario-based usability methods.
Results:
We created a color-scale mobility index superimposed on a calendar to summarize the passive mobility measures from the smartphone that the rheumatologists confirmed would be clinically relevant.
Conclusion:
This assessment of clinician data needs and preferences demonstrates the potential value of passively collected smartphone data to resolve an important data question in RA. Efforts such as these are necessary to ensure that any smartphone data that patients share with their doctors will not exacerbate clinician information overload, but actually facilitate clinical decisions.
1. Introduction
Informatics problem
Sixty-four percent of American adults owned a smartphone as of October 20141, which has significant implications in healthcare. Smartphones are intimately associated with so many daily activities that, if the data could be captured and analyzed, they could provide detailed information about an individual’s behavior as it relates to health. The smartphone itself passively tracks daily movements but it also allows for ease of data input into symptom or medication logs. There are accessories that can measure blood pressure, heart rate, oxygen saturation, expiratory flow velocity, cardiac electrical activity, and even brain electrical activity2. A measure of how pervasive the belief is that these data sources could change healthcare delivery and research is the activity of several tech giants in this space, as exemplified by Google Inc.’s “Fit” and Apple Inc.’s HealthKit and recently announced ResearchKit technologies3.
Smartphone data gathered from patients with certain medical conditions, if processed and presented to their physicians effectively, could improve physician decision-making4. Unfortunately, physicians are already on the brink of information overload5. The average primary care physician might receive 1000 test results per week6 and is expected not only to be aware of the results, but also to analyze them and take the appropriate management actions. Data from patient smartphone applications, however potentially useful, is likely to be met by resistance from physicians if the clinical relevance is not immediately apparent. A significant amount of time and research must be spent on which measurements are truly useful and determining the best way to present the smartphone data in a clinically relevant and actionable manner.
Building on these ideas, our research group is studying methods for combining passive mobility monitoring and active questionnaires to create clinically informative measures for patients with rheumatoid arthritis (RA). As part of this larger effort, we sought to determine how to process and present smartphone data in a cognitively manageable, clinically relevant format for rheumatologists caring for patients with RA.
Rheumatoid arthritis management challenges
To place this work in context, it is helpful to recognize that RA management is fraught with many challenges related to assessing rapidly changing patient status and making appropriate decisions on the basis of this data. Managing an RA patient can be conceptualized as operating a complex feedback control system where the input variable is the RA medication and the output variable is the RA disease activity. Rheumatologists choose the dosing and frequency of non-steroidal anti-inflammatory drugs (NSAIDs) and disease-modifying antirheumatic drugs (DMARDs) such as methotrexate and steroids based on observing the RA disease activity. RA disease activity is characterized by painful, stiff joints in the hands and/or feet accompanied by fatigue and morning stiffness that takes at least an hour to resolve with activity. RA disease activity is unpredictable with flares that last a couple of days to several weeks. Clinical practice guidelines were designed based on available research to help rheumatologists improve their efforts at preventing long-term joint destruction and disability. The guidelines emphasize that rheumatologists frequently monitor patient disease activity and adjust medications and doses in order to achieve “tight control” of disease activity, which means maintaining remission or low disease activity at all times7,8.
The guidelines encourage the use of composite disease activity indexes, which simplify and standardize the measurement of disease activity by assigning a single numerical score to patients for classification into one of four states: remission, low disease activity, moderate disease activity, or high disease activity. The composite disease activity indexes are well validated but have significant drawbacks. The composite disease activity indexes were created to capture the heterogeneity of RA into a standard measure, but it is possible for two patients with the exact same score to have vastly different signs and symptoms and actually be in two very different disease states9. There is evidence suggesting a disconnect between the composite disease activity indexes and patient satisfaction with their treatment, which rheumatologists must overcome with their patients in order to make the best shared treatment decisions10. It is also thought that most U.S. rheumatologists do not routinely use composite disease activity indexes in clinical practice because they are not practical to assess given the limited amount of time they have available during their patient encounter11. These challenges of RA management call for more patient-driven data and a supplement to the composite disease activity index.
Objectives
The objective of this study is to create a relevant and useful visualization of patient generated smartphone mobility data and to elicit rheumatologist perspectives on 4 questions: (1) Is smartphone mobility data a relevant measure of RA disease activity? (2) Does this data answer clinician data needs in RA management? (3) Does it ease challenges of RA management? and (4) How would rheumatologists use it in the office setting?
2. Methods
This study had three steps: (1) Pilot analysis of smartphone mobility data in RA; (2) Patient data needs assessment through semi-structured interviews with rheumatologists; and (3) Evaluation of the visual format of the RA data using scenario-based usability methods.
Collecting sample mobility data from an RA patient
To obtain realistic data for the study, we recruited an RA patient to participate in data collection. The subject met the following inclusion criteria: 25 years old or older; worked full-time outside the home; and routinely carried a smartphone whenever leaving the house. The subject downloaded a commercially available motion/activity tracking software application onto an iOS smartphone, and was instructed how to link the application to the sensing technology platform used in this study. The subject provided information about which days were workdays versus non-workdays and notified the researcher by email when an RA flare occurred.
The smartphone recorded mobility measurements over time, leveraging the built-in accelerometer and GPS/Wi-Fi locator. We processed the raw data into multiple dependent variables for each day. They included: (1) time spent walking/running; (2) gait speed for walking/running; (3) distance travelled walking/running; (4) time spent using transportation and distance travelled; (5) maximum gait speed in miles per hour when walking for more than five minutes; (6) number of hours away from the house; (7) time of day that the subject left the house; and (8) geodiameter (furthest distance travelled from home). The rheumatologists reviewed these variables and gave opinions about the usefulness of each of these and which ones might deserve a higher priority. The pilot data with the dependent variables measured by the smartphone were separated into workday and non-workday groups. Deciles for each dependent variable were calculated using Stata (version 13.1, StataCorp, College Station, TX). The decile values were used as a basis for creating a scoring scale from 0 to 9 unique for each variable.
Assessing clinical data needs of clinicians treating RA
Physicians with experience treating RA were recruited from a nationally known orthopedic hospital in New York, NY. Two of the physician subjects were co-investigators of a study related to this project. A snowball sampling approach was utilized in which these two co-investigators suggested the names of other rheumatologists for the interview.
A series of semi-structured interviews were conducted with these clinicians. The interview questions were developed based on literature review and designed with the following objectives: (1) to understand how rheumatologists assess an RA patient’s symptoms and functional disabilities; (2) to understand how they cognitively process this information to make medical management decisions; and (3) to identify gaps in data needs that might be addressed by patient-generated mobility data.
The interviews were audio-recorded and transcribed. Analysis was done in an iterative manner guided by a grounded theory approach12. The insight and feedback gained from the interviews was used to alter the questions, patient scenarios, and format for summarizing the smartphone mobility data before the next subject was interviewed.
Evaluating the clinical utility of RA patient mobility data
During the physician interviews, a scenario-based design approach13 was used to evaluate the clinical utility of patient-generated mobility data. The approach involved presenting multiple RA patient scenarios to the physician subjects and asking them to think out loud while they decided how to manage the patients. Such “think-aloud protocols” or “verbal protocols” are useful in tracing problem-solving and decision-making steps14. The scenarios were presented in two parts. After reading the first part the physicians were asked to describe how they would manage the patient. Then, they were given the second part of the scenario, which involved the same patient with some new or different information involving a presentation of the data. The physicians were asked to describe how they would manage the patient again, given this new information. The purpose of this method was to determine what effect, if any, the mobility index had on management. The presentation of the mobility index was revised after each interview, and the most current iteration was used in the scenarios. Physician subjects were also asked to critique the mobility index. This approach helped guide a discussion about the best way to present patient-generated mobility data so that it would integrate smoothly into the rheumatologist’s typical process for evaluating and managing RA patients.
Ethical approval
The Weill Cornell Medical College institutional review board approved the study. All physicians gave oral informed consent, and the patient subject granted written informed consent.
3. Results
Five board-certified rheumatologists participated who all reported <50% but >10% of their patients have a diagnosis of RA.
Physician clinical data needs when treating patients with RA
Five general themes about data needs when managing RA surfaced during the semi-structured interviews.
Theme 1: An accurate and detailed history is essential for helping rheumatologists recognize the patterns that help them properly identify RA flares
Flares present in various ways, even for the same patient. Some flares present suddenly while others have a more gradual onset. Some cause obviously swollen joints but no joint tenderness while others cause no swollen joints but exquisite joint tenderness. “For some patients it is mostly pain, for some it is stiffness, and then there can be fatigue overriding the whole thing.” [Physician 1] Even laboratory tests can be unreliable. There are frequently patients with swollen, tender joints from RA with no elevation of the erythrocyte sedimentation rate or C-reactive protein (sensitive serologic markers for RA).
It is not always obvious that a patient is experiencing a flare. Back pain, a common symptom for all adults, is a good example. Rheumatologists must have enough historical information to rule out muscle strain, joint trauma, fibromyalgia, gout, herniated discs, neuropathic pain, and even depression as a cause of the back pain.
A detailed history can help rheumatologists evaluate a patient more accurately. It can help them detect the subtle patterns that define an RA flare so that they can more quickly and confidently prescribe the appropriate treatment.
Theme 2: An accurate and detailed history is essential for fine-tuning dosing to maintain the delicate balance between RA symptoms and side effects from RA medications.
Managing each individual RA patient’s treatment “is a delicate, fine balance because a small increase in DMARD dosage can improve symptoms, but that same small increase can also cause serious side effects.” [Physician 4] This effort is further challenged by the fact that rheumatologists are not always aware of which doses a patient is actually taking. Many patients are allowed to self-dose their prednisone and do not necessarily keep an accurate account of what they took or when. Also, medication adherence is a common challenge because patients are often more concerned about the side effects of DMARDs than they are of their RA. Once a reliable medication history is established, then subtle changes in symptoms and mobility can be associated with changes in dosing so that the optimum doses for the individual patient can be established.
Theme 3: Ambivalence about validated disease activity indexes in RA management
The composite disease activity indexes are well-validated measures of disease activity and are the basis for most of the RA management algorithms published in the clinical practice guidelines. However, two of the physicians had problems with the indexes. One physician felt that the indexes did not correlate with disease activity enough to be worth the time it takes to do them. “I’m not sure how helpful I find it. This may or may not be right but I like to treat the patient more than the number of things.” Another physician was very confident in the part of the index based on physical exam findings, but not in the single self-report question for the patient - “How much pain and stiffness have you had in the past week on a scale of one to ten?” This question appeared too subjective to be valuable because some people tolerate pain more than others, which makes the score inaccurate. The question also did not differentiate RA pain from something like degenerative joint disease pain, which is common among RA patients. The participant described a common scenario:
“Sometimes the patient will look very comfortable but answers 8/10 where 10 is the worst. I’ll have to ask them if they mean a constant 8/10 or is that the worst score but most of the time they are a 3/10. I’ll end up having to ask them to try to pick whatever number pops into their head or a type of average, which is obviously extremely subjective. It also only asks about the last week. If I saw them three months ago, or even a month ago, then I really want to know about more than just the past week.”
The four physicians who used the indexes (whole or in part) felt that they generally correlated well with their subjective and physical assessments. However, these four physicians made the point that the composite disease activity index was only a part of their total assessment and did not replace any other part of their assessment. It was perceived as especially good at providing a way to consistently compare how a patient is doing relative to how they were doing at their previous appointment.
Theme 4: Self-reporting of symptoms during the clinical encounter often gives an incomplete picture
Rheumatologists rely heavily on a patient’s self-report to determine the true level of disease activity especially since there is no gold standard for measuring disease activity in RA and there is such wide variability in presentation. Unfortunately, patient self-report can lead to misrepresentations of the truth in many instances. “It is common to have a patient complain about their swollen finger but say nothing about their knee that is swollen the size of a grapefruit.” The swollen finger may attract attention because it is new, whereas the knee has been symptomatic for months.
Self-report can also be inaccurate when patients understate the severity of their symptoms. One participant stated that it is common for “patients to say that they are doing much better, their joints feels good, and they are feeling good. Then I examine them and they have really swollen joints and are really tender.” Some patients accept more pain than they should. One explanation is the so-called “adaptation effect” in many chronic pain patients, in which pain appears normal to the patient because it has been present for so long. Only increases in pain are noted. Some patients who improve on a new treatment regimen will say, “Wow, I realize that I really wasn’t doing great now that I know how I am supposed to feel.” Other patients understate the severity of their symptoms simply because they are stoic and are not comfortable complaining. While other patients may be doing so much better on their new regimen that they understate their residual symptoms out of the fear of being asked to change to a new medicine.
Conversely, some patients overstate their symptoms. They could be more sensitive or vocal about lower levels of pain than the average patient, or the behavior could be drug seeking. Another possibility for a disproportionately high level of perceived pain is fibromyalgia. “Fibromyalgia is a condition that I believe acts as an amplifier. Pain begets pain in this situation and any pain they experience seems to cause them to complain more than other patients with similar physical findings.”
Theme 5: Self-report data generated between visits may help RA management, but presents new challenges
All the physicians agreed that more information about the time between office visits would be helpful in managing RA.
“The reality is that there is so much we don’t know about RA. We aren’t even sure exactly what causes flares. As a result, each flare is a learning experience that is lost. If somehow we could record what happened to the patient leading up to the flare and how they responded to the doses of prednisone or NSAIDS that they took, then it would provide valuable knowledge on how to prevent another flare and how to manage the next one.”
This type of knowledge could help rheumatologists achieve “tight control” more rapidly with the benefit of preventing the long-term damage that keeps occurring as long as their disease activity is elevated.
Two of the five interviewed physicians asked some of their patients to keep a symptom diary. The three physicians who did not stated that they would not have time to read a diary. “If I asked every patient to do a diary, 90% wouldn’t do it and then 10% would make it their life.”
One physician subject thought the journal information would be valuable for helping her manage her patients’ conditions, yet she was concerned that tracking symptoms at home would be tedious and boring and that patients would tire of it. She also expressed concern that forcing patients to document their symptoms might make them overly aware of them.
Creation of Passive Mobility Measures
The physicians all agreed that an index modeled after the composite disease activity index would be an effective way to represent a summary of the passive mobility measures and we decided to call it a “mobility index”. When asked about the individual mobility measures, the majority felt that time spent walking, time away from the house, and gait were the most useful in defining the level of RA disease activity. Four of the rheumatologists agreed that gait would be one of the more sensitive measures of increased disease activity, so we decided to apply more weight to gait in the mobility index weighted gait. Less weight was attributed to the time away from the house because two rheumatologists raised concerns that it was not as meaningful as the other measures.
The resulting formula for a summary estimate of the degree of mobility for the day was:
Another formula needed to be created to give a weekly summary of a patient’s mobility level. It could not be calculated as a simple average because rheumatologists want the weekly score to be defined by the worst days. Flares can often resolve in 48 hours, so its effect on a workweek mobility index could be washed out by a simple average. As a solution to this problem, the following formula was designed to enhance the signal of a low peak in the daily score where d equals the number of days in the workweek.
For the purposes of the current study, we included only workday data and excluded weekend data because there was a large number of scores of “0” resulting in scores that were not interpretable.
Clinically meaningful visualization of the Mobility Index
The physician subjects were asked specific questions about how they would like this type of data presented to them. All of the physicians wanted to be able to review this smartphone data at the beginning of their office visit with the patient. They all wanted the smartphone data to be in the form of a simple single-paged report. The physicians wanted the smartphone data to help them understand symptom and side-effect trends over appropriate time intervals.
For a patient who was experiencing a flare, they expected to see daily changes. For a patient who was initiating a new medication, they would expect to see weekly changes. For a stable patient, they wanted to see an even broader view with a month-to-month summary.
In order to accomplish these goals, the daily and workweek mobility indexes were assigned a color shade according to its numeric value and the corresponding color shade was superimposed on a calendar view. Originally we used the colors red, orange, yellow, and green to represent different levels of mobility, but we determined that it was easier to convey the concept that these expressed ordinal categories of the same variable if we used different saturation levels of one color15. That is, it was difficult to understand that green was a different level from red but easy to understand that dark purple is a different level from light purple. We used the color scheme in Figure 1. The darkest, most saturated level of purple was used to draw attention to the most impaired mobility. Figure 2 demonstrates the mobility index for the pilot patient with the color shades superimposed on the calendar for a daily score. Figure 3 demonstrates the weekly score.
Figure 1.
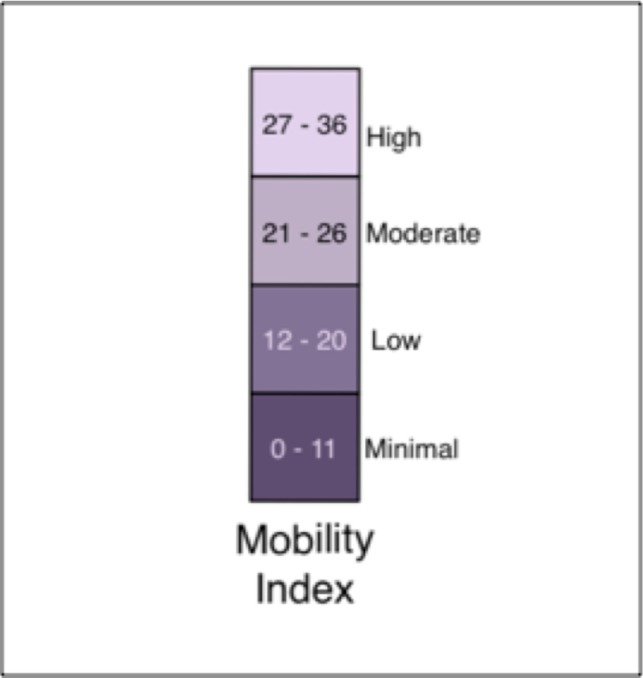
Mobility index. The most impaired mobility is represented by the lowest mobility index values and the darkest shade of purple.
Figure 2.
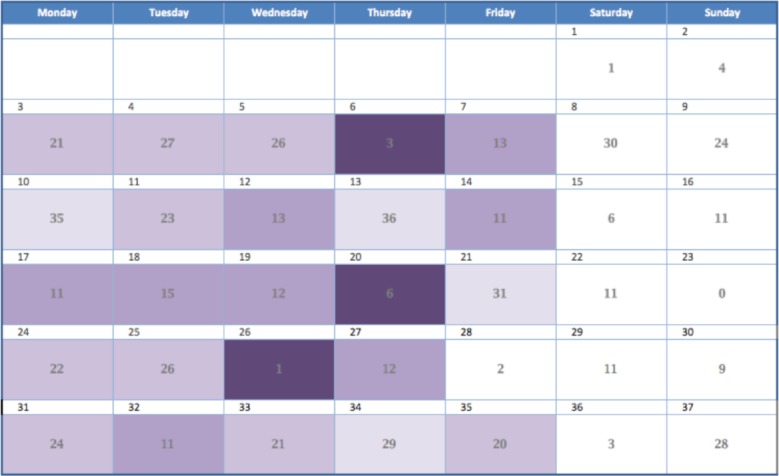
Calendar view with the daily format of the mobility index.
Figure 3.
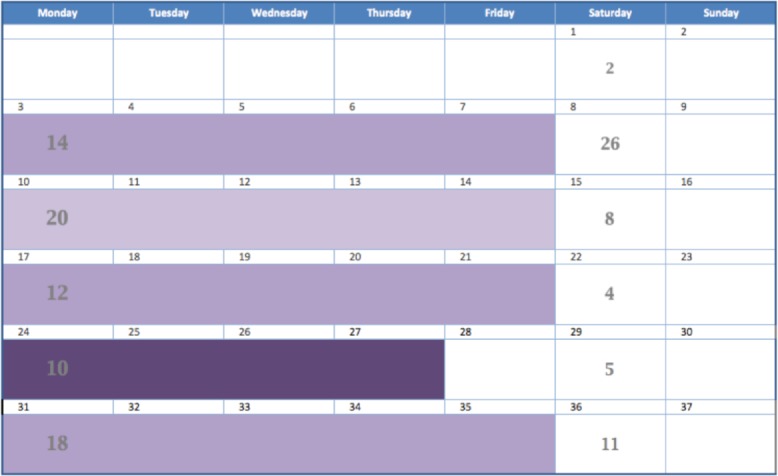
Calendar view with the weekly format of the mobility index.
Perceived impact of Mobility Index on RA management decisions
The physicians were generally enthusiastic about the potential benefits that mobility information on a calendar could bring to understanding RA after using it in the patient scenarios. “I think this type of information will be great. It will give me a better feel for the reality of what’s going on in their life,” one said. Another called it “a springboard for obtaining more insight into a person’s life than we get from the typical appointment interview.”
The physicians agreed that tracking a patient’s mobility would be most helpful in situations where the patients are understating their symptoms. In one of the scenarios where the smartphone data indicated that the patient was less mobile than they had admitted, one physician described how she could use this information as a way to point out that a patient may be accepting more disability than necessary and that there are changes in management that could help. “This information that is derived from objective measurements could also make it easier for patients to overcome their barriers of shame and embarrassment to reveal the truth about their symptoms,” another said.
The smartphone data did not have any effect on how the rheumatologists would treat a patient complaining of pain. The physicians agreed that they treat any patient who is in pain with maximal medical therapy. “Pain trumps everything,” one said. The physicians treat patients in pain based upon their self-report above all else, whether the smartphone data was in agreement or not with what the patient was saying. The mobility information also did not affect treatment decisions for patients when it was consistent with the patient’s self-report and physical exam but it did offer an extra degree of confidence that they were doing the right thing. “I would use this mobility information as much as what was said and what I examined.”
Finally, the feedback from the clinician participants indicated that the mobility index in the calendar format could enhance the cataloging of RA signs and symptoms over time in the context of different environmental factors and medical interventions. “I ask patients to use a calendar to log symptoms and medications for me all of the time, but they don’t.” [Physician 3] Discussions with our clinician subjects suggested that successful adoption of an application like this by patients could help obtain generalizable knowledge about the behavior of RA. For example, if the mobility index and self-report are presented effectively for all of a rheumatologist’s RA patients, then after a while it could improve their understanding of the RA disease process enough to give them added knowledge to help them manage all of their patients. “If I have seen 10 people get 25% better in two weeks on a certain drug, then that is something I could share with a patient to give them an idea of what kind of benefits to expect from this new drug.”
4. Discussion
A key goal in creating mobile health-based tools for physicians is to assist them in making better patient management decisions. It is essential to have a thorough understanding of physicians’ data needs in order to create a tool that is relevant to clinical care. This also helps avoid the trap of developing a mobile health tool that is technologically sophisticated but does not have any real impact on the efficiency or quality of care delivered.
This study addressed those concerns by interviewing rheumatologists and describing the actual clinical problems and real world needs of rheumatologists. It also contributed information about the best format for presenting the smartphone data so that physicians would understand it and willingly adopt it into their patient management workflow.
The semi-structured interviews demonstrated that all of the rheumatologists were consistent in the opinion that more real-world data (generated outside of the clinical environment) about how RA affects an individual patient’s functionality would help them with management. Rheumatologists indicated that smartphone applications that track a patient’s movements throughout the day could be an indirect but valid measure of RA disease activity. Most importantly, all of the rheumatologists that were interviewed expressed a willingness to regularly spend a small amount of appointment time with their RA patients to review this type of data, as long as it was easy to understand, concise, and visual.
The patient scenarios demonstrated that visualizations of passive mobility were overall clinically useful to the rheumatologists. All of the five physicians understood the particular design that they were shown with little explanation. The calendar format added an improved understanding of the patient’s fluctuation of symptoms with time and helped physicians draw conclusions about trends. Allowing the calendar to change in granularity from daily to weekly to monthly helped the physicians adapt the data appropriately to the specific clinical situation. It also prompted rheumatologists to ask the theoretical patients more probing questions so that they would discover important details that the patient might have left out or forgotten. They felt that the addition of the visualizations would be better than performing a history and physical exam alone. It helped give them a more accurate picture of the patient’s true functionality, which even led to subtle changes in their choice of medical management.
There are numerous efforts ongoing to do this type of work in other domains. For Parkinson’s disease, researchers are using smartphones to transmit home motion-sensor data in a 3D animated form to clinicians for help with dose-finding16. For elderly patients, researchers are presenting physicians with a visualization of home motion sensor data and physiologic data to give them a better sense of patient overall health status17. There are also efforts to transform smartphone habit data with the Health Mashups System into a visual format that clinicians can evaluate and use to assist patients in promoting behavior change18. All of these projects aim to harness valuable information that the smartphone can collect and present it to physicians to aid in clinical decision-making.
Limitations
There are several limitations to this study. A single researcher performed data collection and analysis, although the iterative nature of the study meant that later physicians validated the interpretation of the analysis of the earlier interviews. The sample size was small, and the physician subjects were colleagues at a single medical center. The interviews revealed significant variability in preferences and disease management practices, but nevertheless, the results may not capture the diversity of opinion in other populations, such as rheumatologists in private practice or in different geographical areas. Given that many patients with RA will be cared for by a multidisciplinary team (physical and occupational therapists, nurses, etc.), another limitation of the study was that the clinicians interviewed were all physicians. Future work will include participation from other allied health professionals involved in the treatment of RA.
The pilot data collection was conducted with a single patient and may not reflect the full diversity of experiences of the RA population. An additional limitation is that we were unable to arrive at a stable score for non-workday readings and therefore excluded them from the current study. Additional data collection with more patients on non-workdays will help determine best how to calculate the meaningful score from non-workday data, as non-workdays may be even more informative about the severity of disease than workdays since most non-workday activities are voluntary. The current paper also does not address user testing, which is ongoing.
5. Conclusions
This assessment of clinician data needs and preferences demonstrates the potential value of passively collected smartphone data to resolve an important data question in RA, which is the daily activity level of the RA patient. This project also proposes a visualization solution identified by practicing rheumatologists as potentially valuable.
Concurrently with this data needs assessment, the mobile health development project is continuing. In addition to the passive data collection, we are developing a feature for patient self-report to allow patients to explain their schedule and report presence or absence of symptoms. Once all of this information can be captured simultaneously, then data analysis and data modeling will be able to improve and validate the choice of mobility measures, the formula for the mobility index, and the appropriate levels of severity to apply to the range of scores.
Patients are increasingly interested in capturing their health related data with their smartphones and wearable devices, and clinicians are going to be challenged in the future with interpreting these data. This study serves as an example of how to focus on a particular clinical problem, identify data needs, and design a data visualization technique that serves a clinical purpose. We think that this approach is necessary to ensure that the data patients generate and share with their doctors will not overwhelm them with information overload, but actually enhance their ability to provide the best possible care.
References
- 1.Mobile Technology Fact Sheet Pew Research Center ’s Internet & American Life Project [Internet] 2014. Available from: http://www.pewinternet.org/fact-sheets/mobile-technology-fact-sheet/
- 2.Topol E. The Future of Medicine Is in Your Smartphone - WSJ [Internet] The Wall Street Journal. 2015. [cited 2015 Mar 6]. Available from: http://www.wsj.com/articles/the-future-of-medicine-is-in-your-smartphone-1420828632.
- 3.Now everybody can do their part to advance medical research [Internet] [cited 2015 Mar 11]. Available from: https://www.apple.com/researchkit/
- 4.Estrin D. small data, where n = me. Commun ACM. 2014;57(4):32–4. [Google Scholar]
- 5.Singh H, Spitzmueller C, Petersen NJ, Sawhney MK, Sittig DF. Information overload and missed test results in electronic health record-based settings. JAMA Intern Med American Medical Association; 2013 Apr 22; pp. 702–4. [DOI] [PMC free article] [PubMed] [Google Scholar]
- 6.Poon EG, Wang SJ, Gandhi TK, Bates DW, Kuperman GJ. Design and implementation of a comprehensive outpatient Results Manager. J Biomed Inform. 2003;36:80–91. doi: 10.1016/s1532-0464(03)00061-3. [DOI] [PubMed] [Google Scholar]
- 7.Singh JA, Furst DE, Bharat A, Curtis JR, Kavanaugh AF, Kremer JM, et al. 2012 update of the 2008 American College of Rheumatology recommendations for the use of disease-modifying antirheumatic drugs and biologic agents in the treatment of rheumatoid arthritis. Arthritis Care Res (Hoboken) 2012 May;64(5):625–39. doi: 10.1002/acr.21641. [DOI] [PMC free article] [PubMed] [Google Scholar]
- 8.Ruderman EM. Treating to target in rheumatoid arthritis. Bull Hosp Joint Dis. 2013;71(3):214–7. [PubMed] [Google Scholar]
- 9.Futó G, Somogyi A, Szekanecz Z. Visualization of DAS28, SDAI, and CDAI: the magic carpets of rheumatoid arthritis. Clin Rheumatol. 2014 Mar 6; doi: 10.1007/s10067-014-2559-5. [DOI] [PubMed] [Google Scholar]
- 10.Solomon DH, Bitton A, Katz JN, Radner H, Brown EM, Fraenkel L. Review: Treat to target in rheumatoid arthritis: Fact, fiction, or hypothesis? Arthritis Rheumatol. 2014;66(4):775–82. doi: 10.1002/art.38323. [DOI] [PMC free article] [PubMed] [Google Scholar]
- 11.Anderson J, Caplan L, Yazdany J, Robbins ML, Neogi T, Michaud K, et al. Rheumatoid arthritis disease activity measures: American College of Rheumatology recommendations for use in clinical practice. Arthritis Care Res (Hoboken) 2012 May;64(5):640–7. doi: 10.1002/acr.21649. [DOI] [PMC free article] [PubMed] [Google Scholar]
- 12.Strauss A, Corbin J. Title Basics of Qualitative Research : Techniques and Procedures for Developing Grounded Theory. 3rd ed. Los Angeles (CA): Sage Publications; 1998. [Google Scholar]
- 13.Stanton N, Salmon P, Walker G, Baber C, Jenkins D. Human Factors Methods: A Practical Guide for Engineering and Design. 1st ed. Burlington (VT): Ashgate Publishing; 2009. [Google Scholar]
- 14.Ericsson K, Simon H. Protocol Analysis: Verbal Reports as Data. Cambridge (MA): MIT Press; 1993. Revised ed. [Google Scholar]
- 15.Tufte ER. The Visual Display of Quantitative Information. 2nd ed. Cheshire (CT): Graphics Press; 2001. [Google Scholar]
- 16.Piro NE, Baumann L, Tengler M, Piro L, Bechschmidt-Trapp R. Telemonitoring of patients with Parkinson’s disease using inertia sensors. Appl Clin Inform. 2014;5:503–11. doi: 10.4338/ACI-2014-04-RA-0046. [DOI] [PMC free article] [PubMed] [Google Scholar]
- 17.De Folter J, Gokalp H, Fursse J, Sharma U, Clarke M. Designing effective visualizations of habits data to aid clinical decision making. BMC Med Inform Decis Mak. 2014;14:102. doi: 10.1186/s12911-014-0102-x. [DOI] [PMC free article] [PubMed] [Google Scholar]
- 18.Bentley F, Tollmar K, Stephenson P. Health Mashups: Presenting statistical patterns between wellbeing data and context in natural language to promote behavior change. ACM Trans Comput Interact. 2013;20(5):1–27. [Google Scholar]