

Abstract
Data driven technology is believed to be a promising technique for transforming the current status of healthcare. Electronic Health Records (EHR) is one of the main carriers for conducting the data driven healthcare research, where the goal is to derive insights from healthcare data and utilize such insights to improve the quality of care delivery. Due to the progression nature of human disease, one important aspect for analyzing healthcare data is temporality, which suggests the temporal relationships among different healthcare events and how their values evolve over time. Sequential pattern mining is a popular tool to extract time-invariant patterns from discrete sequences and has been applied in analyzing EHR before. However, due to the complexity of EHR, those approaches usually suffers from the pattern explosion problem, which means that a huge number of patterns will be detected with improper setting of the support threshold. To address this challenge, in this paper, we develop a novel representation, namely the temporal graph, for event sequences like EHR, wherein the nodes are medical events and the edges indicate the temporal relationships among those events in patient EHRs. Based on the temporal graph representation, we further develop an approach for temporal signature identification to identify the most significant and interpretable graph bases as temporal signatures, and the expressing coefficients can be treated as the embeddings of the patients in such temporal signature space. Our temporal signature identification framework is also flexible to incorporate semi-supervised/supervised information. We validate our framework on two real-world tasks. One is predicting the onset risk of heart failure. The other is predicting the risk of heart failure related hospitalization for patients with COPD pre-condition. Our results show that the prediction performance in both tasks can be improved by the proposed approaches.
1 Introduction
Patient Electronic Health Records (EHRs) [6] is one of the major carriers for conducting data driven healthcare research. There are various challenges if we work directly with EHRs, such as sparsity, noisiness, heterogeneity, bias, etc [5]. One important aspect for mining EHR is how to explore the temporal relationships among different medical events within patient EHRs. Many approaches have been proposed for temporal mining of EHRs. For example, Lasko et al. [11] proposed a deep learning method for obtaining patterns from lab value signals. Kale et al. [7] applied deep learning to discover the physiomes from the physiological streams obtained in Pediatric Intensive Care Unit (PICU). Zhou et al. [24] proposed an optimization based technology for discovering the feature groups within which the raw medical features have similar evolving patterns. For all these works, the authors either identified as some evolving pattern on the values of a specific medical feature (e.g., lab test or physiological stream), or a group of medical features (e.g., diagnosis, medication or both). Another important type of feature is the temporal pattern across different medical features, which is referred to as temporal signatures in this paper. The existing approaches on temporal signature identification are mostly based on sequential pattern mining [2, 18] or temporal abstraction [17, 19, 20]. One major challenge for these methodologies working on EHRs is pattern explosion, which is the phenomenon that too many patterns are identified from the patient EMR corpus with improper support threshold. One could try to solve this problem by increasing the support threshold value used by sequential pattern mining but the mined signatures are then typically trivial. Therefore there is an urgent need on an effective way to identify a reasonable number of clinical meaningful signatures.
One cause of pattern explosion for traditional approaches is the sequence based representation: lots of the time the finest time granularity of patient EHR is day, within each day many events can happen. This generates a huge number of sequential patterns when the support threshold is relatively lower [2, 18]. In this paper, we propose a novel graph based representation for patient EHRs. We represent the EHRs of every patient as a graph. The nodes in the graph are the medical events (i.e., diagnosis, medications, lab tests, etc.). The edges indicate the temporal relationships among the events in the EHRs of the corresponding patient. Every edge points from an event to another event that took place later in time. A weight will also be associated with each edge, which encodes the average duration between the two events in EHRs. A bases learning framework is then developed to identify the bases that can be used to compose all those temporal graphs. We present several concrete instantiations of such framework and validate its effectiveness on a real-world EHR data warehouse both quantitatively and qualitatively.
It is worthwhile to highlight the following aspects of the proposed graph based framework:
Comparing to the traditional sequence based representation, temporal graph is more compact, which makes the downstream analytics procedure more efficient.
With graph based representation, the detected signatures are subgraphs instead of subsequences. Each subgraph is composed of a set of subsequences. This effectively alleviates the pattern explosion problem while at the same time retains the interpretability of the mined signatures.
We provide concrete instantiation examples of the proposed framework in a completely unsupervised scenario, as well as in scenarios where we incorporate expertise knowledge as regularizers.
The framework is validated on a real-world EHR data warehouse with two specific clinical scenarios. One is early detection of Congestive Heart Failure (CHF). The other is hospital readmission prediction of CHF patients with Chronic Obstructive Pulmonary Disease (COPD) pre-conditions. We showed that the prediction performance can be improved with the mined temporal signatures.
2 Related Work
This section reviews the existing work that are closely related to the research proposed in this paper. One is electronic phenotyping approaches. The other is temporal knowledge extraction.
2.1 Electronic Phenotyping
Electronic phenotyping refers to the process of identifying phenotypes from patient EHRs, which is the procedure of extracting clinically relevant features. There are quite a few existing electronic phenotyping works. For example, Ho et al. [3, 4] formulates the patient EHRs as tensors, wherein every mode represents a specific type of medical event. The entries in the tensor encode the interaction of those features (e.g., the frequency of a medication and a primary diagnosis). Then they proposed a tensor factorization based approach for identification of the phenotypes. Zhou et al. [24] formulates EHRs as temporal matrices with medical events as one dimension and time as the other dimension. They propose an optimization based technology for discovering the phenotypes within which the raw medical features have similar time-evolving patterns. Lasko et al. [11] proposed a deep learning method for obtaining phenotypes from continuous lab value signals, where they first adopted Gaussian process regression to impute the missing lab test values. Kale et al. [7] applied deep learning to discover the physiomes from the physiological streams obtained in Pediatric Intensive Care Unit (PICU). For all these works, they either define a phenotype as some evolving pattern on the values of a specific medical feature (e.g., lab test or physiological stream), or a group of medical features (e.g., diagnosis, medication or both). They did not consider the temporal relationships across different medical events, which could be crucial as they suggest important information on the impending disease conditions.
2.2 Temporal Knowledge Representation
Knowledge representation from temporal data is a hot research topic in both data analytics and biomedical informatics. For continuous time data, one popular approach is to transformthem into discrete symbolic representations (string, nominal, categorical, and item sets). Popular approaches include Piecewise Linear Approximation (PLA) [10], Adaptive Piecewise Constant Approximation (APCA) [8], Symbolic Aggregate approXimation (SAX) [13], Piecewise Aggregate Approximation (PAA) [9], etc. One can refer to [13] for a survey on these approaches.
For discrete time data, Mörchen et al. [15, 16] proposed the Time Series Knowledge Representation (TSKR) as a pattern language (grammar) for temporal knowledge discovery from multivariate time series and symbolic interval data, where the temporal knowledge representation is in the form of symbolic languages and grammars that have been formulated as a means to perform intelligent reasoning and inference from time-dependent event sequences. More recently, Wang et al. [22] proposed a convolutional framework to extract temporal signatures in discrete time data using the Temporal Event Matrix Representation (TEMR), which is shown to have wide applicability to a variety of data and application domains that involve large-scale longitudinal data.
The temporal graph we propose in this paper provides an alternative way to represent the temporal knowledges contained in discrete time data. The temporal graphs capture temporal structures hidden in the sequences in a more compact way, where the nodes in the graph are events appeared in the EHR and the directed edges encode the temporal relationships between pairwise events. In this representation, the events missing in patient EHRs will not appear in the graph, and the repeated pairwise events with the same ordering will only appear once in the graph. With this representation, the temporal graph is robust and resistant to sparse, noisy, and irregular observations. Moreover, this representation is very intuitive to interpret the temporal relationships among different medical events in patient EHRs. Another advantage is that with graph based representation, the detected phenotypes (or patterns) will also be in the form of graphs, which can be viewed as a nature aggregation of sequential patterns. In this way, we can effectively alleviate the pattern explosion problem.
3 Methodology
In this section we will introduce the details of our temporal graph based framework for phenotype identification from patient EHRs. First we present the basic definition of temporal graph and how it is constructed.
3.1 Temporal graph construction
Suppose we have a set of event sequences where N is the number of sequences. Each event sequence is denoted by sn = ((xnl, tnl) : l = 1,⋯,Ln) where Ln is the length of sn. In other words, we observe event xnl at time tnl in the sequence sn. We order the events xnl ∈ {1,⋯, M} that tnp ≤ tnq, for all p < q. Figure 1 illustrates an example of such graph.
Figure 1:

One example of medical event sequence and its corresponding temporal graph.
With the observed event sequences, we construct the following temporal graph for each sequence sn:
Definition 1 (Temporal graph) The temporal graph Gn of sequence sn is a directed and weighted graph with our event set as its node set {1,⋯, M}, where the weight of the edge from node i to node j is defined as
| (1) |
where κ(·) is a non-increasing function.
where κ(·) is a non-increasing function defined as follows, thus the closer event i and event j appear in sn, the higher will be.
| (2) |
Here Δ is a time horizon so that we only create an edge between a pair of events if the duration between them is smaller than or equal to Δ. r controls the locality of the edge computation in the temporal graph. Namely, a larger r captures the similarities among events in a longer temporal range, which potentially increase the connectivity of the temporal graph, while a small r only considers closely adjacent symbols as similar. In the extreme case when r approaches infinity, Wn becomes an almost constant matrix, since all appearing event pairs will be fully and equally connected.
The right part of Figure 1 provides a graphical illustration of the event sequence on the left part. In the sequence, we have 5 observations of 4 unique events. We show the duration between pairwise events. In this example, we use Δ = 3 months and r = 5 days. In our empirical study on real-world EHR data warehouse, we optimize r based on the algorithm performance in specific applications.
3.2 Temporal Signature Identification
With all the constructed temporal graphs, we want to identify the temporal signatures that can be used to best explain the observations. Our idea is to compute the graph bases as the temporal signatures which can be used to reconstruct the observed temporal graphs. In Figure 2, we have one simplified example, where we have three graph bases, and one observed graph can be expressed as the average of the first two bases. In practice, we do not know the bases at the beginning, and our temporal signature identification problem is exactly the process identifying the unknown graph bases with the observed temporal graphs.
Figure 2:
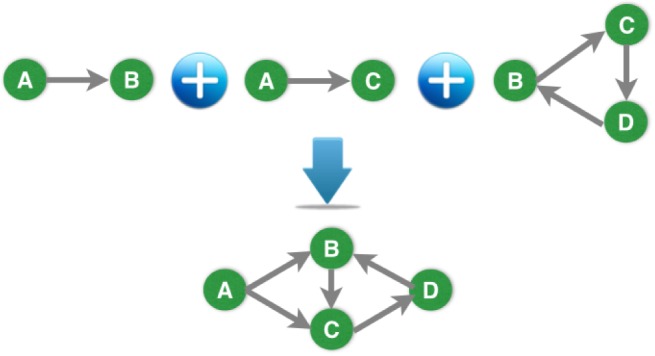
Example of composing a temporal graph with bases.
We call the resultant graph bases as temporal phenotypes, which capture evolving patterns of the health conditions hidden in the event sequences. To be specific, suppose we have constructed the temporal graph Gn for each sequence sn, and Gn is associated with the adjacency weight matrix Wn ∈ ℝM×M. To reconstruct Gn, we assume there are K graph bases Bk ∈ RM×M for k = 1, 2,⋯, K, which can be used to approximate the adjacency matrix Wn:
where A ∈ ℝN×K is the matrix of reconstruction coefficients. To compute the optimal graph bases and the reconstruction coefficients, we minimize the total reconstruction error:
| (3) |
where ∥·∥F is the matrix Frobenius norm.
To make the solutions more interpretable, we also consider two constraints on the reconstruction coefficients in A and the graph bases Bk for k = 1, 2,⋯, K. The first constraint is about the non-negativity, i.e., Bk ≥ 0 for all k, since our original temporal graphs are non-negative. The second constraint requires A ≥ 0 and , for n = 1,⋯,N, which make the rows of A to be valid multinomial distribution. In this way, we can quantify each patient by the temporal signatures with probabilities which can be in turn used for personalized medicine, patient segmentation, and disease diagnosis.
3.3 Regularization
As we introduced earlier, the reconstruction coefficients in A can be used for a various of applications. In particular, for the medical diagnosis application, our goal is to derive informative features to improve the diagnosis performance, i.e., the classification of control/case groups for the patients. To this end, we extend the temporal signature identification for temporal graphs with regularization Ω(A)≥ 0:
| (4) |
where λ ≥ 0 is the parameter controlling the degree of regularization. In the following, we propose several regularizations as Ω(A) to incorporate additional knowledge on the patients under study.
3.3.1 Similarity based regularization
In the first case, we may have implicit similarity links between patients indicating they are from the same group (case or control). We can encourage the linked patients to have similar signatures in A using the following regularization:
where S ∈ ℝN×N > 0 is symmetric matrix encoding the similarity information. Note that, when S is asymmetric, we can just equivalently replace S with (S + S′)/2 without changing Ω(A). It follows that and
| (5) |
where L = D − S and D is the diagonal degree matrix such that Dnn = ∑n′Snn′ Note that, some rows/columns of S may be completely zero if we do not have knowledge about the corresponding patients, e.g., the instances in the test set.
3.3.2 Model based regularization
In the second case, we may have access to the group information of the patients. We let Yn = 1 if the n-th patient is from the case group and Yn = −1 if the patient is from the control group. With the explicit label information, we can define the regularization Ω(A) directly with a discriminative model Pr(An, Yn|ℋ):
| (6) |
which is termed as average log-loss in the literature. Here, ℒ is the training set where we have label Yn for n ∈ ℒ.
One particular choice for the discriminative model we can use for the case/control classification of patients is the logistic regression:
where the linear model ℋ : An →f(An) = AnΘ + θ and (Θ, θ) are parameters in the model ℋ. It follows that
In addition to the log-loss for probabilistic model, other loss terms can also be used with the linear model ℋ. We consider the hinge loss for (An, Yn):
and
| (7) |
The details on how to solve the optimization problem can be referred to [14].
4 Empirical Evaluation
In this section, we evaluate the effectiveness of our temporal signature identification approach on real-world patient Electronic Health Record (EHR) data warehouse, which includes the records of 319,650 patients over 4 years. We use the diagnosis information of the first three digits of ICD-9 (which stands for International Classification of Disease, 9th Version) code and the medication information in terms of drug ingredients to construct the EHR sequences. The temporal graphs are constructed from those sequences according to Definition 1. We will study the following two specific problems:
Hospitalization Prediction
We identify a set of 430 Congestive Heart Failure (CHF) patients with Chronic Obstructive Pulmonary Disease (COPD) pre-condition. Among them 100 are hospitalized within one year after CHF confirmation, the rest 330 patients are not. The goal is to make use of the records 360 days prior to the CHF confirmation date to predict whether the patients will be hospitalized or not within one year after CHF confirmation. The graphical illustration of this setting is in Figure 3 (a).
Figure 3:

Experimental settings of hospitalization prediction and CHF onset risk prediction.
Disease Early Prediction
We first identify a set of 1127 case patients who are confirmed with Congestive Heart Failure (CHF), and then construct a set of 3850 group matched controls. For every patient, we set an operation criterion date, which is the CHF confirmation date for case patients, the day of the last record in our database for control patients. We then trace back from the operation criterion date, hold off the records within the prediction window (180 days), and use the records in observation window (360 days) for analysis. The graphical illustration of such setting is in Figure 3 (b).
In our experiments, the temporal graphs are constructed from the patient EHR sequence in observation window. Figure 4 show example temporal graphs of case and control patients for both data sets, where similar as in Figure 2, we use thicker edges to denote stronger weights (which suggests shorter intervals). We tested the different strategies introduced in Section 3 to learn the temporal phenotypes. The composition coefficients for every patient will be used as their vector representations for the prediction tasks. For comparison purpose, we also implemented the following baselines
Aggregated Vector Representation (AV). This method represents every patient as a vector with dimensionality equal to the number of distinct medical events in all patients’ EHR records. The value on a specific dimension is just the frequency of the corresponding event in his/her EHR sequence.
Bag-of-Pattern Representation (BP). This method first run a standard sequential pattern mining algorithm to detect frequent patterns from the patients’ EHR sequences, and those patterns will be combined together to form a pattern repository. Every patient will be represented as a vector with dimensionality equal to the size of such pattern repository. The value on a specific dimension will be the frequency that pattern appeared in the EHR sequence of the corresponding patient.
Event Signature Representation (ES). This method implements the temporal signature mining algorithm proposed in [22], which identifies the temporal patterns in patient EHRs via a constrained optimization procedure. The patients will still be represented by the bag-of-pattern representation as in the BPS method.
Figure 4:

Temporal graph examples of a case and control patient in CHF prediction data.
After the vector based representation for every patient is derived, we then adopt Support Vector Machine (SVM) to perform prediction. The classification performance is measured by Area Under the Receiver Operating Characteristics Curve (AUC), Area Under the Precision Recall Curve (AUPR), and Accuracy (ACC), and these measures are averaged over 10-fold cross validation. The parameters in our methods are tuned with a greedy grid search strategy as follows. We first construct the temporal graphs using the unsupervised method, and the locality controlling factor r is tuned with cross validation on the prediction results using the signatures detected from the constructed graph. Then the number of bases is tuned based on the prediction results with unsupervised signature identification. Finally the tradeoff parameter for regularized signature identification methods is tuned with r and number of signatures fixed. In both studies, we set Δ = 90 days, as both are chronic disease scenarios.
Table 1 summaries the quantitative results with parameters chosen in the ways described above. From the table we can observe that: (1) Prediction using the signatures mined from our proposed methods can achieve better prediction performance compared to those baselines, which suggests the effectiveness of the proposed graphical scheme; (2) Regularized signature identification can produce better results because they utilizes supervision information.
Table 1:
The classification performance over 10-fold cross validation on two real-world data sets. “Un” refers to our method without any regularizations. “Sim” is our method with similarity based regularization. “Logit” and “Hinge” represent our method with logistic and hinge loss regularizations.
| Data | Metric | AV | BP | ES | Temporal Signature Identification | |||
|---|---|---|---|---|---|---|---|---|
| Un | Sim | Logit | Hinge | |||||
| CHF | AUC | 0.70±0.03 | 0.69±0.04 | 0.67±0.02 | 0.71±0.02 | 0.69±0.03 | 0.72±0.01 | 0.72±0.04 |
| APR | 0.41±0.05 | 0.52±0.06 | 0.37±0.04 | 0.62±0.01 | 0.60±0.04 | 0.65±0.01 | 0.62±0.03 | |
| ACC | 0.76±0.02 | 0.77±0.08 | 0.77±0.02 | 0.77±0.02 | 0.78±0.02 | 0.79±0.01 | 0.80±0.04 | |
| Hospitalization | AUC | 0.56±0.11 | 0.67±0.05 | 0.65±0.06 | 0.73±0.08 | 0.71±0.10 | 0.73±0.06 | 0.69±0.10 |
| APR | 0.32±0.09 | 0.58±0.13 | 0.38±0.07 | 0.64±0.04 | 0.65±0.15 | 0.67±0.12 | 0.64±0.16 | |
| ACC | 0.65±0.11 | 0.75±0.05 | 0.73±0.08 | 0.76±0.07 | 0.80±0.07 | 0.79±0.04 | 0.77±0.05 | |
In addition to the quantitative results, it would also be interesting to examine the validity of the detected temporal signatures qualitatively. We present three signatures with largest magnitude of the average composition coefficients for each data set in Figure 5 and 6 respectively. For all three signatures in Figure 5 we can clearly observe the drug hubs for treating CHF such as diuretics, beta blockers, ACE inhibitors; drug hubs for treating COPD such as glucocorticoids and bronchodilators; disease hubs that is related to CHF, such as CHF and dyslipidemia; as well as COPD disease hubs including pulmonary disease and asthma. One interesting observation is that on both signature II and III, there is an isolated pattern from opioid analgesics long acting to short acting. Opioid analgesics is used to relieve severe pain. The transition from long acting to short acting may suggest the patients’ condition deteriorates. In Figure 6 signature I there are three hubs in the middle, nutritional disorders, hypertension and complications. Hypertension is highly correlated with CHF [12], and nutrition disorders may also lead to CHF [21]. Also CHF is a complicated chronic disease and it may cause severe complications. Signature II is a single-hub structure with major symptoms in the center, which suggests the clinical pathway starts from some checking (major symptoms found). One interesting finding is that the transition from major symptoms to hypertension and heart arrhythmias are shorter than other diseases and drugs, and both of them are high risk factors for CHF (for the role of heart arrhythmia one can refer to [1]). Signature III is with heart arrhythmia in the center, other disorders distributed around it. Thus this represents a clinical pathway originated from heart arrhythmia, which is highly correlated with CHF.
Figure 5:

Example of temporal phenotypes of hospitalization prediction data. The number following a drug name indicates the severity of the disease, i.e., the drug is used to treat which stage of CHF. The three digits in the parentheses correspond to the first three digits of ICD-9.
Figure 6:

Example temporal graph bases of CHF prediction data. The three digits in the parentheses correspond to the first three digits of ICD-9.
5 Discussions
Despite the promising quantitative and qualitative results, there are several aspects of this framework that we want to specifically discuss here.
Comparing to sequence based representation, graph based representation is more compact, but at the same time it will suffer from information loss. For example, if a pair of consecutive events with the same temporal ordering repeat multiple times within the EHR of a specific patient, they will only appear once in the constructed temporal graph and the weight of the edge linking them will be aggregated from all the durations between their appearances. Usually the trends of the variations of such durations between repeated pairwise events can be indicative of the progression of some impending disease conditions. Therefore a smart way of encoding such information to the constructed temporal graph would be a great enhancement to the current representation.
The graph construction process would be computationally expensive if the number of distinct events is large, and the following basis learning process will be time consuming as well because it is correlated with the dimensionality of the graph adjacency matrix, which is the number of the distinct events. One potential strategy that could make this process more efficient is the multilevel/hierarchical graph learning approach [23], where we can construct a hierarchy of graphs from coarse to fine by utilizing the event ontology. The patterns can be detected from the coarsened graph efficiently and refined to more detailed levels.
As can be seen from Figure 5 and 6, the detected temporal signatures could be messy because of the high variability of the patient EHRs. Besides the multilevel strategy, it would also be interesting to investigate sparsity induced regularizers, which can make the learned signatures more interpretable and clear.
6 Conclusion
In this paper, we proposed a novel graph based representation for patient EHRs, which encodes distinct medical events as well as their temporal relationships. Compared to traditional sequence and matrix based representations, graphs are more compact and intuitive. We presented several approaches to identify interesting temporal phenotypes based on such graph based representation, and validated their effectiveness on real-world data sets.
References
- [1].Dean John W, Lab Max J. Arrhythmia in heart failure: role of mechanically induced changes in electrophysi-ology. The Lancet. 1989;333(8650):1309–1312. doi: 10.1016/s0140-6736(89)92697-4. [DOI] [PubMed] [Google Scholar]
- [2].David Gotz, Fei Wang, Adam Perer. A methodology for interactive mining and visual analysis of clinical event patterns using electronic health record data. Journal of biomedical informatics. 2014;48:148–159. doi: 10.1016/j.jbi.2014.01.007. [DOI] [PubMed] [Google Scholar]
- [3].Ho Joyce C, Ghosh Joydeep, Steinhubl Steve R, Stewart Walter F, Denny Joshua C, Malin Bradley A, Sun Jimeng. High-throughput candidate phenotype generation via tensor factorization. Journal of biomedical informatics. 2014;52:199–211. doi: 10.1016/j.jbi.2014.07.001. [DOI] [PMC free article] [PubMed] [Google Scholar]
- [4].Ho Joyce C, Ghosh Joydeep, Sun Jimeng. Marble: high-throughput phenotyping from electronic health records via sparse nonnegative tensor factorization. Proceedings of the 20th ACM SIGKDD international conference on Knowledge discovery and data mining; ACM; 2014. pp. 115–124. [Google Scholar]
- [5].Hripcsak George, Albers David J. Next-generation phenotyping of electronic health records. Journal of the American Medical Informatics Association. 2013;20(1):117–121. doi: 10.1136/amiajnl-2012-001145. [DOI] [PMC free article] [PubMed] [Google Scholar]
- [6].Jensen Peter B, Jensen Lars J, Brunak Søren. Mining electronic health records: towards better research applications and clinical care. Nature Reviews Genetics. 2012;13(6):395–405. doi: 10.1038/nrg3208. [DOI] [PubMed] [Google Scholar]
- [7].David Kale, Zhengping Che, Yan Liu. Computational discovery of physiomes in critically ill children using deep learning [Google Scholar]
- [8].Eamonn Keogh, Kaushik Chakrabarti, Sharad Mehrotra, Michael Pazzani. Locally adaptive dimensionality reduction for indexing large time series databases. In proceedings of ACM SIGMOD Conference on Management of Data; 2001. pp. 151–162. [Google Scholar]
- [9].Eamonn Keogh, Kaushik Chakrabarti, Michael Pazzani, Sharad Mehrotra. Dimensionality reduction for fast similarity search in large time series databases. Knowledge and information Systems. 2001;3(3):263–286. [Google Scholar]
- [10].Eamonn Keogh, Selina Chu, David Hart, Michael Pazzani. An online algorithm for segmenting time series. Data Mining, 2001 ICDM 2001, Proceedings IEEE International Conference on; IEEE; 2001. pp. 289–296. [Google Scholar]
- [11].Lasko Thomas A, Denny Joshua C, Levy Mia A. Computational phenotype discovery using unsupervised feature learning over noisy, sparse, and irregular clinical data. PloS one. 2013;8(6):e66341. doi: 10.1371/journal.pone.0066341. [DOI] [PMC free article] [PubMed] [Google Scholar]
- [12].Levy Daniel, Larson Martin G, Vasan Ramachandran S, Kannel William B, Ho Kalon KL. The progression from hypertension to congestive heart failure. Jama. 1996;275(20):1557–1562. [PubMed] [Google Scholar]
- [13].Jessica Lin, Eamonn Keogh, Stefano Lonardi, Bill Chiu. A symbolic representation of time series, with implications for streaming algorithms. Proceedings of the 8th ACM SIGMOD workshop on Research issues in data mining and knowledge discovery; ACM; 2003. pp. 2–11. [Google Scholar]
- [14].Chuanren Liu, Fei Wang, Jianying Hu, Hui Xiong. Temporal phenotyping from longitudinal electronic health records: A graph based framework. Proceedings of the 21st ACM SIGKDD international conference on Knowledge discovery and data mining; ACM; 2015. [Google Scholar]
- [15].Fabian Mörchen, Dmitriy Fradkin. SDM. SIAM; 2010. Robust mining of time intervals with semi-interval partial order patterns; pp. 315–326. [Google Scholar]
- [16].Fabian Mörchen, Alfred Ultsch. Efficient mining of understandable patterns from multivariate interval time series. Data Mining and Knowledge Discovery. 2007;15(2):181–215. [Google Scholar]
- [17].Robert Moskovitch, Yuval Shahar. Medical temporal-knowledge discovery via temporal abstraction. AMIA annual symposium proceedings; American Medical Informatics Association; 2009. p. 452. [Google Scholar]
- [18].Adam Perer, Fei Wang. Frequence: interactive mining and visualization of temporal frequent event sequences. Proceedings of the 19th international conference on Intelligent User Interfaces; ACM; 2014. pp. 153–162. [Google Scholar]
- [19].Yuval Shahar, Musen Mark A. Knowledge-based temporal abstraction in clinical domains. Artificial intelligence in medicine. 1996;8(3):267–298. doi: 10.1016/0933-3657(95)00036-4. [DOI] [PubMed] [Google Scholar]
- [20].Michael Stacey, Carolyn McGregor. Temporal abstraction in intelligent clinical data analysis: A survey. Artificial intelligence in medicine. 2007;39(1):1–24. doi: 10.1016/j.artmed.2006.08.002. [DOI] [PubMed] [Google Scholar]
- [21].von Haehling Stephan, Wolfram Doehner, Anker Stefan D. Nutrition, metabolism, and the complex pathophysiology of cachexia in chronic heart failure. Cardiovascular research. 2007;73(2):298–309. doi: 10.1016/j.cardiores.2006.08.018. [DOI] [PubMed] [Google Scholar]
- [22].Wang Fei, Lee Noah, Hu Jianying, Sun Jimeng, Ebadollahi Shahram, Laine Andrew F. A framework for mining signatures from event sequences and its applications in healthcare data. Pattern Analysis and Machine Intelligence, IEEE Transactions on; 2013. pp. 272–285. [DOI] [PubMed] [Google Scholar]
- [23].Wang Fei, Zhang Changshui. SDM. SIAM; 2007. Fast multilevel transduction on graphs; pp. 157–168. [Google Scholar]
- [24].Zhou Jiayu, Wang Fei, Hu Jianying, Ye Jieping. From micro to macro: Data driven phenotyping by densification of longitudinal electronic medical records. Proceedings of the 20th ACM SIGKDD international conference on Knowledge discovery and data mining; ACM; 2014. pp. 135–144. [Google Scholar]