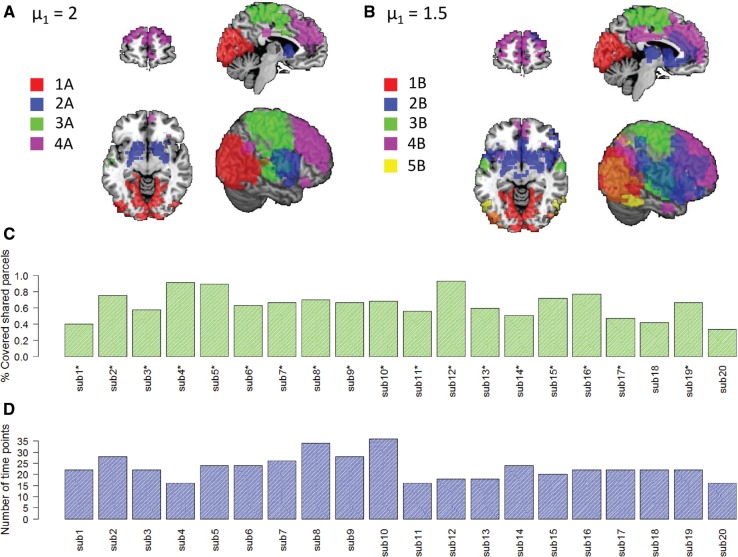
Fig. 5.
Results of the fMRI analysis. (A) The core module rows of the solution with . (B) The core module rows of the solution with . (C, D) Examples of subject-specific statistics. This example shows the results for core module 4B. (C) The percent of core module parcels covered by the private modules. Asterisks indicate subjects whose private module had a significant overlap (hyper-geometric ) with the core module. (D) The number of time points in each private module

