Abstract
There is a need to develop inexpensive, portable and easy-to-use devices for viral sample processing for resource-limited settings. Here we offer a solution to efficient virus capture by incorporating macroporous materials with regular structures into microfluidic devices for affinity chromatography. Two-dimensional simulations were first conducted to investigate the effects of two structures, a nanopost array and a spherical pore network, on nanoparticle capture. Then, the two structures were created in polymers by templating anodic aluminum oxide films and 3D close-packed silica particles, respectively. When the microdevices containing functionalized porous materials were tested for human immunodeficiency virus (HIV) isolation, capture efficiencies of 80–99% were achieved under a continuous flow. Comparatively, functionalized flatbed microchannels captured around 10% of HIV particles. As the characteristic dimensions of the nanostructures are tunable, such devices can be adapted for the capture of different submicron bioparticles. The high capture efficiency and easy-to-operate nature suit the need of resource-limited settings and may find applications for point-of-care diagnostics.
Introduction
Effective separation and concentration of viruses or their biomarkers are essential steps in performing accurate and reliable viral load measurements for clinical diagnostics. However, current techniques such as ultracentrifugation,1 electrophoresis,2–4 chromatography,5–8 or magnetic beads based separation,9 require sophisticated equipment, skilled technicians and/or expensive reagents. These requirements inevitably limit accessibility of viral diagnostics in resource-limited regions.
To address the problem, lab-on-a-chip devices have been developed to process biofluids containing viruses or other nanoparticles. These devices can be integrated with micro-detectors for rapid and cost-effective analysis of biological samples at the point of need.10–12 Employing an ultrafiltration process, several types of porous membranes have been encapsulated into microfluidic devices to physically capture whole particle viruses.13–15 However, these approaches cannot distinguish target particles from non-target species of comparable sizes, which may interfere with downstream detection. On the other hand, affinity separation offers more biochemical specificity.16–18 Chen et al.19 designed micro-mixers to promote the capture of human immunodeficiency virus (HIV) by antibody-functionalized magnetic beads in microchannels. The capture efficiency is limited to 60%, likely due to the difficulty of predicting and optimizing the collision between target species and magnetic beads. Alternatively, porous matrices with regular structures and pore sizes comparable to the targets offer the opportunity to control the interaction between analyte and affinity groups.20 Conventional chromatography matrices for viral and microvesicle separation,8,21 such as agarose gels or packed beads, have a broad pore size distribution. Nanostructured materials possessing characteristic dimension comparable to bionanoparticles, narrow pore size distribution and a regular pore structure are desirable for highly efficient viral isolation.
As a scalable and clean-room free approach, templating synthesis has been used to create various ordered nanostructures.22,23 In the form of macroporous matrices with interconnected pores on the submicron scale, two types of templated geometries have been reported. Yanigishita et al.24 utilized anodic aluminum oxide (AAO) porous membranes as a template to form ordered polymer nanopost arrays. Chen et al.25 further embedded high aspect ratio nanopost arrays from AAO replication into microfluidic devices that function as bioreactors. Gates et al.26 and Weldon et al.27 fabricated monolithic matrices with interconnected spherical pores by templating close-packed microbeads. In these porous materials, the pore geometries are regular and pore sizes are tunable within a wide range by selecting appropriate templates.26,28 These nanotemplated matrices have not yet been tested for viral separation.
Herein, we investigated two macroporous structures, a nanopost array and a spherical pore network, for viral capture in a microfluidic format. We first performed computational fluid dynamics simulations to understand how pore geometry influences the interaction between nanoparticles and porous matrices. Next, we created materials with regular macropores and integrated them into microfluidic devices. We then studied the capture efficiencies of HIV particles in the functionalized nanomaterials and compared them to capture efficiencies in flatbed devices.
Experimental
Computational fluid dynamics simulation
Creeping Flow Module and Particle Tracing for Fluid Flow Module were coupled in COMSOL Multiphysics to study the nanoparticle capture efficiency. The characteristic repeating units were used as the capture bed: a hexagonal array of circle islands was used to represent a 2D section of a nanopost array, and an array of interconnected circular voids represented a 2D section of a spherical pore structure. The shortest separation distance (D) between the circular islands or of the pore neck was varied in the sub-micron range from 200 to 600 nm (targeting average HIV particle size of 110–164 nm)29. The hexagon diagonal and void diameter (W) were varied accordingly to maintain a constant D/W ratio of 0.2. The particle density was 1.05 g/cm3 and the diffusion coefficient was set at 5 μm2/s, corresponding to the values of HIV virions in plasma. An average inflow velocity of 400 μm/s was introduced along with 1000 particles per micron uniformly distributed at the inlet. Particle-particle interaction was neglected. Drag force and Brownian force were introduced using the COMSOL built-in formulation and centroids of the particles were tracked. The inlet was set 1.5 μm away from the capture zone to allow the particle convection to fully develop. The density and viscosity of fluid were 1.00 g/cm3 and 1 mPa·s. For comparison, capture in a flat channel with a wall-to-wall separation of 30 μm and length of 10 μm was also simulated. All capture surfaces were specified to be 100% binding probability after particle-surface collision.
Materials
SU-8 photoresist was purchased from MicroChem (Newton, MA). Sylgard 184 silicone elastomer kit was purchased from Dow Corning (Midland, MI). 99.997% aluminum foil, 85% aq. soln. phosphoric acid and 98% anhydrous copper (II) chloride were purchased from Alfa Aesar (Ward Hill, MA). Polymethyl methacrylate (PMMA) and polystyrene (PS) sheets were obtained from Plaskolite (Columbus, OH). A binary suspension containing 20 vol% of 1-μm silica beads and 8 vol% of 100-nm PS beads in water was kindly provided by Professor Gilchrist at Lehigh University (Bethlehem, PA). Methyl methacrylate (MMA) monomer, EDC (N-(3-Dimethylaminopropyl)-N′-ethylcarbodiimide), NHS (N-hydroxysuccinimide sodium salt), and lyophilized bovine serum albumin (BSA) were purchased from Sigma Aldrich (St. Louis, MO). PMMA fine granules (M.W. 97000, M.N. 44700, Acros Organics) were purchased from Fisher Scientific (Pittsburgh, PA). Benzoin methyl ether was obtained from Electron Microscopy Sciences (Hatfield, PA). Phosphate buffered saline (PBS) was obtained from Mediatech (Herndon, VA). NeutrAvidin biotin-binding protein was purchased from Thermo Scientific (Rockford, lL). An HIV-1 p24 enzyme-linked immunosorbent assay (ELISA) kit was obtained from Perkin-Elmer (Waltham, MA). Polystyrene nanobeads 100 nm in diameter (internally dyed with Firefli™ Fluorescent Red (Ex 542/Em 612 nm)) was obtained from Thermo Scientific (Fremont, CA).
Device fabrication
Three types of microfluidic devices were fabricated: flatbed channels, porous channels with hexagonal post arrays and with spherical porous networks.
Flatbed devices
PMMA and PS flatbed devices were fabricated by an embossing process. First, SU-8 patterns of 50 mm × 25 mm × 30 μm were created on a silicon wafer by standard photolithography. Polymer sheets were cut into 40 × 8 mm2 pieces and holes were drilled as the inlet and outlet. The polymer pieces were then manually pressed onto the SU-8 pattern at 120 °C to form a 25 mm long indentation along the length of polymer piece. Next, the indented surface was glued to a flat sheet of the same material with epoxy and the sides were sealed. Finally, tubing was inserted into the inlet and outlet and fixed by epoxy. The channel dimension was 25 mm × 8 mm × 30 μm (Figure 1(A1–A2)).
Figure 1.
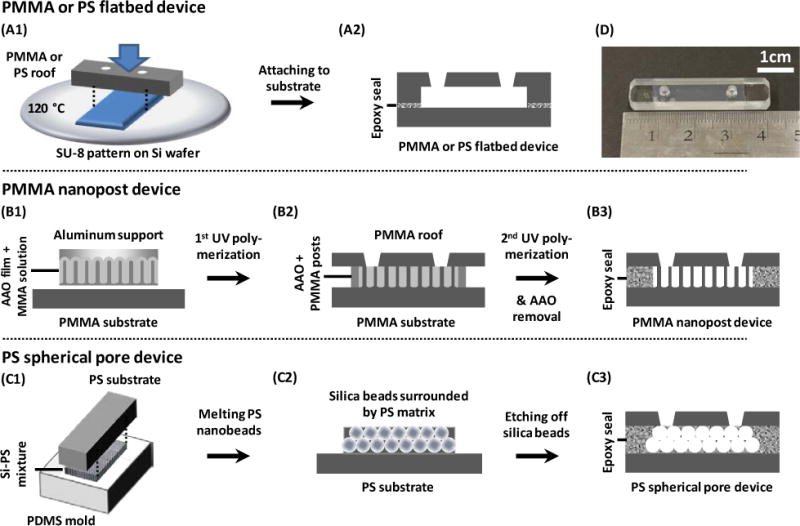
Schematics showing the fabrication processes of (A) PMMA and PS flatbed devices, (B) PMMA nanopost devices, and (C) PS spherical pore devices. (A1) A microchannel was formed on the substrate by manual embossing. (A2) The open channel was attached to a second flat sheet of the same material by epoxy glue, creating a flatbed microchannel. (B1) An array of PMMA nanoposts was fabricated through polymerizing MMA in an AAO template. (B2) The aluminum support was chemically removed and the newly opened top was attached to a PMMA roof by MMA and UV-polymerization. (B3) The PMMA nanopost device was created after chemically removing the AAO and sealing the sides. (C1) A binary suspension of silica and PS was deposited onto a PDMS mold. The PS beads were melted and glued to a PS substrate. (C2) The PDMS mold was detached and silica beads were etched away. (C3) A PS roof was attached to the PS porous structure and the sides were sealed, creating a PS spherical pore device. (D) Photograph of a typical microfluidic device containing nanopost arrays and inlet/outlet ports. Devices with spherical pores have a similar appearance.
Microchannels with nanopost arrays
The PMMA nanopost devices were fabricated by templating AAO films. First, aluminum foil was anodized at 195 V in 0.1M phosphoric acid mixed with ethanol at −7 °C via a two-step anodization.28 After pore widening in 0.1M phosphoric acid for 1 hr at room temperature, the AAO sample was cut into 25 mm × 10 mm pieces. A pre-polymerization solution containing MMA monomer, 1% w/v PMMA granules, and 1% w/v benzoin methyl ether was then introduced into the AAO nanopores under vacuum for 15 min.25 After drying, the monomer-treated side was attached to a flat PMMA substrate dampened by the pre-polymerization solution, and the assembly was exposed to ultraviolet light for 30 min. Next, the back aluminum was removed by a CuCl2 solution and the AAO pore barrier was opened by immersing the sample in 1.5M phosphoric acid for 5.5 hr. The newly exposed backside was then attached to another piece of PMMA flat sheet that had inlet and outlet holes drilled into it. The pre-polymerization solution was pipetted onto the contact surface and UV-polymerized. Subsequently, the sides of the assembly were cut open to allow AAO film removal in 20 wt% NaOH for several days. After rinsed and immersed in de-ionized (DI) water overnight with gentle stirring, the device was lyophilized to ensure standing PMMA nanoposts.25 Eventually the sides were sealed, and tubing was connected by epoxy glue. The footprint of the nanopost-covered region was 25 × 8 mm2 and the nanoposts were ~25–30 μm tall (Figure 1(B1–B3)).
Microchannels with spherical pores
The PS spherical pore devices were fabricated by templating close-packed silica beads. First, a polydimethyl siloxane (PDMS) open channel of 25 mm × 8 mm × 30 μm was fabricated using standard soft lithography. Then, 20 μL of a binary suspension of 1-μm silica and 100-nm PS in DI water was pipetted into the PDMS channel. The PDMS surface was pretreated by a plasma gun to promote spreading of the suspension throughout the open channel. After drying, the silica beads self-assembled into ordered structures with the PS beads filling the interstitial space. Next, the PS nanobeads were melted at 240 °C for 10 min. The sample was glued to a PS flat sheet by epoxy glue and the PDMS mold was peeled off. Afterwards, silica beads were removed in 50% hydrofluoric acid and the device was rinsed in DI water. The porous matrix was attached to a flat piece of PS with drilled inlet and outlet by double-sided tape. Finally, the sides were sealed and the device was connected to tubing with epoxy glue. The porous region was 25 mm × 8 mm × 30 μm (Figure 1(C1–C3)).
The templates and macroporous structures were characterized by a field-emission scanning electron microscope (FE-SEM – Hitachi 4300) and the geometries were measured from the SEM images using ImageJ software.
Measurement of fluid permeability
DI water was driven through the microfluidic devices at a constant pressure between 1 and 3 psi. The outflow was collected and weighed. The volume flow rate of water was then used to calculate the permeability of the devices.
Surface modification
All devices were washed with 70% isopropanol and DI water prior to surface functionalization. PMMA devices were hydrolyzed with 3 M sulfuric acid at 60 °C for 20 min and rinsed with DI water.30 Then, the devices were exposed to the coupling reagents containing 1.6 mM EDC and 1 mM NHS in 50 mM MES buffer (pH 5.4) for 20 minutes at room temperature and rinsed with the MES buffer following the protocol in the literature.31 Afterwards, 20 μg/mL NeutrAvidin was injected into the devices and incubated for 2 hr before rinsing and viral capture.
Polystyrene was functionalized by physisorption of NeutrAvidin for 2 hrs in PBS. To ensure comparable NeutrAvidin density on PS and PMMA substrates, PS flat substrates of 1×1 cm2 were first physisorbed with NeutrAvidin at different concentrations of 0–20 μg/mL. To account for the difference in substrate materials, the concentration that yielded a comparable viral capture to that of PMMA was then selected to treat the porous PS devices. To evaluate binding specificity, 1% BSA/PBS was used in the place of NeutrAvidin. After 2 hr incubation with NeutrAvidin or 1% BSA/PBS at room temperature, all devices were rinsed with 1% BSA/PBS before the viral capture test.
Viral production
Pseudotyped HIV was cultured and biotinylated32 as previously reported.33 Briefly, HEK-293T cells were transfected with four plasmids of pGag-eGFP, pcRev, pR8ΔEnv, and pJR-FL in DMEM using MegaTran 1.0. After a 24–48 hr incubation period, the cells were washed with PBS and biotinylated with 1.67 mM Sulfo-NHS-LC-Biotin in PBS. The cells were incubated at room temperature for 30 min, then washed with PBS and 100 mM glycine to remove excess biotin, and re-incubated in HEK cell culture media. After incubation for another 24 hrs, the supernatant was filtered and centrifuged to concentrate the biotinylated HIV particles. The viral pellet was resuspended in the cell culture medium and stored at −80 °C. Biotinylated viruses were used as a model system here to demonstrate broad application of the capture bed. In practice, target viral particles can be pre-labelled with biotinylated antibodies before capture in the avidin-functionalized solid matrices. The pre-labelling process can also increase the epitope density and increase the capture probability.
Viral capture in microfluidic devices
Unless specified, biotinylated HIV at a concentration of ~106 virions/mL was injected into the devices by a syringe pump at a constant flow rate of 5 μL/min for a total volume of 320 μL. Afterwards, all devices were washed with 90 μL of PBS and 300 μL of 0.5% Triton X-100, both at 5 μL/min. The outflow during the viral injection, PBS wash, and Triton wash steps were collected separately. Then, a p24 ELISA kit was used to quantify the amount of p24 protein in the different outflow fractions. The input viral solutions were also analyzed to confirm mass balance between input and output solutions. Four devices were tested in each condition. For Figure 6, HIV at different concentrations were injected into the spherical pore devices. The flow, lysis and assay conditions were the same as described above.
Figure 6.
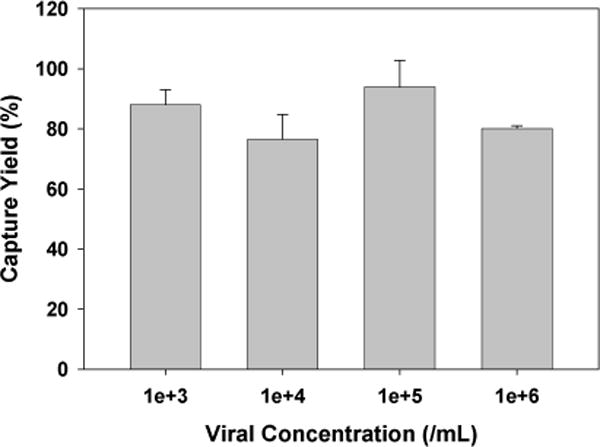
HIV capture efficiency in the spherical pore devices with surface treatment by NeutrAvidin. The error bars represent standard deviation from 4 trials.
Capture of 100-nm fluorescent PS beads in microfluidic devices
The suspension of 100-nm fluorescent PS beads (1 vol%) was utilized to visually observe non-specific binding in PMMA and PS porous devices. The devices were passivated with 1% BSA/PBS for 2 hr and the suspension containing 100-nm fluorescent nanobeads was then injected into the devices at 5 μL/min for 1 hr, followed with 60 μL PBS rinse at 5 μL/min. Fluorescence images were taken afterwards along the flow direction in the center line at four different distances from the inlet. The fluorescence intensities were measured and the background intensity before injecting the particles was subtracted. Three devices of each geometry were tested. The images were processed by ImageJ software.
Results and Discussion
Computational analysis of nanoparticles captured in porous media
We first investigated through COMSOL simulation how the capture bed geometry affects the probability of particle-matrix collision. Three types of geometries were evaluated: hexagonally arranged circular islands, interconnected circular voids, and two parallel plates, which represent the building blocks of the post array, spherical pore array, and flatbed channel. Two transport processes were considered, advection along the fluid streamlines and diffusion that crosses streamlines. The latter plays significant roles when the characteristic length of the capture bed is comparable to the nanoparticle dimension: the Péclet number (Pe) is on the order of 1 when 100 nm particles are convected at 100 μm/s in a matrix with a characteristic length of 100 nm. Figure 2(A) – 2(C) present distinct fluid streamlines in the three geometries. The nanostructures are seen to break the parallel input streamlines into branches and shorten the average diffusion distance for nanoparticles to interact with the affinity wall.
Figure 2.
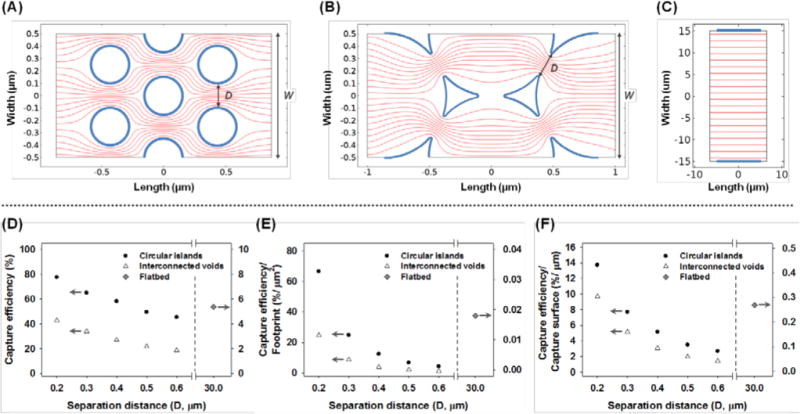
Simulation results of streamlines in (A) a hexagonal array of circle islands, (B) an interconnected void array and (C) two parallel plates. The bold boundaries represent the affinity capture surface. The effects of the separation distance, D, on the capture efficiency are shown in (D) total capture efficiency, (E) capture efficiency normalized to the capture bed footprint and (F) capture efficiency normalized to the capture surface area.
By reducing the separation distance D of the circular islands or pore neck from 600 nm to 200 nm, the capture efficiency increases from 45.38% to 77.65% in the circular island array and 18.63% to 42.68% in the interconnected circular void array (Figure 2(D)). To account for a difference in the unit cell dimension, the capture efficiency is normalized to the footprint of the capture bed, and it increases from 4.32% per μm2 to 66.60% per μm2 in the circular island array and 1.19% per μm2 to 24.64% per μm2 in the interconnected circular void array (Figure 2(E)). This improvement of ~16–20 times with a 3 time reduction of gap distance is consistent with the analysis by Squires et al. that the footprint-normalized capture efficiency scales with D−8/3 for diffusion controlled reactions on a planar sensor under a constant convective feed.34 Since D is the characteristic dimension in the nanostructured materials, it plays the determinant role in controlling the capture yield. Three-dimensional COMSOL simulation using nanoposts of the same diameter and separation but different heights indicate comparable capture yield, when the flow velocity remains the same, and the matrix thickness is significantly greater than D (Figure S1). Thus, capture is insensitive to the thickness of the matrices.
When footprint-normalized capture efficiencies are compared between the two macroporous structures, the circular island array achieves ~2.7 to 3.6 times higher capture for each separation distance. This is partially contributed by a larger surface area in the circular island array per footprint. Given the same D, the capture area of the circular island array is ~2 times that of the interconnected void array per μm2. Additional improvement beyond the surface area contribution (Figure 2(F)) is likely caused by the velocity and streamline profiles. The streamlines are more uniformly distributed in the circular island array, suggesting a relatively constant distance between each stream line and the capture surface. On the other hand, the distance between streamlines varies periodically in the circular void geometry, being closer at the pore neck and further apart at the circular void center. For a given separation distance, D, in the two geometries, the average diffusion distance for nanoparticles to interact with the walls is longer in the circular void geometry, leading to lower capture efficiencies.
Although the streamlines in flatbed were seen to be uniform, the distance between particles and capture walls are rather far away. As a consequence, the capture efficiency of a flatbed channel was found to be 5.38% or 0.02% per μm2 footprint. The Péclet number in the flatbed device is on the order of 1000, so only particles close to the capture surface have the opportunity to collide. The computational analysis suggests that nanostructures promote affinity binding compared to a flatbed channel, due to an increase of the surface area and reduction of Péclet number. The performance of nanostructures improves with the size match between the matrix gap separation and the target species as well as uniformity of the streamline distribution.
Fabrication of PMMA and PS macroporous device
To test virus capture experimentally, two macroporous materials, a high aspect-ratio nanopost array and a spherical pore array, were fabricated by templating synthesis. Following the simulation predication to match the characteristic dimension of the matrices to the target species, the separation distance was selected to be ~200 nm, slightly larger than the HIV particles of 110 nm.33
The PMMA nanopost arrays were fabricated by templating AAO films of straight pores. After two-step anodization in phosphoric acid, aluminum oxide self-orders into a hexagonally arranged pore array with a center-to-center distance of 503.45 ± 11.22 nm (Figure 3(A)). By UV-polymerizing MMA in the AAO template and dissolving the aluminum substrate and oxide template, solid straight PMMA nanoposts with a high aspect ratio of ~80 were successfully fabricated as shown in Figure 3(B). Nanopost arrays with even greater aspect ratios have been attempted, but significant clustering and collapsing have been observed. On the other hand, arrays of shorter nanoposts pose greater flow resistance and devices are more prone to leakage. Thus, nanoposts with an aspect ratio of 80 were selected for further biological tests. The average space between the nanoposts is 191.33 ± 34.68 nm. Assuming perfect replication of the AAO structure, the porosity of PMMA nanopost material is calculated to be 65.20% and the surface-to-volume ratio (Rs/v) is is 4.46 μm−1 for a 30 μm thick matrix, comparable to typical chromatographic media.35 In contrast, a flatbed channel of the same height has the Rs/v of 3.30 × 10⁻⁴ μm−1. Thus the Rs/v is enhanced by 4 orders of magnitude in the nanopost array.
Figure 3.
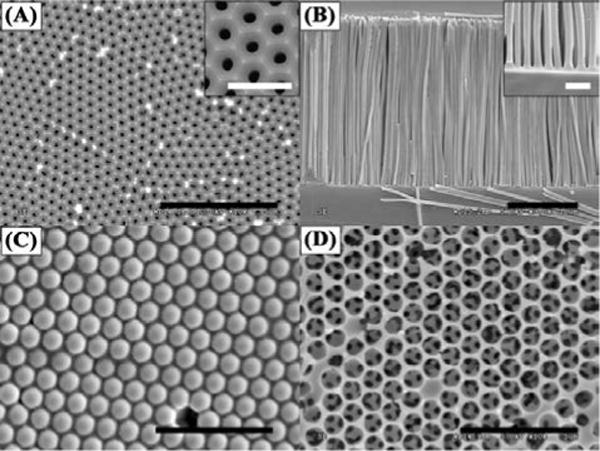
Representative SEM images of the templates and the replicated structures. (A) An AAO template with hexagonal arranged pores within each domain. The inset shows a zoom-in image of the AAO pore structure. (B) Standing PMMA nanoposts after templating AAO. The inset shows the separation of the nanoposts. (C) A template of 3D packed silica beads with PS filling the interstitial space. (D) A network of PS porous structure after silica bead removal. Scale bars in (A) – (D) are 5 μm and scale bars in the insets are 1 μm.
The PS spherical pore matrix was fabricated by templating self-assembled, close-packed silica beads of 990.50 ± 12.58 nm in diameter. The silica beads were co-deposited with 100-nm PS beads into a PDMS mold, and the PS was melted afterwards to form a matrix surrounding the silica beads (Figure 3(C)). After etching out the silica beads, a network of PS spherical pores with small, interconnected openings was revealed (Figure 3(D)). The average size of the openings was 232.55 ± 21.73 nm, similar to that reported by Gates et al. using 1 μm microbeads as a template.26 Assuming the silica beads form a close-packed structure and PS fills in the interstitial space perfectly, the theoretical Rs/v is 3.73 μm−1 for a 30 μm thick matrix. This Rs/v is slightly less than that of the PMMA nanopost array, but still ~4 orders magnitude greater than a flatbed device of the same volume. The characteristics of the PMMA nanopost array and PS spherical pore network are summarized in Table 1.
Table 1.
Physical characteristics of the flatbed and macroporous channels fabricated in this work.
| Device Structures | Channel Dimension (L × W × H) | Period (nm) | Separation Distance (nm) | Porosity*(%) | Rs/v*(μm−1) | Permeability (m2) |
|---|---|---|---|---|---|---|
| PMMA flat channel | 25 mm × 8 mm × 30 μm | NA | 30,000 | 100 | 3.30 × 10⁻⁴ | 5.61×10⁻¹¹ ± 2.87×10⁻¹² |
| PS flat channel | NA | 30,000 | 100 | 3.30 × 10⁻⁴ | 5.58×10⁻¹¹ ± 2.05×10⁻¹² | |
| Hexagonal array of PMMA nanoposts | 503.45 ± 11.22 | 191.33 ± 34.68 | 65.14 | 4.46 | 1.97×10⁻¹⁴ ± 7.59×10⁻¹⁶ | |
| Interconnected PS spherical pores | 990.50 ± 12.58 | 232.55 ± 21.73 | 74.17 | 3.73 | 1.43×10⁻¹³ ± 2.01×10⁻¹⁴ |
indicates calculated values assuming a perfect replication of the template.
Permeability in microchannels with macroporous matrices
Water permeability in the macroporous matrices was measured according to Darcy’s law of pressure driven flow:
| (1) |
where Q is the volume metric flow rate (m3/s), κ is the fluid permeability (m2), μ is the dynamic viscosity of fluid (Pa·s), A (m2) and L (m) are the cross-sectional area and length of the channel, and ΔP is the pressure drop across the channel (Pa). Q and ΔP were measured experimentally to compute κ. PMMA and PS flatbed channels have comparable permeability of ~5.60×10⁻¹¹ m2, while the channel with PS spherical pores has a permeability of 1.43×10⁻¹³ ± 2.01×10⁻¹⁴ m2, which is an order magnitude higher than that of the PMMA nanopost channel of 1.97×10⁻¹⁴ ± 7.59×10⁻¹⁶ m2 (Table 1). Various macroporous materials have been characterized in the literature for filtration applications, such as track-etched polycarbonate, polyethersulfone, and vertically aligned carbon nanotubes.11,32,36 The permeabilities of these materials are in the range of 10−15 to 10−13 m2, into which our materials also fall. Although the spherical pore matrix has ~20% less surface-to-volume ratio, the order-of-magnitude higher permeability may offer practical advantages considering low back pressure. In fact, a pressure of ~1 MPa (145 psi) is required to drive water through the PMMA post array at ~10 μL/min, and devices often leak at this pressure. Therefore, the viral capture experiments were carried out at a flow rate of 5 μL/min.
Viral capture in microchannels with macroporous matrices
After characterization of the physical properties, the two porous matrices were encapsulated into microfluidic devices and functionalized for viral capture. Since the two structures were fabricated with different materials, we first tested functionalization protocols to level the affinity chemistries on the two surfaces, so the contribution from the pore structures could be compared. PMMA flat substrates were immobilized with NeutrAvidin, while PS flat pieces of the same size were physisorbed with NeutrAvidin at concentrations of 0–20 μg/mL. The functionalized substrates were used for viral capture under static incubation. As presented in Figure 4, the PS flat substrate exposed to 10 μg/mL NeutrAvidin captures comparable amount of biotinylated HIV to that on the PMMA flat substrate. As a result, this concentration was used for surface modification of PS microchannels.
Figure 4.
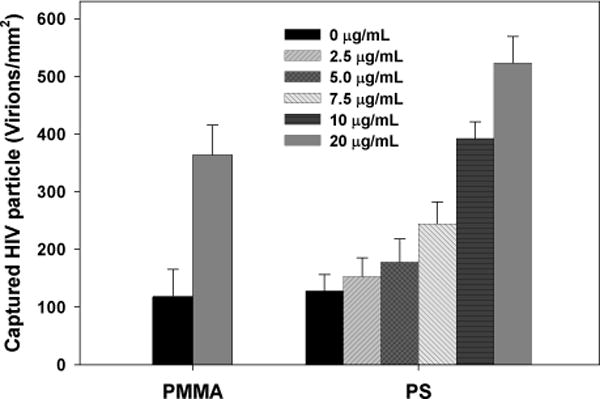
HIV virions captured on functionalized PMMA and PS flat substrates. The PMMA was functionalized with a fixed protocol but PS was exposed to different concentrations of NeutrAvidin from 0 to 20 μg/mL. PS treated with 10 μg/mL NeutrAvidin yielded a comparable amount of HIV viral capture to that on PMMA. The error bars represent standard deviation from 4 trials.
Capture of biotinylated HIV was performed in both the flatbed and porous microchannels under a constant flow of 5 μL/min with viral suspensions at 106 virions/mL. The numbers of HIV particles in the flow-through, rinse, and lysis fractions were quantified and normalized to the total amount of viruses flowed into the device. Figure 5 shows the results of capture efficiency in each device. As predicted from the simulation, the flatbeds are not efficient in viral capture: the functionalized PMMA and PS flatbed channels each capture 10.80 ± 0.51% and 8.88 ± 0.94% virus from the input sample. In flatbed channels lacking NeutrAvidin, the capture efficiency dropped to 1.62 ± 0.23% and 1.08 ± 0.25% respectively, suggesting surface functionalization is effective.
Figure 5.
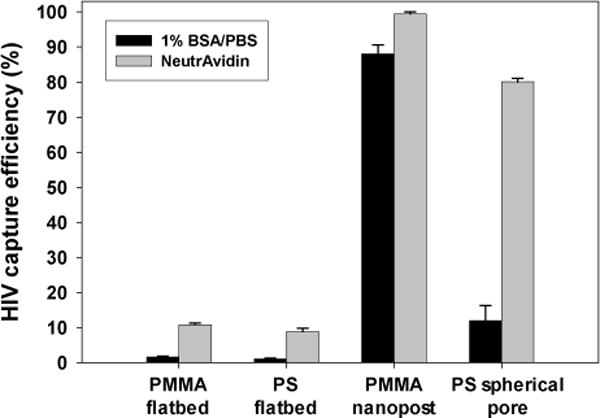
HIV capture efficiency in the flatbed and macroporous devices with surface treatment by 1% BSA/PBS or NeutrAvidin. The error bars represent standard deviation from 4 trials.
The regular macroporous structures significantly improve the capture efficiency. NeutrAvidin treated PMMA nanopost and PS spherical pore arrays each captured 99.46 ± 0.51% and 80.10 ± 0.92% of virus from the input sample. A longer device containing PS spherical pore network is expected to capture more viral particles, while the flow resistance and back pressure will also increase proportionally. The current dimension is selected to balance the capture yield and back pressure in the nanopost devices, and the same dimension is used to create the spherical pore devices and facilitate comparison.
Since clinical viral load can span a wide range, we further tested ccapture of biotinylated HIV at four different viral concentrations, from 1,000 to 1,000,000 vions/mL, under a constant flow of 5 μL/min. As seen in Figure 6, the capture yield remains around 80–90% in this wide range of viral concentrations.
Noticeably, non-specific binding in the nanopost array was found high: the PMMA nanopost devices without NeutrAvidin captured 88.03 ± 2.61% HIV versus 12.00 ± 4.27% in PS spherical pore matrices without NeutrAvidin (Figure 5). In contrast to a low nonspecific binding in flatbed devices, the macroporous devices demonstrate greater nonspecific capture yields, especially in PMMA nanopost devices. Significant nonspecific binding in the nanopost array is likely a result of structural defects, which form narrower spacing than the diameter of HIV particles and physically trap them. Despite all the precautions to preserve standing nanoposts, such as lyophilization and attaching both ends of the nanoposts to solid supports, deformation and collapse of high aspect ratio nanoposts remain unavoidable. According to the theoretical calculation by Hui et al.,37 PMMA nanoposts would experience lateral collapse when the aspect ratio reaches ~12 as a result of capillary and surface adhesive forces, which was also observed in our work if the nanoposts were not supported on both ends (Fig. S2). The high aspect ratio of 80 used in our work exceeds the critical value. Alternatively, non-polymeric nanoposts with better mechanical strength may maintain the standing geometry better, and could potentially reduce the defect-induced non-specific binding.25,38 To visualize physical trapping in the macroporous matrices, bare PS fluorescent nanobeads of 100 nm in diameter were flowed into the PMMA and PS porous devices. After rinsing, fluorescent images near the middle plane of the porous matrices were acquired as shown in Figure 7(A)–(B). In the PMMA device, bright fluorescent domains were observed, suggesting formation of nanopost clusters that physically retain the beads. The average width of the clusters is 53.54 ± 11.70 μm, consistent with bundling of high aspect ratio nanoposts reported in the literature.25,39 When the fluorescence intensity was quantitatively analyzed along the flow direction (Figure 7(C)), non-specific binding was observed from the inlet to the outlet in the nanopost devices. The larger error bars are consistent with clustering of the fluorescence intensity. On the other hand, fluorescence intensities remain rather uniform and low in the PS spherical pore devices, suggesting minimal structural collapse and a low level of non-specific binding. While COMSOL simulation predicts preferential viral capture around the pore neck of spherical pores, it remains challenging to observe this experimentally.
Figure 7.
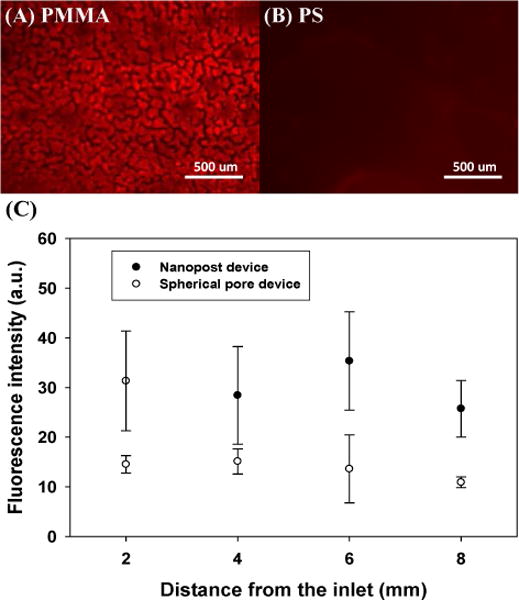
Physical retention of 100-nm fluorescent PS nanobeads in (A) a PMMA nanopost device and (B) a PS spherical pore device after rinsing. (C) Fluorescence intensity distribution along the channel length reveals greater non-specific binding of the fluorescent beads in the nanopost device. The error bars represent standard deviation from 3 trials.
Our work demonstrates that macroporous materials with regular structures can be incorporated into microfluidic devices for highly efficient viral separation. Despite a wide use of macroporous materials as size- exclusion media to decontaminate viruses from biopharmaceutical products,40 conventional matrices tend to have a broad size distribution, which makes it difficult to predict the target-matrix interactions. Our devices, which contain regular macroporous structures, facilitate theoretical understanding and practical optimization of the target-matrix collision. The affinity chemistry promotes specific capture of the target particles, especially in the spherical pore devices. Due to its small volume, the miniaturized device also concentrates target analyte by orders of magnitude. Furthermore, sample processing can be achieved in a simple flow-through process. Thus the device could be used for viral purification and enrichment in resource-limited settings. As a proof of principle, biotinylated HIV virus and NeutrAvidin are used in this work, while the surface can be modified by broad neutralizing antibodies,41 aptamers42,43 and other affinity molecules17 for the isolation of wild type viruses. While the macroporous matrices are prone to clogging in a sample containing both cells and viruses, these structures can serve as building blocks in a hierarchical material for viral separation from a complicated fluid such as blood. With recent biosensing applications in porous matrices,16,18,20 it is also plausible to incorporate electrical and optical sensors into our device to detect captured bionanoparticles For example, we are investigating an electrochemical sensor integrated into the spherical pore matrix for on-chip detection of captured whole particle viruses.
Anticipating other applications may demand macroporous structures of dimensions different from those in this work, the fabrication strategies presented here offer great geometrical flexibility. In terms of AAO templating, the pore size, porosity and interpore distance of AAO mold can all be independently adjusted in submicron range.28 Similarly, for the spherical pore structure, pore size and pore opening are controllable by the composition of the colloid suspension.26,27 The tunable sizes of these macroporous structures make them versatile tools for processing nanoparticles and biomolecules of different sizes and shapes.
Conclusions
Two different macroporous structures, a nanopost array and a spherical nanopore array, are studied in this work as affinity matrices for viral isolation. Computational analyses and experiments demonstrate significantly enhanced capture efficiency in the porous devices over flatbed channels, and the enhancement is attributed to large surface-to-volume ratios and short diffusion distance before interaction. While the nanopost arrays are shown to have higher capture efficiency than the spherical pore devices, structural defects associated with the high aspect ratio posts also generate higher nonspecific binding. Since macroporous structures of different characteristic dimensions can be formed by adjusting the template geometry, the templating approach to incorporate nanomaterials into microfluidic devices is potentially applicable for separation and concentration of a broad spectrum of bio-nanoparticles and biomolecules.
Supplementary Material
Acknowledgments
This work was supported by the National Institutes of Health No. 1R21AI081638 and PA Department of Health CURE Formula. Royal Thai Scholarship is acknowledged for the support of K.S. We acknowledge Dr. W. Misiolek for the advice in self-ordered AAO fabrication. We thank the Gilchrist lab for the binary suspension samples and Dr. Chao Zhao for helping with COMSOL simulation. We also thank C. Multari for kindly preparing cultured HIV stocks.
Footnotes
Electronic Supplementary Information (ESI) available: [details of any supplementary information available should be included here]. See DOI: 10.1039/x0xx00000x
Notes and references
- 1.Ehrnst A, Sonnerborg A, Bergdahl A, Strannegard O. J Med Virol. 1988;26:23–32. doi: 10.1002/jmv.1890260105. [DOI] [PubMed] [Google Scholar]
- 2.Welker R, Hohenberg H, Tessmer U, Huckhagel C, Krausslich HG. J Virol. 2000;74:1168–1177. doi: 10.1128/jvi.74.3.1168-1177.2000. [DOI] [PMC free article] [PubMed] [Google Scholar]
- 3.Mironov GG, Chechik AV, Ozer R, Bell JC, Berezovski MV. Anal Chem. 2011;83:5431–5435. doi: 10.1021/ac201006u. [DOI] [PubMed] [Google Scholar]
- 4.Kremser L, Blaas D, Kenndler E. Electrophoresis. 2004;25:2282–2291. doi: 10.1002/elps.200305868. [DOI] [PubMed] [Google Scholar]
- 5.Richieri SP, Bartholomew R, Aloia RC, Savary J, Gore R, Holt J, Ferre F, Musil R, Tian HR, Trauger R, Lowry P, Jensen F, Carlo DJ, Maigetter RZ, Prior CP. Vaccine. 1998;16:119–129. doi: 10.1016/s0264-410x(97)00196-5. [DOI] [PubMed] [Google Scholar]
- 6.Ehrlich LS, Agresta BE, Carter CA. J Virol. 1992;66:4874–4883. doi: 10.1128/jvi.66.8.4874-4883.1992. [DOI] [PMC free article] [PubMed] [Google Scholar]
- 7.Burden CS, Jin J, Podgornik A, Bracewell DG. J Chromatogr B. 2012;880:82–89. doi: 10.1016/j.jchromb.2011.10.044. [DOI] [PubMed] [Google Scholar]
- 8.Kalbfuss B, Wolff M, Morenweiser R, Reichl U. Biotechnol Bioeng. 2007;96:932–944. doi: 10.1002/bit.21109. [DOI] [PMC free article] [PubMed] [Google Scholar]
- 9.Lopez CA, Vazquez M, Hill MD, Colon MD, Porrata- Doria T, Johnston ICD, Lorenzo E. Arch Virol. 2010;155:895–903. doi: 10.1007/s00705-010-0659-3. [DOI] [PMC free article] [PubMed] [Google Scholar]
- 10.Sia SK, Linder V, Parviz BA, Siegel A, Whitesides GM. Angew Chem Int Ed Engl. 2004;43:498–502. doi: 10.1002/anie.200353016. [DOI] [PubMed] [Google Scholar]
- 11.Lee WG, Kim YG, Chung BG, Demirci U, Khademhosseini A. Adv Drug Deliv Rev. 2010;62:449–457. doi: 10.1016/j.addr.2009.11.016. [DOI] [PMC free article] [PubMed] [Google Scholar]
- 12.Workman S, Wells SK, Pau CP, Owen SM, Dong XF, LaBorde R, Granade TC. J Virol Methods. 2009;160:14–21. doi: 10.1016/j.jviromet.2009.04.003. [DOI] [PubMed] [Google Scholar]
- 13.Wang SQ, Sarenac D, Chen MH, Huang SH, Giguel FF, Kuritzkes DR, Demirci U. Int J Nanomed. 2012;7:5019–5028. doi: 10.2147/IJN.S32579. [DOI] [PMC free article] [PubMed] [Google Scholar]
- 14.Liu CC, Mauk M, Gross R, Bushman FD, Edelstein PH, Collman RG, Bau HH. Anal Chem. 2013;85:10463–10470. doi: 10.1021/ac402459h. [DOI] [PMC free article] [PubMed] [Google Scholar]
- 15.Sia SK, Whitesides GM. Electrophoresis. 2003;24:3563–3576. doi: 10.1002/elps.200305584. [DOI] [PubMed] [Google Scholar]
- 16.de la Escosura-Muniz A, Merkoci A. Small. 2011;7:675–682. doi: 10.1002/smll.201002349. [DOI] [PubMed] [Google Scholar]
- 17.Wang SQ, Esfahani M, Gurkan UA, Inci F, Kuritzkes DR, Demirci U. Lab Chip. 2012;12:1508–1515. doi: 10.1039/c2lc20706k. [DOI] [PMC free article] [PubMed] [Google Scholar]
- 18.Letant SE, Hart BR, van Buuren AW, Terminello LJ. Nat Mater. 2003;2:391–396. doi: 10.1038/nmat888. [DOI] [PubMed] [Google Scholar]
- 19.Chen GD, Alberts CJ, Rodriguez W, Toner M. Anal Chem. 2010;82:723–728. doi: 10.1021/ac9024522. [DOI] [PMC free article] [PubMed] [Google Scholar]
- 20.Chen GD, Fachin F, Fernandez-Suarez M, Wardle BL, Toner M. Small. 2011;7:1061–1067. doi: 10.1002/smll.201002076. [DOI] [PMC free article] [PubMed] [Google Scholar]
- 21.Taylor DD, Zacharias W, Gercel-Taylor C. Methods Mol Biol. 2011;728:235–246. doi: 10.1007/978-1-61779-068-3_15. [DOI] [PubMed] [Google Scholar]
- 22.Jani AMM, Losic D, Voelcker NH. Prog Mater Sci. 2013;58:636–704. [Google Scholar]
- 23.Velev OD, Lenhoff AM. Curr Opin Colloid Interface Sci. 2000;5:56–63. [Google Scholar]
- 24.Yanagishita T, Nishio K, Masuda H. Adv Mater. 2005;17:2241–2243. [Google Scholar]
- 25.Chen G, McCandless GT, McCarley RL, Soper SA. Lab Chip. 2007;7:1424–1427. doi: 10.1039/b713324c. [DOI] [PubMed] [Google Scholar]
- 26.Gates B, Yin YD, Xia YN. Chem Mater. 1999;11:2827–2836. [Google Scholar]
- 27.Weldon A, Kumnorkaew P, Wang B, Cheng XH, Gilchrist JF. ACS Appl Mater Interfaces. 2012;4:4532–4540. doi: 10.1021/am300785y. [DOI] [PubMed] [Google Scholar]
- 28.Surawathanawises K, Cheng XH. Electrochim Acta. 2014;117:498–503. doi: 10.1016/j.electacta.2013.11.144. [DOI] [PMC free article] [PubMed] [Google Scholar]
- 29.Gentile M, Adrian T, Scheidler A, Ewald M, Dianzani F, Pauli G, Gelderblom HR. J Virol Methods. 1994;48:43–52. doi: 10.1016/0166-0934(94)90087-6. [DOI] [PubMed] [Google Scholar]
- 30.Brown L, Koerner T, Horton JH, Oleschuk RD. Lab Chip. 2006;6:66–73. doi: 10.1039/b512179e. [DOI] [PubMed] [Google Scholar]
- 31.Miao JJ, Zhang FM, Takieddin M, Mousa S, Linhardt RJ. Langmuir. 2012;28:4396–4403. doi: 10.1021/la3000137. [DOI] [PMC free article] [PubMed] [Google Scholar]
- 32.Chan L, Nesbeth D, MacKey T, Galea-Lauri J, Gaken J, Martin F, Collins M, Mufti G, Farzaneh F, Darling D. J Virol. 2005;79:13190–13194. doi: 10.1128/JVI.79.20.13190-13194.2005. [DOI] [PMC free article] [PubMed] [Google Scholar]
- 33.Hu Y, Cheng XH, Ou-Yang HD. Biomed Opt Express. 2013;4:1646–1653. doi: 10.1364/BOE.4.001646. [DOI] [PMC free article] [PubMed] [Google Scholar]
- 34.Squires TM, Messinger RJ, Manalis SR. Nat Biotechnol. 2008;26:417–426. doi: 10.1038/nbt1388. [DOI] [PubMed] [Google Scholar]
- 35.Jungbauer A. J Chromatogr A. 2005;1065:3–12. doi: 10.1016/j.chroma.2004.08.162. [DOI] [PubMed] [Google Scholar]
- 36.Fachin F, Chen GD, Toner M, Wardle BL. J Microelectromech Syst. 2011;20:1428–1438. [Google Scholar]
- 37.Hui CY, Jagota A, Lin YY, Kramer EJ. Langmuir. 2002;18:1394–1407. [Google Scholar]
- 38.Masuda H, Fukuda K. Science. 1995;268:1466–1468. doi: 10.1126/science.268.5216.1466. [DOI] [PubMed] [Google Scholar]
- 39.Goh C, Coakley KM, McGehee MD. Nano Lett. 2005;5:1545–1549. doi: 10.1021/nl050704c. [DOI] [PubMed] [Google Scholar]
- 40.Burnouf T, Radosevich M. Haemophilia. 2003;9:24–37. doi: 10.1046/j.1365-2516.2003.00701.x. [DOI] [PubMed] [Google Scholar]
- 41.Eroshkin AM, LeBlanc A, Weekes D, Post K, Li ZW, Rajput A, Butera ST, Burton DR, Godzik A. Nucleic Acids Res. 2014;42:D1133–D1139. doi: 10.1093/nar/gkt1083. [DOI] [PMC free article] [PubMed] [Google Scholar]
- 42.Zhou J, Li H, Li S, Zaia J, Rossi JJ. Molecular Therapy. 2008;16:1481–1489. doi: 10.1038/mt.2008.92. [DOI] [PMC free article] [PubMed] [Google Scholar]
- 43.Xu YH, Yang XR, Wang EK. Anal Chim Acta. 2010;683:12–20. doi: 10.1016/j.aca.2010.10.007. [DOI] [PubMed] [Google Scholar]
Associated Data
This section collects any data citations, data availability statements, or supplementary materials included in this article.


