Abstract
Purpose
Accurate quantification of myocardial perfusion is dependent on reliable electrocardiogram (ECG) triggering. Measuring myocardial blood flow in patients with arrhythmias or poor ECGs is currently infeasible with MR. The purpose of this study is to demonstrate the feasibility of a non-ECG-triggered method with clinically useful 3-slice ventricular coverage for measurement of MBF in healthy volunteers.
Methods
A saturation recovery magnetization prepared gradient recalled echo (GRE) acquisition was continuously repeated during first-pass imaging. A slice interleaved radial trajectory was employed to enable image based retrospective triggering. The arterial input function (AIF) was generated using a beat-by-beat T1 estimation method. The proposed technique was validated against a conventional ECG-triggered dual-bolus technique in 10 healthy volunteers. The technique was further demonstrated under adenosine stress in 12 healthy volunteers.
Results
The proposed method produced MBF with no significant difference compared to ECG-triggered technique (mean of 0.76 ± 0.13 to 0.82 ± 0.21). The proposed method yielded mean MPR comparable to published literature.
Conclusion
We have developed a non-ECG-triggered quantitative perfusion imaging method. In this preliminary study, our results demonstrate that our method yields comparable MBF compared to the conventional ECG-triggered method and it is feasible for stress imaging.
Keywords: myocardial perfusion, flow quantification, ungated acquisition, saturation correction, arterial input function
Introduction
Non-invasive assessment of myocardial perfusion is an integral part for the management of patients with suspected or established coronary artery disease (CAD) (1–3). Myocardial perfusion imaging using cardiac MR has significant advantages compared to conventional nuclear methods: improved spatial resolution, lack of ionizing radiation, and is part of a multi-parametric cardiac examination. However, MR perfusion imaging has not been widely adopted in part due to operational complexity. One aspect contributing to the complexity of MR perfusion imaging is the dependence on an accurate and consistent electrocardiogram (ECG) gating (4,5). Unlike ECG-gated SPECT perfusion, MR perfusion cannot be restarted and requires beat-by-beat temporal resolution because MR perfusion is acquired during first pass. Additionally, the MR acquisition itself may corrupt the ECG signal due to fast gradient switching and resulting electromagnetic effects, preventing accurate ECG gating.
Quantification of myocardial blood flow (MBF) further increases the demand for accurate gating. Both inadequate temporal resolution and inconsistent acquisition window due to mistriggering will reduce the accuracy of MBF measurements (6). In addition to the strict demands on ECG triggering, the nonlinearity of the image signal intensity to contrast agent concentration adds on another layer of complexity to quantifying MBF using MR. The nonlinearity, particularly in the arterial input function (AIF), causes significant errors in MBF estimation. Previously proposed methods to measure the true AIF have been mainly focused on either modifying acquisition parameters (dual-sequence method) (7,8) or acquiring additional first-pass scans used specifically to measure the AIF (dual-bolus method) (9,10). The dual sequence method can limit cardiac coverage, particularly in the framework of non-ECG-triggered acquisitions where coverage of a consistent cardiac phase is not guaranteed. The dual bolus method requires an additional scan, increasing procedural complexity. Furthermore, low ejection fraction and differences in heart rate between the dilute bolus and the full bolus acquisition can compromise the accuracy of the acquired AIF.
To address these two issues, a non-ECG-triggered perfusion imaging method with integrated AIF measurement method was previously developed for accurate quantification of MBF (11). The method capitalizes on the unique properties of golden-angle radial sampling to acquire data over the course of first-pass of imaging without triggering. Images were then retrospectively binned into different cardiac phases without relying on an external signal. The AIF was measured directly from image data by dividing the projections comprising each image into subsets. These highly undersampled subsets were reconstructed into a low resolution image, facilitating the estimation of T1 of the ventricular blood pool. However, the method presented had been limited to only single slice coverage and validated only at rest.
The objective of this work is to expand upon framework built in the previously proposed method. A non-ECG-triggered perfusion imaging method for quantitative perfusion imaging with clinically usable ventricular coverage was developed. Additional acceleration was achieved using highly constrained projection reconstruction (HYPR) (12,13). The method was first validated against a reference dual-bolus method and then tested on a population of healthy volunteers using a typical adenosine stress-rest protocol.
Methods
Acquisition and Reconstruction
In a conventional ECG-triggered perfusion sequence, a single slice is acquired following each saturation recovery magnetization preparation (SR-preparation). Slices are acquired sequentially following a triggering signal (typically the R-wave) as shown in Figure 1a. Consistent triggering is dependent on a clean ECG signal and reasonably regular heart rate. In the proposed non-triggered acquisition scheme (Figure 1b), data was continuously acquired in a golden-angle radial trajectory without an external triggering signal. Similar to the acquisition scheme proposed by Kellman et al (14) and Sharif et al (15), projections from all 3 slices are interleaved following each SR-preparation (Figure 1b). A total of 78 projections (3 slices, 26 projections per slice) were acquired immediately following each SR preparation. The acquisition window was limited to 156 ms to minimize blurring caused by cardiac motion while allowing for sufficient longitudinal relaxation for beat-by-beat T1-derived AIF measurement. Each block (SR-preparation followed by the readout) lasted 176 ms).
Figure 1.
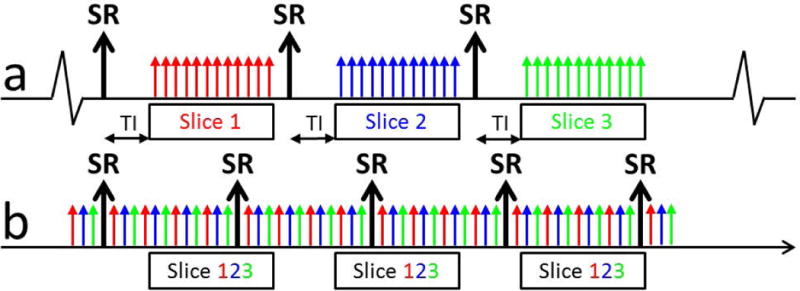
Schematic of the proposed non-ECG-triggered acquisition scheme. (a) A conventional triggered sequence. A single slice is acquired following each SR-preparation. Data collection starts following a short delay time (TI). Additional slices are acquired sequentially in consecutive cardiac phases. (b) In the non-ECG-triggered sequence, projections for all 3 slices are interleaved following each SR-preparation (total of 78 projections over 156 ms). There is no delay between the start of acquisition and the SR-preparation to enable fast T1 mapping. Data is acquired continuously for 38 seconds. The sliding-window reconstruction window includes 26 projections, matching the acquisition window, ensuring equivalent T1 weighting regardless of the location of the reconstruction window.
In lieu of an external triggering signal to gate projections into a consistent cardiac phase, an image based self-gating signal was created using the collected data. A series of low resolution images were reconstructed from the basal slice using a sliding window, throughout the length of the acquisition. Images were produced from a reconstruction window of 26 projections, matching the time between SR-preparations. As a result, each image has the same T1 weighting regardless of the location of the reconstruction window with respect to the SR preparation or location in the cardiac cycle. However, slice by slice imaging can be inefficient as a short TI time needs to be played out to achieve acceptable contrast in the myocardium. In addition, within the framework of beat-by-beat T1 measurement, the recovery of the longitudinal magnetization must be acquired over a certain amount of time to ensure adequate sampling of the longitudinal recovery curve to accurately fit for T1. A limitation of the technique is the short acquisition windows achievable using accelerated imaging may not be adequately long for longer T1 values, reducing the accuracy of the AIF measurement.
The projections were apodized with a Gaussian filter, resulting in an effective in-plane resolution of 4×4 mm2. A sliding window with length of 26 projections was shifted by 6 ½ projections to generate an image series with single images reconstructed with over a reconstruction window of 156 ms and temporal resolution of 44 ms (~22 fps) (16). The self-gating signal was then generated by measuring the mean signal intensity in a region of interest (ROI) drawn around the heart (4,11,17). High mean signal intensity corresponds to the large ventricular blood pool of diastole. Low mean signal corresponds to the smaller ventricular blood pool of systole. Peak detection was used to bin projections into different cardiac phases. Figure 2 illustrates the gating process with representative low resolution gating images. All slices were gated from data collected from the same basal slice.
Figure 2.
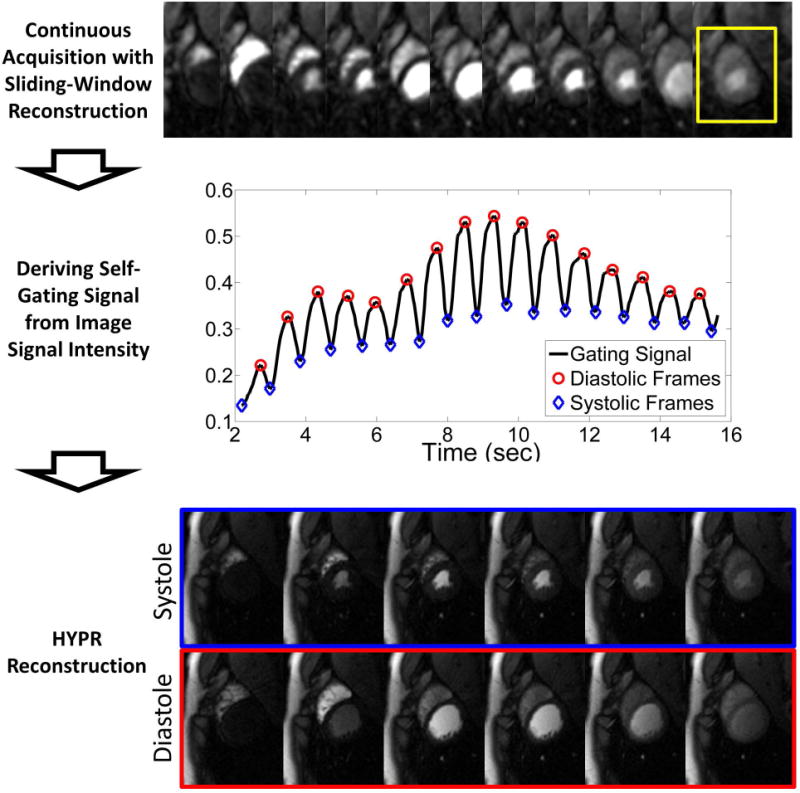
Schematic of the retrospective gating process. A series of images are reconstructed using a sliding window for a temporal resolution of 44 ms. The mean signal intensity in an ROI (yellow box) around the heart is measured. A peak detection algorithm is used to find systolic and diastolic frames. The projections are then sorted into cardiac phases and reconstructed using HYPR to yield the final images.
Following binning, the high-resolution perfusion image series was created using a combination of non-Cartesian sensitivity encoding (SENSE) and highly constrained projection reconstruction (HYPR) reconstruction (18). A high level of acceleration is required due to the limited acquisition window (156 ms) used to acquire all 3 slices. HYPR has been previously shown to achieve high levels of acceleration (19) while maintaining temporal fidelity important for accurate quantification of MBF. HYPR is an iterative method which uses a high resolution, high SNR, artifact-free composite image created using projections acquired across multiple cardiac cycles to constrain the reconstruction of a limited number of projections acquired during a more limited acquisition window. The composite image was created from projections taken from the same cardiac phase in 3 sequential cardiac cycles for a total of 78 projections. The final, single cardiac cycle image is reconstructed at a 2×2 mm2 in-plane resolution using 26 projections. Both systolic phase and diastolic phase images were reconstructed.
To address the nonlinearity of signal intensity to contrast agent concentration, an integrated AIF measurement by means of beat-by-beat T1 estimation was used to directly measure contrast agent concentration in the blood. The longitudinal relaxation following a typical SR-preparation is measured using low resolution radial images. Blood properties such as T1, proton density, and flip angle can be found by fitting the measured change in signal intensities to the analytical model governing longitudinal relaxation following an SR-preparation (20,21) using a nonlinear solver in MATLAB (Mathworks, Natick, MA). Only diastolic images were used to minimize the effect of inflow of blood.
The T1 values were then converted to contrast agent concentration using the known relaxivity of gadolinium-based contrast agent. This “T1-derived” AIF in units of mmol/ml was then scaled to units of image signal intensity, matching the units of the myocardial tissue curve. The scaling factor was found by normalizing the last 4 points of the “T1-derived” AIF with the last points of the AIF measured directly from the image. Three diastolic images were used for beat-by-beat T1 mapping. The T1 estimation images were generated using 13 projections reconstructed using non-Cartesian SENSE. The data were heavily apodized using a Gaussian filter to minimize streaking, resulting in an in-plane resolution of 6×6 mm2. A sliding window of 6 projections was used to produce a temporal resolution of 36 ms (TI of 40, 76, 112 ms).
Phantom Studies
Phantom studies were performed to test the validity of this method. The proposed method was used to estimate the T1 values of 50 ml centrifuge tubes doped with known Optimark (gadoverstamide injection, Mallinckrodt Inc, Montana, USA) concentration. The range of T1 in the tubes was from 40 ms to 1000 ms to simulate expected T1 range in the blood during first-pass. The phantom was placed in a water bath to minimize the difference in magnetic susceptibility between the tubes and the immediate surroundings. Gd concentrations were compared to a reference multiple TI 2D Cartesian inversion recovery magnetization prepared gradient recalled echo (GRE) scan with 10 different TI times (TI = 25, 50, 100, 200, 300, 500, 750, 1000, 1500, 2000 ms). Imaging parameters for the reference scan were 2.0×2.0×8 mm3 and TR/ES/TE = 5000/2.0/1.1 ms. Acquisitions was repeated 10 times to increase SNR.
Human Imaging Protocol
Ten healthy volunteers with an average age of 32.8±12.7 years underwent rest perfusion MRI studies on a whole-body 3T scanner (MAGNETOM Verio, Siemens Healthcare, Erlangen, Germany) with IRB approval and informed written consent. Studies employed a 32-channel spine and body phased array coil. Following localization, two first-pass perfusion scans were performed at rest. Both scans were performed under breath-hold to minimize respiratory motion. Scans were given with a 0.05 mmol/kg bolus of contrast agent chased by 20 ml saline injected at 4 ml/s. The first scan was performed using a conventional ECG-triggered SR-prepared Cartesian sequence with a GRE readout. The acquisition window was placed such that the first slice was acquired during early- to mid-systole. AIF was measured using the dual-bolus method. A dilute-dose (0.005 mmol/kg) was injected and imaged prior to the full-dose scan. The subject was asked to breathe shallowly and 25 frames were acquired. The full dose (0.05 mmol/kg) scan was started immediately following the end of the dilute dose. The second scan using the proposed non-ECG-triggered method was acquired ten minutes following the first scan to allow for residual contrast agent to washout.
In addition to the rest-only studies, stress-rest studies were also conducted to evaluate the proposed method at elevated heart-rates. Twelve healthy volunteers with an average age of 40.4±12.4 years underwent adenosine stress-rest perfusion MRI studies using the proposed sequence. Three slices were acquired with 8 mm gap between slices. Stress scans were performed first in all subjects. 90 seconds following start of adenosine injection (140 μg/kg/min), subjects were given a 0.05 mmol/kg bolus of contrast agent and scanned. The rest scan was performed 10 minutes following the end of the stress scan to allow for residual contrast agent to wash out. All scans were performed during breath hold.
Imaging parameters for the proposed method are as follows: FOV = 260 mm2; bandwidth = 1502 Hz/pixel; flip angle = 15°; TR/TE = 2.0/1.1 ms; spatial resolution = 2.0×2.0×8mm3; 128 readout × 26 projections; 3 slice coverage, data acquisition acquired immediately following SR-preparation. The projections were collected using a golden angle trajectory. 210 repetitions were collected over 36 seconds. The imaging parameters for the reference ECG-triggered are as follows: Cartesian trajectory, FOV = 300×200mm2; bandwidth = 1628 Hz/pixel; flip angle = 15°, TR/TE=2.0/1.1 ms; spatial resolution = 2.0×3.0×8 mm3; 160 readout by 80 phase encodes; TGRAPPA rate = 2.
Analysis
Segmentation was performed using custom software written in MATLAB. A ROI was placed in the ventricular blood pool and the myocardium for the AIF and the myocardial signal. The ROI in the ventricular blood pool was drawn to avoid papillary muscle while maximizing the size of the ROI to ensure high SNR of the AIF. The ROI in the myocardium was divided into American Heart Association recommended segments (22). The contours of the myocardial were manually corrected for any respiratory motion. For rest only studies, all contours were taken from systolic phase reconstructed images. For stress-rest studies, contours were drawn for systolic and diastolic phase reconstructed images. Image signal intensity over time curves of the left ventricular cavity and the myocardial sectors were generated. Basal slices with aortic outflow partial volume artifacts were discarded (4 volunteers in the rest only group, 2 volunteers in the stress-rest group).
For the ECG-triggered dual-bolus studies, the AIF of the dilute-bolus scan was used to measure the MBF. The “dilute” AIF was multiplied by the dilution factor (10-fold) to match the signal intensity level of the myocardial tissue curves. For the non-ECG-triggered studies, the “T1-derived” AIF was scaled to units of image signal intensity to match that of the myocardial tissue curve. The baseline of both curves were first normalized to 0. The scaling factor was then found by normalizing the last 4 points of the “T1-derived” AIF with the last 4 points of the AIF measured directly from the image.
All signal curves were truncated to include only first-pass of contrast agent to minimize effects of incomplete breath holds. MBFs were found using a linear time invariant model with a model independent deconvolution (23). Average MBF was measured in each segment. For the rest studies, the MBF measured during systole using the dual-bolus method and the proposed method was compared using Bland-Altman plots and paired-Student’s t-test. The statistical significance was set at p = 0.05. Mean MBF was also compared between slices. For the stress-rest studies, myocardial perfusion reserve (MPR) was also measured by dividing stress MBF with rest in each segment.
Results
Figure 3 shows the results from the phantom studies. The proposed method gave similar contrast agent concentration values as the reference multiple TI inversion recovery method; T1test = 1.08 T1ref – 11.66, r2 = 1.00. T1test refers to the proposed integrated T1 mapping method. T1ref refers to the reference method.
Figure 3.
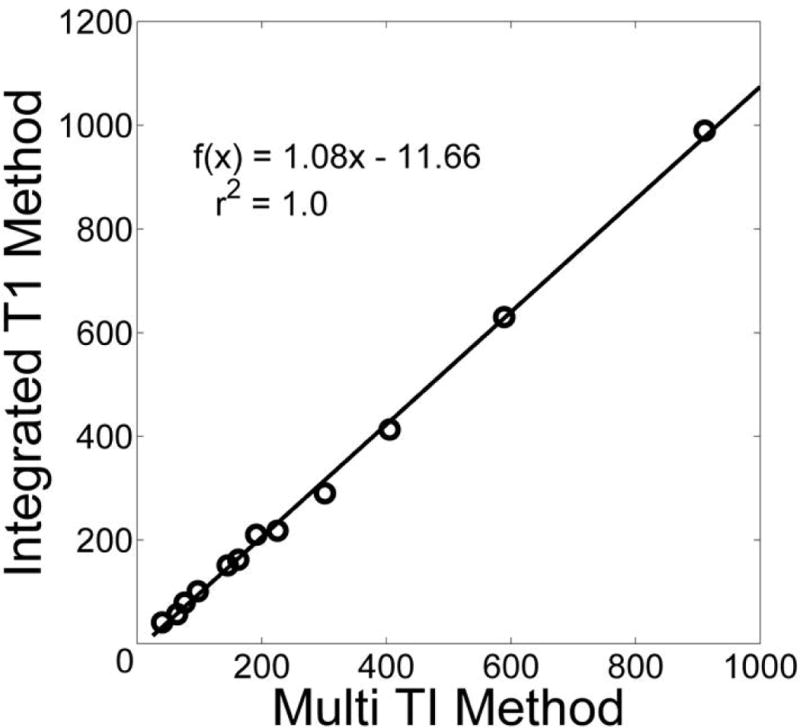
Comparison of proposed integrated T1 measurement method with reference multiple TI GRE method in a phantom. There is a high correlation with the reference method.
Figure 4 shows representative images comparing ECG-triggered and non-ECG-triggered images during peak ventricular enhancement and peak myocardial enhancement phase of first-pass. The image quality of the two scans are similar across all 3 slices. The acquisition window for each slice is 120 ms and 152 ms for the ECG-triggered and non-ECG-triggered scans respectively. The total acquisition window during each cardiac cycle is 550 ms and 176 ms respectively. All slices of the non-ECG-triggered images are in the systolic phase whereas the apical slice of the ECG-triggered scan falls during mid-diastole. There is slightly lower image signal intensity for the ECG-triggered scan due to it being the first injection, thus not being preloaded with residual contrast agent. ECG-triggered images also regularly exhibited dark rim artifacts (7 out of 10 scans) through several frames due to the limited resolution of the Cartesian trajectory. The corresponding first-pass image series for Figure 4 is included in the supplemental materials available in the online version of this article.
Figure 4.
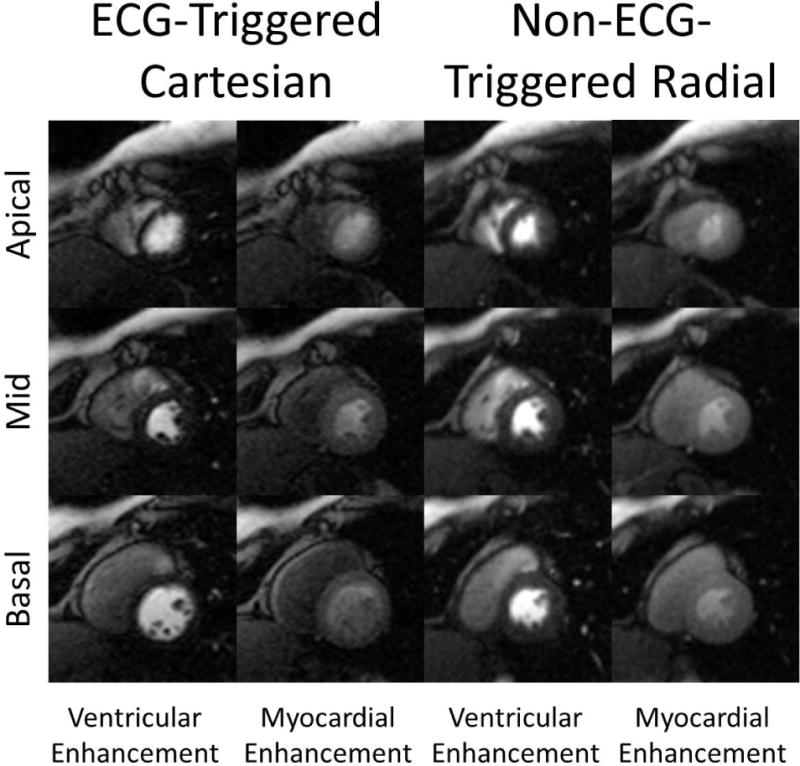
Comparison of example ECG-triggered Cartesian and the non-ECG-triggered radial images in a rest perfusion study. Each radial image was reconstructed from 26 projections. Because ECG-triggered Cartesian images are acquired sequentially, they fall during different cardiac phases (mid-systole in the apical compared to early-diastole of the basal slice). In comparison, all slices of the non-ECG-triggered scan fall during systole.
Table 1 shows comparison of MBF between the triggered and non-triggered methods. The mean MBF of all segments found using the reference triggered dual-bolus method and the proposed method were 0.82 ± 0.21 ml/min/g and 0.76 ± 0.13 ml/min/g respectively. The two scans are not significantly different (p = 0.450). MBF for the apical slice is higher compared to the basal and mid slices. The mean MBF of the apical slice was also significantly different between the two methods (p=0.043).
Table 1.
Comparison of mean MBF between different slices of ECG-triggered and non ECG-triggered perfusion scans. Mean MBF were not significantly different between the two methods except for the apical slice.
| (n=10) | ECG-Triggered (ml/min/g) | Non-ECG-Triggered (ml/min/g) | p-value |
|---|---|---|---|
| Mean | 0.82 ± 0.21 | 0.76 ± 0.13 | 0.4523 |
| Basal | 0.77 ± 0.30 | 0.82 ± 0.21 | 0.6710 |
| Mid | 0.81 ± 0.19 | 0.74 ± 0.25 | 0.4899 |
| Apical | 0.93 ± 0.21 | 0.72 ± 0.22 | 0.0425 |
Figure 5 shows representative images used to estimate the T1 of the ventricular blood pool during peak ventricular enhancement of first-pass. The windowing is the same for each image. As expected, as the time to the center projection increases, signal intensity rises as longitudinal magnetization recovers towards steady state. In contrast to the high resolution images used for visual analysis and myocardial tissue curves, the reconstruction window for the T1 images (for AIF estimation) are placed during diastole to maximize blood pool area. The raw data was apodized to minimize streaking artifacts that may compromise the signal intensity in the blood pool. An example fit shows the excellent fit of the mean signal intensity in the ROI drawn in the ventricular blood pool to the Bloch equation model of longitudinal relaxation.
Figure 5.
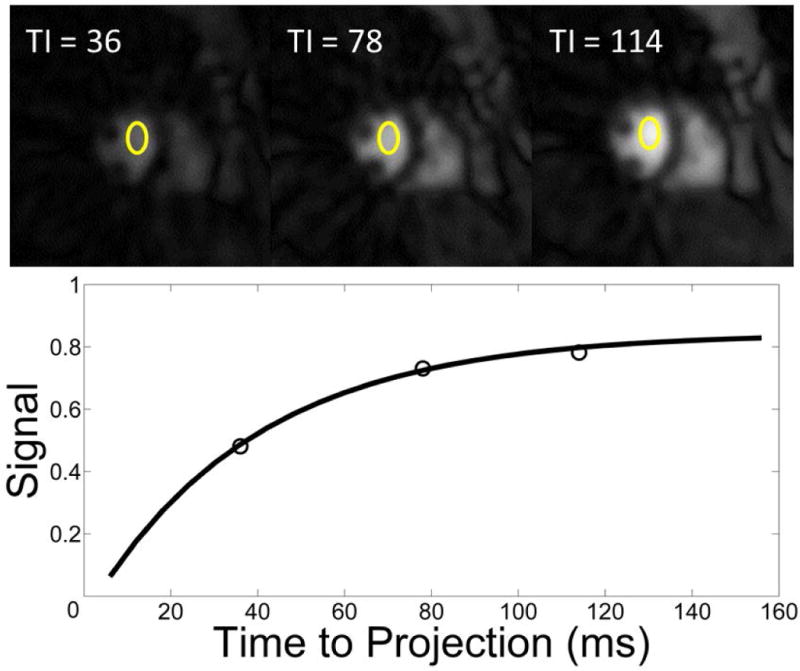
Example of the T1 estimation method used to measure the true AIF. Stated times refer to the time from the first projection to the middle projection of the image. (top) Example low resolution Images (6×6 mm2) used for T1 estimation. All images are on the same scale. Signal intensity is measured in the ROI drawn in the ventricular blood pool. A total of 13 projections are used to produce each image. (bottom) The nonlinear fit for the T1 recovery curve (Signal intensity of the ventricular blood pool vs TI).
Figure 6a shows the correlation between the MBF in AHA segments found using the conventional dual-bolus and proposed integrated T1 mapping methods. The correlation coefficient was found to be 0.86 with a linear correlation of MBFintegrated = 1.00 MBFdual-bolus – 0.07. Figure 6b shows a Bland-Altman of the measurements. There is no statistically significant bias between the two methods.
Figure 6.
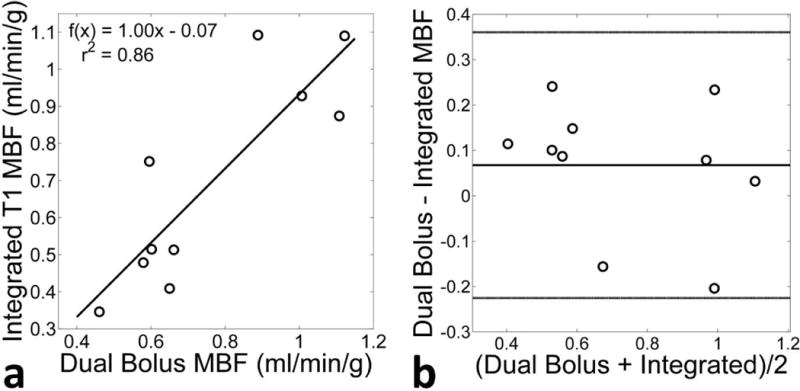
Comparison of the mean rest MBF of the 10 volunteers found using the proposed non-ECG-triggered method with integrated T1 estimation and the conventional triggered technique with dual-bolus AIF measurement. (a) Correlation between the two techniques show a high correlation (r2 = 0.86). (b) A Bland-Altman plot comparing the two methods. There is no discernible trend between the two techniques.
Figure 7 shows representative images of all 3 slices during the same systolic and diastolic time frame during peak ventricular enhancement and peak myocardial enhancement frames of a stress scan using the proposed non-ECG-triggered sequence. The acquisition window for each slice is 156 ms. The mean change in total myocardial area of all 3 slices between the stress and rest scans is 7 ± 11%. Despite the higher heart rates seen during stress, image quality is comparable with minimal to no additional blurring. The corresponding movies of the reconstructed retrospectively gated first-pass image series is provided in Supplemental Material available in the online version of this article.
Figure 7.
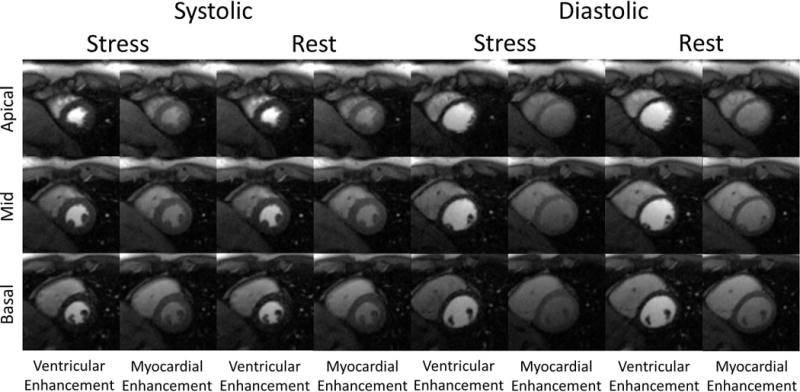
Example non-ECG-triggered stress-rest perfusion images from a healthy volunteer study. Each image was reconstructed from 26 projections. Stress images were acquired first. Images were reconstructed during both systole and diastole. Images of peak ventricular enhancement and peak myocardial enhancement are shown.
The average heart rate was 92±16 bpm during stress and 67±9 bpm during rest. MBF and MPR values for systole and diastole are reported in Table 2. Diastolic MBF and MPR values were slightly higher, but not significantly so (p<0.085). The MPR found in this work was comparable to values for healthy volunteers in published literature (24). The mean diastolic and systolic MPR was close to being significantly different (p=0.053).
Table 2.
Mean and standard deviation for MBF values measured during stress-rest studies. MBF measured during diastole were slightly higher than systole.
| Systole | Diastole | |||||
|---|---|---|---|---|---|---|
| (n=12) | Rest (ml/min/g) | Stress (ml/min/g) | MPR (ml/min/g) | Rest (ml/min/g) | Stress (ml/min/g) | MPR (ml/min/g) |
| Mean | 0.86±0.38 | 3.91±0.61 | 4.31±0.43 | 0.94±0.49 | 4.41±0.78 | 4.79±0.69 |
| Basal | 0.92±0.41 | 3.75±0.82 | 4.01±0.63 | 0.99±0.56 | 4.37±0.88 | 4.32±0.91 |
| Mid | 0.86±0.45 | 4.06±0.52 | 4.58±0.39 | 0.91±0.59 | 4.53±0.76 | 4.83±0.82 |
| Apical | 0.79±0.37 | 3.78±0.41 | 4.69±0.71 | 0.90±0.61 | 4.29±0.92 | 5.09±0.77 |
Discussion
Visual interpretation of perfusion imaging is dependent on regional heterogeneity of MBF. However, triple-vessel disease and microvascular dysfunction may present with a relatively reduced heterogeneity, undervaluing the severity of disease (25,26). Absolute quantification of MBF can be used to rectify this limitation (27). However, the conventional 2D ECG-triggered present with several limitations which may reduce the confidence in estimated MBF. Reliance on a clean and consistent ECG signal, difficulty in acquiring the true AIF, and inconsistent cardiac phase between scans/slices all contribute to poor estimation of MBF. In previous work, these limitations were addressed using a non-ECG-triggered method with integrated T1 measurement in a single slice (11). This work expands upon the framework, utilizing temporal accelerated iterative reconstruction to expand cardiac coverage to a clinically useful 3 slice ventricular coverage.
A major disadvantage of conventional prospectively triggered perfusion imaging is its sensitivity to arrhythmias and changing heart rates. Estimation of MBF is dependent on accurately measuring the passage of a tracer tissue with high enough temporal resolution. Loss of temporal resolution due to misprescribed acquisition window or drastic change of heart rate can greatly reducing the accuracy of MBF estimates (6). In addition, image artifact can impact the fidelity of the measured myocardial tissue curve. This is particularly a concern in temporally accelerated the mis-triggering can introduce artifact in the reconstructed images. HYPR reconstruction requires that data is shared between cardiac cycles in the composite image, resulting in motion blurring corrupting multiple adjacent frames. As a result, there are increasingly strict requirements on consistent cardiac gating and sinus rhythm. Non-ECG-triggered imaging has been shown to be capable of retrospectively identify a consistent cardiac phase in the absence of ECG.
Another problem of quantifying MBF in slices which fall during different cardiac phases is MBF changes between cardiac phases (28,29). It is theorized that the mechanical pumping action of systole compresses intramyocardial vessels, thus reducing measured MBF. As such, it becomes difficult to differentiate interslice and interphase differences in MBF, with the former being a possible indicator of diffuse coronary atherosclerosis (30). As shown in Table 1, ECG-triggered imaging showed significantly higher heterogeneity between slices compared to the proposed method. The apical slice which was regularly acquired during early-diastole had slightly increased MBF (though not statistically significantly different) compared to basal- and mid- ventricular slices, which were acquired during systole. MBF difference due to cardiac phase is also shown in Table 2, where stress MBF and MPR was significantly higher during diastole than systole. As such, future studies using 2D ECG-triggered techniques should report cardiac phase of each slice rather than mean MBF.
The integrated AIF measurement presented in this work has clear workflow advantages compared to conventional dual-bolus method for quantifying MBF. The time required to prepare and load the dilute bolus requires on average an additional 6.9 ± 1.5 min at a highly experienced site (31). The accuracy of the dilute AIF is also dependent on consistent physiological conditions between the dilute and full concentration bolus; a requirement which may be hard to achieve during pharmacologic stress. An alternative method for measuring AIF is the dual-sequence method, which uses a low resolution, short TI images to measure the true AIF in parallel with high resolution, long TI image. Although the dual-sequence method does not require additional preparation or scan time, the low-resolution image lengthens the acquisition window. This is particularly unwanted in the framework of continuous acquisition as the lengthened acquisition window can possibly impact the ability to resolve the same cardiac phase during each cardiac cycle.
Beat-by-beat T1 measurement of the ventricular blood pool is dependent on accurately fitting the measured longitudinal relaxation curve to the Bloch equation. Only 3 points were used for this fit, due to constraints on the acquisition window. Although the number of points used is fewer compared to the previously published non-ECG-triggered method for quantitative perfusion imaging (11,20,21), both phantom experiments and previous works by Kim et al (32) have shown 3 points to be sufficient to yield accurate T1 values over the range of T1s seen in first-pass. To match the number of points, the acquisition window needs to be lengthened. However, increasing the length of the acquisition window to allow longitudinal magnetization to relax to steady-state introduces blurring caused by cardiac motion and possibly cause loss of temporal resolution of the gating signal. Furthermore, increasing the number of samples in this way may not significantly improve the condition of the fit, as it is the first two points following the SR-preparation which are most sensitive to changes in T1. This has been shown in a work by Kim and DiBella et al, which concluded that data from 3 or 4 subsets did not significantly change the estimated T1 values (32).
One limitation of this method is that magnetization is not nulled between slices. As such, slices must be carefully selected such that there is no overlap. Overlap between slices will cause inconsistent contrast in the area of the overlap due to alpha pulses disturbing the longitudinal relaxation of the overlapped area. This overlap region would have the appearance of as if a saturation band had been placed across the slice. Contiguous slices may also suffer from cross talk due to the imperfect slice profile of the alpha pulses. However, the side-lobes of the alpha pulses are fairly narrow (~2mm). In this work, slices were distanced 8 mm apart, minimizing the effect of the cross-talk. This may limit the application in patients with smaller hearts (i.e. pediatriac imaging).
Study limitations
One constraint of this technique is the limited cardiac coverage. Although further cardiac coverage can be achieved by additional undersampling acceleration, the T1 recovery curve needs to be sufficiently sampled to accurately measure the AIF. Increasing the number of slices directly sacrifices the number of points sampled on the T1 recovery curve, potentially introducing errors in the T1 fitting process. It has been hypothesized that as few as 2 points is needed for this method, suggesting that improved cardiac coverage is achievable. In addition, further study in a diseased patient population is needed to prove diagnostic accuracy, though the reported initial results have shown promise. Evaluation of this technique in a population of patients with compromised ejection fraction is also necessary as the difference in signal between systole and diastole is reduced, potentially compromising gating signal fidelity.
Conclusions
Non-ECG-triggered myocardial perfusion imaging with integrated AIF measurement is feasible for quantitative perfusion imaging with clinically required 3 slice ventricular coverage. MBF found using the proposed method is similar to those found using the dual-bolus method. MPR found in the healthy volunteers matches those reported in previous works. The proposed method offers simplified workflow (both with regard to quantification methodology and patient setup time) and potentially increased robustness to sinus arrhythmias.
Supplementary Material
Acknowledgments
This projected was supported in part by NIH grant numbers T32 EB51705, R01 EB002623, K99 HL124323, AHA Scientist Development Grant 14SDG20480123, GCRC grant MO1-RR00425, and Edythe L. Broad Women’s Heart Research Fellowship UN55ES6580F.
References
- 1.Lipinski MJ, McVey CM, Berger JS, Kramer CM, Salerno M. Prognostic value of stress cardiac magnetic resonance imaging in patients with known or suspected coronary artery disease: a systematic review and meta-analysis. J Am Coll Cardiol. 2013;62(9):826–838. doi: 10.1016/j.jacc.2013.03.080. [DOI] [PMC free article] [PubMed] [Google Scholar]
- 2.Cremer P, Hachamovitch R. Assessing the prognostic implications of myocardial perfusion studies: identification of patients at risk vs patients who may benefit from intervention? Current cardiology reports. 2014;16(4):472. doi: 10.1007/s11886-014-0472-9. [DOI] [PubMed] [Google Scholar]
- 3.Schwitter J, Wacker CM, Wilke N, Al-Saadi N, Sauer E, Huettle K, Schonberg SO, Luchner A, Strohm O, Ahlstrom H, Dill T, Hoebel N, Simor T, Investigators M-I MR-IMPACT II: Magnetic Resonance Imaging for Myocardial Perfusion Assessment in Coronary artery disease Trial: perfusion-cardiac magnetic resonance vs. single-photon emission computed tomography for the detection of coronary artery disease: a comparative multicentre, multivendor trial. Eur Heart J. 2013;34(10):775–781. doi: 10.1093/eurheartj/ehs022. [DOI] [PubMed] [Google Scholar]
- 4.Harrison A, Adluru G, Damal K, Shaaban AM, Wilson B, Kim D, McGann C, Marrouche NF, Dibella EV. Rapid ungated myocardial perfusion cardiovascular magnetic resonance: preliminary diagnostic accuracy. J Cardiovasc Magn Reson. 2013;15(1):26. doi: 10.1186/1532-429X-15-26. [DOI] [PMC free article] [PubMed] [Google Scholar]
- 5.Sharif B, Dharmakumar R, Arsanjani R, Thomson L, Bairey Merz CN, Berman DS, Li D. Non-ECG-gated myocardial perfusion MRI using continuous magnetization-driven radial sampling. Magn Reson Med. 2014 doi: 10.1002/mrm.25074. In Press. [DOI] [PMC free article] [PubMed] [Google Scholar]
- 6.Kroll K, Wilke N, Jerosch-Herold M, Wang Y, Zhang Y, Bache RJ, Bassingthwaighte JB. Modeling regional myocardial flows from residue functions of an intravascular indicator. The American journal of physiology. 1996;271(4):H1643–1655. doi: 10.1152/ajpheart.1996.271.4.H1643. [DOI] [PMC free article] [PubMed] [Google Scholar]
- 7.Gatehouse PD, Elkington AG, Ablitt NA, Yang GZ, Pennell DJ, Firmin DN. Accurate assessment of the arterial input function during high-dose myocardial perfusion cardiovascular magnetic resonance. J Magn Reson Imaging. 2004;20(1):39–45. doi: 10.1002/jmri.20054. [DOI] [PubMed] [Google Scholar]
- 8.Kim D, Axel L. Multislice, dual-imaging sequence for increasing the dynamic range of the contrast-enhanced blood signal and CNR of myocardial enhancement at 3T. J Magn Reson Imaging. 2006;23(1):81–86. doi: 10.1002/jmri.20471. [DOI] [PubMed] [Google Scholar]
- 9.Christian TF, Rettmann DW, Aletras AH, Liao SL, Taylor JL, Balaban RS, Arai AE. Absolute myocardial perfusion in canines measured by using dual-bolus first-pass MR imaging. Radiology. 2004;232(3):677–684. doi: 10.1148/radiol.2323030573. [DOI] [PubMed] [Google Scholar]
- 10.Hsu LY, Rhoads KL, Holly JE, Kellman P, Aletras AH, Arai AE. Quantitative myocardial perfusion analysis with a dual-bolus contrast-enhanced first-pass MRI technique in humans. J Magn Reson Imaging. 2006;23(3):315–322. doi: 10.1002/jmri.20502. [DOI] [PubMed] [Google Scholar]
- 11.Chen D, Sharif B, Dharmakumar R, Thomson LE, Bairey Merz CN, Berman DS, Li D. Quantification of myocardial blood flow using non-ECG-triggered MR imaging. Magn Reson Med. 2014 doi: 10.1002/mrm.24913. In Press. [DOI] [PMC free article] [PubMed] [Google Scholar]
- 12.Ge L, Kino A, Griswold M, Mistretta C, Carr JC, Li D. Myocardial perfusion MRI with sliding-window conjugate-gradient HYPR. Magn Reson Med. 2009;62(4):835–839. doi: 10.1002/mrm.22059. [DOI] [PubMed] [Google Scholar]
- 13.Mistretta CA, Wieben O, Velikina J, Block W, Perry J, Wu Y, Johnson K. Highly constrained backprojection for time-resolved MRI. Magn Reson Med. 2006;55(1):30–40. doi: 10.1002/mrm.20772. [DOI] [PMC free article] [PubMed] [Google Scholar]
- 14.Kellman P, Derbyshire JA, Agyeman KO, McVeigh ER, Arai AE. Extended coverage first-pass perfusion imaging using slice-interleaved TSENSE. Magn Reson Med. 2004;51(1):200–204. doi: 10.1002/mrm.10663. [DOI] [PMC free article] [PubMed] [Google Scholar]
- 15.Sharif B, Dharmakumar R, Arsanjani R, Thomson L, Bairey Merz CN, Berman DS, Li D. All-Systolic Non-ECG-gated Myocardial Perfusion MRI: Feasibility of Multi-Slice Continuous First-Pass Imaging. Magn Reson Med. 2015 doi: 10.1002/mrm.25752. In Press. [DOI] [PMC free article] [PubMed] [Google Scholar]
- 16.Sharif B, Dharmakumar R, Labounty T, Arsanjani R, Shufelt C, Thomson L, Bairey Merz CN, Berman DS, Li D. Towards elimination of the dark-rim artifact in first-pass myocardial perfusion MRI: Removing gibbs ringing effects using optimized radial imaging. Magn Reson Med. 2013 doi: 10.1002/mrm.24913. In Press. [DOI] [PMC free article] [PubMed] [Google Scholar]
- 17.Larson AC, White RD, Laub G, McVeigh ER, Li D, Simonetti OP. Self-gated cardiac cine MRI. Magn Reson Med. 2004;51(1):93–102. doi: 10.1002/mrm.10664. [DOI] [PMC free article] [PubMed] [Google Scholar]
- 18.Pruessmann KP, Weiger M, Bornert P, Boesiger P. Advances in sensitivity encoding with arbitrary k-space trajectories. Magn Reson Med. 2001;46(4):638–651. doi: 10.1002/mrm.1241. [DOI] [PubMed] [Google Scholar]
- 19.Ge L, Kino A, Griswold M, Carr JC, Li D. Free-breathing myocardial perfusion MRI using SW-CG-HYPR and motion correction. Magn Reson Med. 2010;64(4):1148–1154. doi: 10.1002/mrm.22489. [DOI] [PubMed] [Google Scholar]
- 20.Kholmovski EG, DiBella EV. Perfusion MRI with radial acquisition for arterial input function assessment. Magn Reson Med. 2007;57(5):821–827. doi: 10.1002/mrm.21210. [DOI] [PubMed] [Google Scholar]
- 21.Chen D, Sharif B, Dharmakumar R, Thomson LEJ, Bairey Merz CN, Berman DS, Li D. Improved quantification of myocardial blood flow using highly constrained back projection reconstruction. Magnetic Resonance in Medicine. 2013 doi: 10.1002/mrm.24958. In Press. [DOI] [PMC free article] [PubMed] [Google Scholar]
- 22.Cerqueira MD, Weissman NJ, Dilsizian V, Jacobs AK, Kaul S, Laskey WK, Pennell DJ, Rumberger JA, Ryan T, Verani MS, Myoca AHAWG Standardized myocardial segmentation and nomenclature for tomographic imaging of the heart: A statement for healthcare professionals from the Cardiac Imaging Committee of the Council on Clinical Cardiology of the American Heart Association. J Am Soc Echocardiog. 2002;15(5):463–467. doi: 10.1067/mnc.2002.123122. [DOI] [PubMed] [Google Scholar]
- 23.Jerosch-Herold M, Swingen C, Seethamraju RT. Myocardial blood flow quantification with MRI by model-independent deconvolution. Med Phys. 2002;29(5):886–897. doi: 10.1118/1.1473135. [DOI] [PubMed] [Google Scholar]
- 24.Pack NA, DiBella EV. Comparison of myocardial perfusion estimates from dynamic contrast-enhanced magnetic resonance imaging with four quantitative analysis methods. Magn Reson Med. 2010;64(1):125–137. doi: 10.1002/mrm.22282. [DOI] [PMC free article] [PubMed] [Google Scholar]
- 25.Christian TF, Miller TD, Bailey KR, Gibbons RJ. Noninvasive identification of severe coronary artery disease using exercise tomographic thallium-201 imaging. Am J Cardiol. 1992;70(1):14–20. doi: 10.1016/0002-9149(92)91382-e. [DOI] [PubMed] [Google Scholar]
- 26.Martin W, Tweddel AC, Hutton I. Balanced triple-vessel disease: enhanced detection by estimated myocardial thallium uptake. Nuclear medicine communications. 1992;13(3):149–153. [PubMed] [Google Scholar]
- 27.Patel AR, Antkowiak PF, Nandalur KR, West AM, Salerno M, Arora V, Christopher J, Epstein FH, Kramer CM. Assessment of advanced coronary artery disease: advantages of quantitative cardiac magnetic resonance perfusion analysis. J Am Coll Cardiol. 2010;56(7):561–569. doi: 10.1016/j.jacc.2010.02.061. [DOI] [PMC free article] [PubMed] [Google Scholar]
- 28.Motwani M, Kidambi A, Sourbron S, Fairbairn TA, Uddin A, Kozerke S, Greenwood JP, Plein S. Quantitative three-dimensional cardiovascular magnetic resonance myocardial perfusion imaging in systole and diastole. J Cardiovasc Magn Reson. 2014;16(1):19. doi: 10.1186/1532-429X-16-19. [DOI] [PMC free article] [PubMed] [Google Scholar]
- 29.Radjenovic A, Biglands JD, Larghat A, Ridgway JP, Ball SG, Greenwood JP, Jerosch-Herold M, Plein S. Estimates of systolic and diastolic myocardial blood flow by dynamic contrast-enhanced MRI. Magn Reson Med. 2010;64(6):1696–1703. doi: 10.1002/mrm.22538. [DOI] [PubMed] [Google Scholar]
- 30.Gould KL, Nakagawa Y, Nakagawa K, Sdringola S, Hess MJ, Haynie M, Parker N, Mullani N, Kirkeeide R. Frequency and clinical implications of fluid dynamically significant diffuse coronary artery disease manifest as graded, longitudinal, base-to-apex myocardial perfusion abnormalities by noninvasive positron emission tomography. Circulation. 2000;101(16):1931–1939. doi: 10.1161/01.cir.101.16.1931. [DOI] [PubMed] [Google Scholar]
- 31.Ishida M, Schuster A, Morton G, Chiribiri A, Hussain S, Paul M, Merkle N, Steen H, Lossnitzer D, Schnackenburg B, Alfakih K, Plein S, Nagel E. Development of a universal dual-bolus injection scheme for the quantitative assessment of myocardial perfusion cardiovascular magnetic resonance. J Cardiovasc Magn Reson. 2011;13:28. doi: 10.1186/1532-429X-13-28. [DOI] [PMC free article] [PubMed] [Google Scholar]
- 32.Kim TH, Pack NA, Chen L, DiBella EV. Quantification of myocardial perfusion using CMR with a radial data acquisition: comparison with a dual-bolus method. J Cardiovasc Magn Reson. 2010;12:45. doi: 10.1186/1532-429X-12-45. [DOI] [PMC free article] [PubMed] [Google Scholar]
Associated Data
This section collects any data citations, data availability statements, or supplementary materials included in this article.


