

Abstract
Carver and White's Behavioral Inhibition System/Behavioral Activation System (BIS/BAS) Scale has been a useful tool for studying individual differences in reward/punishment sensitivity; however, its factor structure and invariance across development have not been well tested. In the current study, we examined the factor structure of the BIS/BAS Scale across five age groups: 6-10-year-old children (N=229), 11-13-year-old early adolescents (N=311), 14-16-year-old late adolescents (N=353), 18-22-year-old young adults (N=844), and 30-45-year-old adults (N=471). Given poor fit of the standard four-factor model (BIS, Reward Responsivity, Drive, Fun Seeking) in the literature, we conducted exploratory factor analyses in half of the participants and identified problematic items across age groups. The four-factor model showed poor fit in our sample whereas removing the BAS Fun Seeking subscale and problematic items from the remaining subscales improved fit in confirmatory factor analyses conducted with the second half of the participants. The revised model showed strict invariance across age groups and by sex, indicating consistent factor structure, item loadings, thresholds, and unique/residual variances. Additionally, in our cross-sectional data, we observed non-linear relations between age and subscale scores, where scores tended to be higher in young adulthood than childhood and later adulthood. Furthermore, sex differences emerged across development; adolescent and adult females had higher BIS scores than males in this age range, whereas sex differences were not observed in childhood. These differences may help us to understand the rise in internalizing psychopathology in adolescence, particularly in females. Future developmental studies are warranted to examine the impact of rewording problematic items.
Keywords: BIS/BAS, confirmatory factor analysis, exploratory factor analysis, invariance, development, childhood, adolescence, sex differences, reward, punishment
Introduction
As the ‘Science of Adolescence’ (Institute of Medicine, 2011) enters its own adolescence, the typical development of reward and punishment processing has received considerable attention in the neuroscience/psychology literature. Many behavioral changes associated with adolescence, such as increases in risk taking and affiliative behavior, have been linked to increases in reward responsivity thought to peak during this period (for reviews, see Galvan, 2010; Richards, Plate, & Ernst, 2013; Spear, 2000, 2011). Importantly, other incentive processing research has linked alterations in reward/punishment responsivity to a variety of psychopathologies, including schizophrenia (Dowd & Barch, 2010), major depressive disorder (Eshel & Roiser, 2010), bipolar disorder (Urosevic, Abramson, Harmon-Jones, & Alloy, 2008), anxiety disorders (Johnson, Turner, & Iwata, 2003), addiction (Jonker, Ostafin, Glashouwer, van Hemel-Ruiter, & de Jong, 2014), eating disorders (Loxton & Dawe, 2001), and attention deficit hyperactivity disorder (Volkow et al., 2009).
Recently, research on typical development and psychopathology has begun to converge as interest grows in the biological mechanisms that underlie pediatric psychopathology and risk for psychopathology. For example, adolescents with or at high risk for developing affective disorders tend to show reduced neural and behavioral responses to reward (Bress, Smith, Foti, Klein, & Hajcak, 2012; Forbes, Shaw, & Dahl, 2007; Foti, Kotov, Klein, & Hajcak, 2011; Gotlib et al., 2010; Olino et al., 2014). The association between reward circuit function and depressive symptoms/risk has been documented as early as the preschool period (Hayden et al., 2010) and is predictive of future symptoms/episodes (Bress, Foti, Kotov, Klein, & Hajcak, 2013; Morgan, Olino, McMakin, Ryan, & Forbes, 2013).
Given these findings and the recent emphasis on dimensional and developmental components of psychopathology from the National Institute of Mental Health (Insel et al., 2010), it is clear that we need effective and reliable tools to assess individual differences in multiple components of reward and punishment processing across development. One potential self-report tool is the Behavioral Inhibition System/Behavioral Activation System (BIS/BAS) Scale developed by Carver and White (1994). The BIS/BAS scale was developed based on Gray's Reinforcement Sensitivity Theory (Gray, 1970, 1987, 1994), which has provided a fruitful framework for investigating individual differences in reward and punishment sensitivity. Gray proposed two broad motivational systems regulating approach and withdrawal behavior: the behavioral activation system (BAS) and behavioral inhibition system (BIS) (Gray, 1981, 1982). The BAS was proposed to be sensitive to reward, non-punishment occurrences, and escaping from punishment; activation of the BAS should move people to approach their goals. People with high BAS sensitivity should be highly motivated by and experience more positive affect in response to positive outcomes and reward cues. On the other hand, the BIS was suggested to be sensitive to punishment, non-reward, and novelty and should inhibit people from pursuing behaviors that lead to negative outcomes. High BIS sensitivity was proposed to relate to negative affect and anxiety.
Carver and White (1994) designed the BIS/BAS items to assess the theoretical concepts of BIS and BAS function and their roles in motivation, behavior, and affect. Specifically, items assessing BAS sensitivity reference pursuit of appetitive goals, reward responsivity, tendencies to seek new, potentially rewarding experiences, and tendencies to act quickly towards goals. In contrast, items assessing BIS sensitivity focus more narrowly on concerns about possible negative/punishing events and sensitivity to the occurrence of such events. After pruning potential questions, a factor analysis with oblique rotation was used to assess the structure of the remaining items (N=732 college students, 51% female). This yielded the four-factor structure that has since become standard in the literature: a single BIS subscale and three BAS subscales, Reward Responsivity, Drive, and Fun Seeking. Significant positive correlations among the BAS subscales were found, as well as between BIS and BAS Drive, i.e., individuals who tend to be more sensitive to negative outcomes are also more driven to achieve rewarding outcomes. It is important to note, however, that this factor structure was not unequivocally supported (e.g., the Fun Seeking subscale had two cross-loading items). Nonetheless, the four subscales showed 8-week test-retest reliability correlations ranging from 0.59-0.69.
Since the BIS/BAS was developed, over 2,000 studies have cited the Carver and White (1994) paper. Many groups have tested the fit of the four-factor or other models or have aimed to validate the BIS/BAS for use in special populations. Table 1 presents a summary of results from a selection of representative studies that used confirmatory factor analysis (CFA) to test the four-factor structure of the BIS/BAS scale in adults and from the few studies that have examined fit in children/adolescents (see Supplemental Table 1 for representative studies using principal components analysis [PCA]). In reviewing this literature, it becomes clear that CFA studies indicate that, while the Carver and White model typically fits better than a two-factor model (BIS and BAS), the four-factor model does not fit particularly well based on validated fit index cutoffs (Hu & Bentler, 1999). Generally in these studies, while one fit index may meet criteria for “acceptable” fit, other indices would not pass even lenient rule-of-thumb fit criteria. While there are some exceptions that do show good fit of a four-factor model, these studies generally only achieve good fit for revised models that drop certain items (most frequently the two reverse-coded BIS items), include residual error correlations, or use item parcels.
Table 1. Summary of Representative CFA Studies.
| Cronbach's Alpha | Four Factor Model CFA Fit | |||||||||
|---|---|---|---|---|---|---|---|---|---|---|
|
|
|
|||||||||
| Study | Sample | N | BIS | DRIVE | RWD | FUN | χ2 | CFI | RMSEA | Notes |
| Heubeck et al., 1998 | College Students | 336 | 0.74 | 0.83 | 0.68 | 0.68 | 764* | 0.80 | 0.80 | Four-factor model fits better than two-factor model |
|
| ||||||||||
| Leone et al., 2001 | College Students | 216 | 0.74 | 0.87 | 0.80 | 0.88 | 31* | 0.98 | 0.05 | df=21; Used item parcels; U.S. sample shown |
|
| ||||||||||
| Campbell-Sills et al., 2004 | Mood/Anxiety Disorder Outpatients | 925 | 0.73 | 0.80 | 0.75 | 0.80 | 407* | 0.94 | 0.05 | df=113; Removed BIS5, BIS7, RWD2 |
|
| ||||||||||
| Franken et al., 2005 | Dutch College Students | 246 | 0.79 | 0.68 | 0.62 | 0.59 | 336* | 0.83 | 0.07 | Suggest issues with DRIVE4 and FUN4 |
|
| ||||||||||
| Cogswell et al., 2006 | College Students | 562 | 0.73 | 0.70 | 0.71 | 0.67 | 654* | 0.81 | 0.07 | df=167; Suggest removing BIS5, BIS7, DRIVE4, FUN1 |
|
| ||||||||||
| Cooper et al., 2007 | Adults (21-40 years) | 631 | 0.77 | 0.85 | 0.89 | 0.80 | 610* | 0.96 | 0.07 | Four-factor model fits better than two-factor model; Age invariance |
| Adolescents (12-16 years) | 330 | 0.68 | 0.82 | 0.82 | 0.69 | 436* | 0.93 | 0.08 | ||
|
| ||||||||||
| Poythress et al., 2008 | Adult Offenders | 1515 | 0.74 | 0.76 | 0.73 | 0.66 | 709* | 0.89 | 0.07 | Suggest separate BIS5/BIS7 factor |
|
| ||||||||||
| Beck et al., 2009 | Adult Females with Disordered Eating | 103 | 0.86; 0.63^ | 0.76 | 0.67 | 0.51 | 545* | 0.97 | 0.06 | Suggest separate BIS5/BIS7 factor |
|
| ||||||||||
| Yu et al., 2011 | Dutch Early Adolescents (M=13 years) | 497 | 0.73# | 0.53 | 0.63 | 0.53 | 425* | 0.80 | 0.06 | Suggest two-factor model removing BIS5/BIS7 and allowing residual error correlations |
| Dutch Middle Adolescents (M=16 years) | 237 | 0.82# | 0.57 | 0.68 | 0.57 | 412* | 0.78 | 0.08 | ||
| Dutch Mothers (M=45 years) | 734 | 0.75# | 0.63 | 0.65 | 0.57 | 778* | 0.80 | 0.07 | ||
|
| ||||||||||
| Kingsbury et al., 2013 | Children (9-13 years) | 368 | 0.70 | 0.67 | 0.71 | 0.69 | 328* | 0.82 | 0.05 | Four-factor model fits better than two-factor model |
|
| ||||||||||
| Demianczyk et al., 2014 | College Students | 2730 | - | - | - | - | 6327* | 0.81 | 0.12 | Examined ethnicity invariance |
|
| ||||||||||
| Morean et al., 2014 | Adult Smokers | 781 | - | - | - | - | - | 0.82 | 0.07 | Suggest a 13-item shortened version |
| Adult Alcohol Drinkers | 656 | - | - | - | - | - | 0.82 | 0.07 | ||
Statistics from representative previous studies focusing on the fit of the standard Carver and White four-factor model are presented. Any model modifications are noted in the Notes section. Cronbach's alphas ≥ 0.8 are in bold. CFI ≥ .95 and RMSEA ≤ 0.06 are in bold. Model degrees of freedom were 164 unless otherwise stated in the Notes column.
Divided BIS into two subscales, anxiety 0.86 and fear 0.63;
BIS subscale without reverse-scored items, BIS5 and BIS7;
p < 0.05 chi-squared model fit
Furthermore, establishing the structural validity of the BIS/BAS in child/adolescent populations as well as measurement invariance across age are pivotal for relating BIS/BAS to behavior/outcomes within younger age groups and across development. However, few studies to date have explored the factor structure of the BIS/BAS scale in children or adolescents. One of these studies tested a simplified self-report version of the BIS/BAS in 8-12-year-olds (Muris, Meesters, de Kanter, & Timmerman, 2005). While four factors emerged in a PCA, the authors suggested that loadings were more interpretable when forcing a two-factor solution with a single BAS and a BIS factor (Muris et al., 2005). In another study where Dutch adolescents and mothers self-reported on the BIS/BAS, the authors found that a modified two-factor model (removing reverse-scored BIS items and allowing several residual error correlations) fit marginally better than a poorly fitting four-factor model. This revised two-factor model was acceptable based only on some fit indices and showed invariance across adolescents and adults (Yu, Branje, Keusers, & Meeus, 2011). In contrast, Kingsbury, Coplan, Weeks, & Rose-Krasnor, (2013) suggested that the standard four-factor model fit better than did the two-factor model in 8-13-year-old children, although the four-factor model showed poor fit for some fit indices and only acceptable fit for others. Finally, Cooper et al. (2007) compared fit of the four-factor model in adults (21-40-year-olds) to adolescents (12-16-year-olds), finding relatively good fit in both groups as well as metric and covariance invariance across groups.
Given mixed findings regarding model structure/fit and the limited literature on BIS/BAS structure in children/adolescents, additional work is needed to explore model fit, particularly in developmentally informative studies. Further, establishing measurement invariance across age is important for studies investigating typical development of reward/punishment processing or alterations in children/adolescents with or at-risk for developing psychopathology. This is the first study to examine the fit of the Carver and White four-factor model using data from the BIS/BAS scale across childhood, adolescence, and adulthood. Our main goal was to establish a model for the BIS/BAS that fit well and showed invariance across developmental stages. To do this, we split our sample into two independent, random halves and, first, examined the factor structure of the BIS/BAS in each age group. We used this data to identify problematic items that could contribute to poor fit across age groups. Then, we compared the four-factor model to our obtained models and examined invariance across age and sex in the second, independent half of the sample. In addition, we characterized normative relations between age, sex, and subscale scores across development.
Methods
Participants
Participants were drawn from several different study samples collected at Washington University in St. Louis (St. Louis, MO), Stanford University (Stanford, CA), Western University (London, ON, Canada), University of Pittsburgh (Pittsburgh, PA), and Stony Brook University (Stony Brook, NY). These studies all examined reward processing, typical development, or risk for depression/anxiety (based on parental history) in community or college samples; none specifically recruited individuals with active psychopathology, though this was not an exclusion for the current analyses. More information about the specific study populations is provided in the Supplement. Participants were separated into five age groups, three of which characterized developmental epochs from childhood through adolescence (6-10-year-old children; 11-13-year-oldearly adolescents; 14-16-year-oldlate adolescents). A college-aged group (18-22-year-old young adults) was created to examine young adults in a similar age range to the participants examined by Carver and White and many other studies of individual differences. In addition, an adult group (30-45-year-old adults) was created, distinct from the college-aged young adults, to capture a later developmental window after the bulk of structural neurodevelopment has peaked (Lebel & Beaulieu, 2011; Lebel, Walker, Leemans, Phillips, & Beaulieu, 2008). To avoid non-independence among participants from the studies that recruited twin or spouse dyads, one individual from each dyad was selected at random for the subsequent analyses. Of the remaining 2579 individuals, we excluded participants who did not fall within our age groups (5.0%), whose demographic information was missing (4.3%), or who did not provide complete BIS/BAS data (5.0%) leaving a final sample size of N=2208 for the current analysis. We excluded participants with missing BIS/BAS data because our confirmatory factor analysis estimator function (as implemented in R) uses list-wise deletion in the case of missing data. We provide more specifics regarding missing data in the Supplementary Methods. All participants completed Carver and White's BIS/BAS Scale (20 or 24 item versions [four filler questions not used in calculating subscale scores are included on the 24-item version]) or the Muris et al. (2005) version of the BIS/BAS Scale that was slightly modified for use with children (Supplementary Table 2 presents the wording and order of items in the Carver and White and Muris et al. versions). Although all versions used four-point Likert scales for response options, the exact wording of those options varied slightly across questionnaire versions (e.g. 1=strongly agree vs. 1= very true for me; Supplementary Table 2). Participant demographics for each age group are presented in Table 2.
Table 2. Demographic Characteristics by Age Group.
| Characteristic | Adults | Young Adults | Late Adolescents | Early Adolescents | Children | Total |
|---|---|---|---|---|---|---|
| Total N | 471 | 844 | 353 | 311 | 229 | 2208 |
| Sex | ||||||
| Male | 238 | 291 | 153 | 65 | 90 | 837 |
| Female | 233 | 553 | 200 | 246 | 139 | 1371 |
| Ethnicity | ||||||
| White | 469 | 604 | 282 | 241 | 138 | 1734 |
| African American | 0 | 58 | 45 | 16 | 49 | 168 |
| Asian | 1 | 131 | 2 | 8 | 3 | 145 |
| Other | 1 | 51 | 24 | 46 | 39 | 161 |
| Age (years) | ||||||
| Mean | 36.04 | 19.30 | 14.48 | 12.26 | 8.83 | |
| Standard Deviation | 3.90 | 1.01 | 0.59 | 0.85 | 1.12 | |
| Institution | ||||||
| Stanford University | - | - | 63 | 121 | 58 | 242 |
| Stony Brook University | - | - | 27 | 76 | 38 | 141 |
| University of Pittsburgh | - | 599 | 15 | 17 | 5 | 636 |
| Washington University | 5 | 245 | 248 | 97 | 128 | 723 |
| Western University | 466 | - | - | - | - | 466 |
The total sample size (Total N) for each age group is presented here as well as counts for each age group split by sex, ethnicity, and institution where the data was collected. We also present the mean and standard deviation of the age of participants (in years).
Analysis
Data analysis was conducted using R version 3.1.0 (Team, 2012). Multivariate normality across all BIS/BAS items was assessed for each age group (Supplementary Table 3) using the semTools package (Pornprasertmanit, 2013).
Examining Factor Structure Across Development
For the first phase of our analysis, we randomly selected half of the participants in each age group to examine factor structure and reserved the second, independent half of participants to confirm these results. We conducted an exploratory factor analysis (EFA), specifically principal axis factoring with promax rotation, on the first half of participants in each age group (using the psych package). EFA is generally recommended over PCA, especially in the case of skewed data, as is the case here (Supplementary Table 3). Oblique rotations, like the promax rotation, are generally recommended, especially as there is prior evidence suggesting factor inter-correlation (for discussion of current best practices, see Costello & Osborne, 2005, Fabrigar et al., 1999). We used several methods to determine the number of factors to extract for EFA; all resulting models were tested later using CFA. Particularly, we examined the number of factors suggested by two methods suggested in current “best practices” for EFA, Horn's Parallel Analysis (Garrido et al., 2013) and Minimum Average Partials (Garrido et al., 2011) and the rule-of-thumb of retaining all factors with an eigenvalue >1. We ran EFAs extracting factors based on each of these methods utilizing polychoric correlation matrices, given the ordinal nature of the item response data.
Identifying Problematic Items
We examined the consistency of item loadings across age groups in these EFAs to determine whether an item should be retained/removed in the revised model. Specifically, items that showed strong loadings exclusively on a single factor (≥0.4) consistently across at least four of the five age groups were kept in the model. Thus, items that showed weak loadings (<0.4) on all factors, cross-loadings (≥0.4) onto multiple factors, or inconsistent loadings across age, i.e. loading (s) ≥0.4 onto different factors in two or more age groups, were deemed problematic and were trimmed to create a more developmentally comparable model. The EFAs were re-run excluding these potentially problematic items to make sure that the factor structure remained the same after removing ‘problematic’ items. This process was iterated as needed, i.e. if an item showed problematic loadings after re-factoring the trimmed model, the item was removed and the further trimmed model was factored again.
Confirmatory Factor Analyses Across Development
We next examined the fit of the potential models using CFA. All CFAs were conduced within the second, independent half of participants from each age group. Specifically, we ran a separate CFA (using the lavaan package; Rosseel, 2012) testing the a priori Carver and White four-factor model and each of the three trimmed models (as identified from the above EFAs) within the second half of participants from each of the five age groups.
Because the BIS/BAS items are assessed on a four-point Likert scale, all indicators were declared as ordered categorical variables, i.e. ordinal. Diagonally weighted least squares was thus used as the estimator with robust standard errors and mean and variance adjusted (i.e., WLSMV) test statistics. It is important to note that thresholds, rather than intercepts, are estimated when using ordinal indicators. In the current case, each four-point Likert variable has 3 thresholds, where the first threshold represents the expected value on an underlying continuous distribution where an individual would most likely transition from a response of 0 to a response of 1. The second threshold represents the expected value for the transition from a response of 1 to 2, etc. Latent factor variances were fixed to one so that all factor loadings could be estimated. Item loadings, residual variances, and latent factor covariances for the original four-factor model and the trimmed model (based on EFAs extracting factors with eigenvalues >1) are displayed in Supplementary Figure 1. We used the semPlot package to create these CFA diagrams (Epskamp, 2013).
We present chi-squared statistics, comparative fit index (CFI), and root mean squared error of approximation (RMSEA) with its associated 90% confidence interval (CI) and p-value to assess model fit from all confirmatory factor analyses. Simulation studies have suggested improved cutoff criteria for assessing model fit beyond traditional rules-of-thumb for these indices. In particular, cutoffs of CFI ≥ 0.95 and RMSEA ≤ 0.06 (where its upper CI bound should be ≤ 0.08) have been suggested to indicate relatively good fit of the tested model to the observed data (Hu & Bentler, 1999). While non-significant chi-squared tests can indicate good fit, they are sensitive to sample size and violations of normality assumptions and thus often falsely indicate poor model fit (Bollen, 1989; Tucker & Lewis, 1973).
Testing Age and Sex Invariance
Next, we conducted stepwise tests of invariance, first examining potential differences across the five age groups and then comparing males and females. Following the guidelines of Millsap and Yun-Tein (2004) for testing invariance across multiple groups with ordinal data, the loading for one item on each factor was set to 1, one threshold for each item (and a second for the items whose loadings are set at 1) was constrained to be equal across groups, the unique/residual item variances for the first group were fixed at 1, and the factor means for the first group were fixed at 0. The first invariance test was a baseline model testing configural invariance by pooling data across all groups, i.e., testing that a similar factor structure is present and that the observed variables (scale items) indicate the same latent variable traits/concepts across groups. Second, item loadings were fixed to be equal across groups to test weak or metric invariance, i.e., that the associations between observed and latent variables are the same across groups (depending on invariance of thresholds). Third, item loadings and thresholds were fixed to be equal across groups to test strong or scalar invariance, i.e., that the mean structures/response profiles of items are also the same across groups. Fourth, item loadings, thresholds, and unique/residual item variances were fixed to be equal across groups to test strict invariance, i.e., that group differences on the scale items are only due to group differences in the latent factors. The R code used to examine invariance is presented in the Supplementary Methods.
When testing measurement invariance, we present the previously discussed fit statistics for each model as well as change in chi-squared, CFI, and RMSEA from each model to the next, more restrictive model. As above, while a significant test of change in chi-squared can indicate that a model is not invariant across groups, this test is sensitive to sample size and normality violations, even for nested models (Brannick, 1995), and thus other fit statistics may be more appropriate. It has been suggested that, for total sample sizes larger than 300, as in the current study, cutoffs of a decrease in CFI ≤ 0.010 (Cheung & Rensvold, 2002) and an increase in RMSEA ≤ 0.015 would more appropriately indicate invariance (Chen, 2007).
Age and Sex Differences in BIS/BAS Scores
In a final exploratory analysis, we examined age and sex differences in mean scores for the revised subscales. Specifically, we used hierarchical linear regression models to examine whether age, sex, and their interaction predicted subscale score for the whole sample of participants. We examined linear, quadratic, and cubic age functions to determine which best characterized the data. The first step of the regression models included age (z-scores) and sex as predictors; the second step added an age × sex interaction; the third step tested quadratic effects of age (age2) and its interaction with sex; and the fourth step tested cubic effects of age (age3) and its interaction with sex as predictors. Of note, while using age groups was necessary for the multiple-group CFA analyses, these regressions allowed us to examine age as a continuous predictor of BIS/BAS scores.
Results
Sample Characteristics
Table 2 presents demographic information for the five age groups in the current study (adults N=471; young adults N=844; late adolescents N=353; early adolescents N=311; children N=229) including sex, ethnicity, and age distributions as well as the institution at which participants were assessed. Mardia's tests of multivariate normality across all items for each age group (Supplementary Table 3) indicated severe skew and kurtosis (all ps< 0.001), again supporting the use of EFA rather than PCA.
Examining Factor Structure and Identifying Items Contributing to Poor Fit Across Development
All EFAs examining factor structure were conduced within the first random half of participants from each age group: adults (N=236), young adults (N=422), late adolescents (N=176), early adolescents (N=155), and children (N=114). We examined several methods for determining the appropriate number of factors to extract in the EFAs. Horn's parallel analysis indicated that four factors should be extracted for each age group, aligning with prior work suggesting a four-factor model. The minimal average partials approach indicated three factors as sufficient for each age group. Finally, the number of factors with eigenvalues greater than one differed by group: four factors for adults and young adults, five factors for late adolescents and children, and six factors for early adolescents. This final approach also aligned well with Scree tests.
Items that showed weak or inconsistent loadings in two or more age groups were trimmed and each EFA was re-run. Extracting four factors for each age group (based on Horn's parallel analysis) yielded a similar factor structure to the Carver and White four-factor model, however, the FUN subscale items all tended to load or cross-load with the REWARD and DRIVE items, and several items (BIS5, BIS7, REWARD3, DRIVE1) showed weak loadings or cross-loadings in several age groups. These items and the FUN subscale were trimmed and the EFAs were re-run extracting three factors for each group (based on parallel analysis). In the trimmed model, REWARD5 showed strong cross-loadings. Trimming this item, the EFAs yielded a stable structure for each age group with a BIS (BIS1, BIS2, BIS3, BIS4, BIS6), REWARD (RWD1, RWD2, RWD4), and DRIVE (DRIVE2, DRIVE3, DRIVE4) factor (Supplementary Table 4).
Extracting three factors for each age group (minimum average partials) yielded relatively consistent factors for BIS, REWARD, and DRIVE. FUN1, FUN2, and FUN4 showed scattered loadings across the three factors while FUN3 loaded consistently with the REWARD items for each age group. As above, BIS5 and BIS7 showed problematic loadings across several groups. Trimming these items and re-running the EFAs, yielded three consistent factors across age groups for BIS (BIS1, BIS2, BIS3, BIS4, BIS6), REWARD (RWD1, RWD2, RWD3, RWD4, RWD5, FUN3), and DRIVE (DRIVE1, DRIVE2, DRIVE3, DRIVE4) (Supplementary Table 5).
Extracting factors with eigenvalues greater than one also yielded relatively intact factors for BIS, REWARD, and DRIVE. The BIS1, BIS5, and BIS7 items showed weak loadings with the other BIS items and/or loaded on their own separate factor in the younger age groups. The REWARD3 item showed weak loadings or loaded on a separate factor in several age groups. The FUN items loaded consistently on the same factor only for adults and young adults, whereas the FUN2 and FUN3 items showed inconsistent loadings across the younger three age groups. These items (BIS1, BIS5, BIS7, REWARD3, FUN2, FUN3) were trimmed and the model was re-run. This resulted in factors for the BIS, REWARD, and DRIVE items whereas FUN1 and FUN4 showed weak and inconsistent loadings. Trimming these FUN items and re-running the EFA extracting three factors for each age group yielded a consistent factor structure across groups for the BIS (BIS2, BIS3, BIS4, BIS6), REWARD (RWD1, RWD2, RWD4, RWD5), and DRIVE (DRIVE1, DRIVE2, DRIVE3, DRIVE4) factors (Supplementary Table 6; summarized in Table 4).
Table 4. Summary of Exploratory Factor Analyses.
| Item | Problems |
|---|---|
| BIS1 ‘If I think something unpleasant is going to happen I usually get pretty worked up’ | Weak loadings in early and late adolescents |
| BIS2 ‘I worry about making mistakes’ | NONE |
| BIS3 ‘Criticism or scolding hurts me quite a bit’ | NONE |
| BIS4 ‘I feel pretty worried or upset when I think or know somebody is angry at me | NONE |
| BIS5 ‘Even if something bad is about to happen to me, I rarely experience fear or nervousness | Weak loadings in children, formed separate factors with BIS7 in early and late adolescents |
| BIS6 ‘I feel worried when I think I have done poorly at something important’ | NONE |
| BIS7 ‘I have very few fears compared to my friends’ | Weak loadings in children, formed separate factors with BIS5 in early and late adolescents |
|
| |
| RWD1 ‘When I get something I want, I feel excited and energized’ | NONE |
| RWD2 ‘When I'm doing well at something I love to keep at it’ | NONE |
| RWD3 ‘When good things happen to me, it affects me strongly’ | Weak loadings in children and early adolescents |
| RWD4 ‘It would excite me to win a contest’ | NONE |
| RWD5 ‘When I see an opportunity for something I like I get excited right away’ | NONE |
|
| |
| DRIVE1 ‘When I want something I usually go all-out to get it’ | NONE |
| DRIVE2 ‘I go out of my way to get things I want’ | NONE |
| DRIVE3 ‘If I see a chance to get something I want I move on it right away’ | NONE |
| DRIVE4 ‘When I go after something I use a no holds barred approach’ | NONE |
|
| |
| FUN1 ‘I will often do things for no other reason than that they might be fun’ | Weak loadings in adults, young adults, and children |
| FUN2 ‘I crave excitement and new sensations’ | Weak loadings in late adolescents, cross-loadings in early adolescents and children |
| FUN3 ‘I'm always willing to try something new if I think it will be fun’ | Weak loadings in late adolescents, cross-loadings in young adults, early adolescents, and children |
| FUN4 ‘I often act on the spur of the moment’ | Loaded on own factor in young adults, late adolescents, and children |
The wording of each item is presented in the left column; a description of the problems arising in the exploratory factor analyses is presented in the right column. This describes results of the EFA extracting all factors with eigenvalues greater than one. Problematic items cut in the revised model are in bold.
To summarize, all three EFAs lead to three-factor models, trimming the FUN subscale. EFAs using Horn's parallel analysis and minimum average partials for factor extraction both lead to a five item BIS scale (BIS1, BIS2, BIS3, BIS4, and BIS6), while extracting factors with eigenvalues greater than one lead to a four item BIS scale (also removing BIS1). The Horn's parallel analysis and eigenvalues greater than one approaches both lead to RWD3 being cut, while the parallel analysis approach also lead to RWD5 being cut. The minimum average partials approach retained all REWARD items and added FUN3 to this factor. The full DRIVE subscale was retained in the EFAs using minimum average partials and all factors with eigenvalues greater than one, whereas the parallel analysis approach lead to removing DRIVE1. Thus, there were both similarities and differences across the results from the three approaches to factor extraction and therefore we tested all three trimmed models using CFA, as described below.
Confirmatory Factor Analyses Across Development
Next, we examined the fit of the Carver and White four-factor model using CFA in the second half of participants from each age group (Table 3). The Carver and White four-factor model (including all items) showed relatively poor fit, only passing CFI criteria (≥0.95) in the adult and early adolescent groups and the RMSEA criteria (<0.06) in the early adolescent groups. Furthermore, the baseline model testing configural invariance across age groups, i.e. pooling data across age groups, only passed CFI but not RMSEA criteria (χ2(164)=1598, p<0.001, CFI=0.958, RMSEA=0.063, 90% CI=0.060-0.066, p<0.001).
Table 3. Fit Indices for Standard and Revised Models.
| Standard Model | χ2 | χ2 p-value | CFI | RMSEA | lower CI | upper CI | RMSEA p |
|---|---|---|---|---|---|---|---|
| Adults | 353.36 | <0.001 | 0.96 | 0.07 | 0.06 | 0.08 | 0.001 |
| Young Adults | 541.75 | <0.001 | 0.94 | 0.07 | 0.07 | 0.08 | <0.001 |
| Late Adolescents | 323.15 | <0.001 | 0.95 | 0.07 | 0.06 | 0.96 | 0.001 |
| Early Adolescents | 245.59 | <0.001 | 0.96 | 0.06 | 0.04 | 0.07 | 0.22 |
| Children | 281.12 | <0.001 | 0.91 | 0.08 | 0.06 | 0.10 | 0.002 |
| Revised Model | χ2 | χ2 p-value | CFI | RMSEA | lower CI | upper CI | RMSEA p |
|
| |||||||
| Adults | 77.15 | 0.01 | 0.99 | 0.05 | 0.02 | 0.07 | 0.58 |
| Young Adults | 69.96 | 0.04 | 0.99 | 0.03 | 0.01 | 0.05 | 0.98 |
| Late Adolescents | 63.78 | 0.11 | 0.99 | 0.04 | 0.00 | 0.06 | 0.75 |
| Early Adolescents | 90.23 | 0.001 | 0.97 | 0.07 | 0.05 | 0.09 | 0.08 |
| Children | 117.53 | <0.001 | 0.90 | 0.11 | 0.08 | 0.13 | <0.001 |
Fits for the standard model are derived from confirmatory factor analysis examining the whole sample. Fits for the revised model utilize the second half of participants only (independent from those used for the exploratory analysis; children N=115, early adolescents N=156, late adolescents N=177, young adults N=422, adults N=235). The revised model removed the FUN subscale as well as removing BIS1, BIS5, BIS7, and REWARD3. Fit indices include χ2 (chi-square test statistic: standard model df = 164; revised model df = 51) and associated p-value, comparative fit index (CFI), and root mean squared error of approximation (RMSEA) and associated 90% confidence interval (CI) upper and lower bounds and p-value. CFI ≥ 0.95, RMSEA ≤ 0.06, RMSEA upper CI ≤ 0.08, and RMSEA p>0.05 are in bold.
These results were compared with CFA fits for the three trimmed models ascertained from the above EFAs. All three models showed improved fit overall as compared to the Carver and White model. Table 3 presents the CFA fit of the model established from the EFAs extracting all factors with eigenvalues > 1 (removing BIS1, BIS5, BIS7, REWARD3, and the FUN subscale). This model passed CFI and RMSEA criteria for the adults, young adults, and late adolescents and passed CFA criteria for the early adolescents. Neither this model nor the Carver and White model passed criteria in the child sample. Invariance of this model is discussed below. The other trimmed models passed CFI criteria (but not RMSEA) in the adult group, both CFI and RMSEA in the young adults and late adolescents, and MAP3 passed CFI criteria for early adolescents. Neither of these models passed criteria in the child group either. Additionally, both models passed CFI but not RMSEA criteria for baseline model testing configural invariance across age groups (see Supplementary Tables 7-8 for age and sex invariance of these models).
Factor covariances and subscale correlations (mean scores) for the Carver and White four-factor model and the revised model are presented in Supplementary Table 9. Ordinal alpha estimates (examining polychoric correlation matrices) for all four models are presented in Supplementary Table 10.
Age and Sex Invariance of the Revised Model
Table 5 shows the results of step-wise invariance tests comparing all age groups and comparing males and females for the revised model trimming BIS1, BIS5, BIS7, REWARD3, and the FUN subscale. The configural model testing age invariance showed good fit, suggesting that a similar factor structure was present across age groups. The change in fit from the configural to the weak invariance model (fixing item loadings to be equal across all groups) passed criteria for invariance (decrease in CFI ≤ 0.010 and increase in RMSEA ≤ 0.015). Change in fit from the weak to strong invariance model (fixing item loadings and thresholds to be equal across groups) also passed RMSEA criteria for invariance but slightly exceeded criteria for invariance based on change in CFI (decrease of 0.012), though the CFI of the strong invariance model still had good fit (CFI >0.95). Change in fit from the strong to strict model (fixing item loadings, thresholds, and unique/residual variance to be equal across groups) also passed change in CFI and RMSEA criteria for invariance.
Table 5. Results of Invariance Tests for the Revised Model.
| Age Invariance | χ2 | df | CFI | RMSEA | lower CI | upper CI | RMSEA p | Change in CFI | Change in RMSEA |
|---|---|---|---|---|---|---|---|---|---|
| Configural | 635.931 | 255 | 0.978 | 0.058 | 0.053 | 0.064 | 0.009 | - | - |
| Weak | 733.768 | 291 | 0.974 | 0.059 | 0.053 | 0.064 | 0.003 | -0.004 | 0.001 |
| Strong | 977.839 | 327 | 0.962 | 0.067 | 0.062 | 0.072 | 0.000 | -0.012 | 0.008 |
| Strict | 977.839 | 375 | 0.965 | 0.060 | 0.056 | 0.065 | 0.000 | 0.003 | -0.007 |
|
| |||||||||
| Sex Invariance | χ2 | df | CFI | RMSEA | lower CI | upper CI | RMSEA p | Change in CFI | Change in RMSEA |
|
| |||||||||
| Configural | 338.317 | 102 | 0.986 | 0.046 | 0.040 | 0.051 | 0.894 | - | - |
| Weak | 351.180 | 111 | 0.986 | 0.044 | 0.039 | 0.050 | 0.963 | -0.002 | -0.001 |
| Strong | 398.220 | 120 | 0.984 | 0.046 | 0.041 | 0.051 | 0.912 | 0.002 | 0.002 |
| Strict | 398.220 | 132 | 0.984 | 0.043 | 0.038 | 0.048 | 0.993 | -0.003 | -0.003 |
Fit statistics for models testing age invariance are on the top half of the table; models testing sex invariance are on the bottom half of the table. The configural invariance models included all age groups or both the male and female groups in one model. The weak invariance model fixed factor loadings to be equal across all groups. The strong invariance model fixed factor loadings and item thresholds to be equal across groups. The strict invariance model fixed factor loadings, item thresholds, and unique/residual item variances to be equal across groups. Change in CFI and RMSEA were calculated for each model minus the previous model; negative change in CFI and positive change in RMSEA indicate a decrement in fit. Fit indices and change in fit indices passing criteria for good fit are in bold (CFI ≥ 0.95; RMSEA ≤ 0.06, RMSEA upper CI ≤ 0.08; RMSEA p>0.05; change in CFI ≥ -0.01; change in RMSEA ≤ 0.015).
Step-wise tests examining invariance across males and females showed good fit and minimal decrement in fit at all steps. This model passed all criteria to indicate strict invariance (Table 5) suggesting loadings, thresholds, and unique/residual variance to be equal across males and females.
Age and Sex Predicting BIS/BAS Scores
Regression results predicting revised subscale mean scores are presented in Supplementary Table 11. Age and sex were significant predictors of BIS in step 1 of this regression, where BIS was higher later in development and higher among females. In step 2, there was a significant age × sex interaction indicating higher BIS scores later in development particularly among females. The quadratic age term and its interaction with sex were also significant predictors in step 3, indicating a concave quadratic function reaching a higher peak among females (Figure 1C). Finally, step 4 indicated that a cubic age function best fit the data but that this did not differ by sex. The significant cubic function captures the steep relation between age and BIS from childhood through young adulthood and the relatively shallow decline in BIS from young adulthood through later adulthood (Figure 1D).
Figure 1. Revised Subscale Scores By Age and Sex.
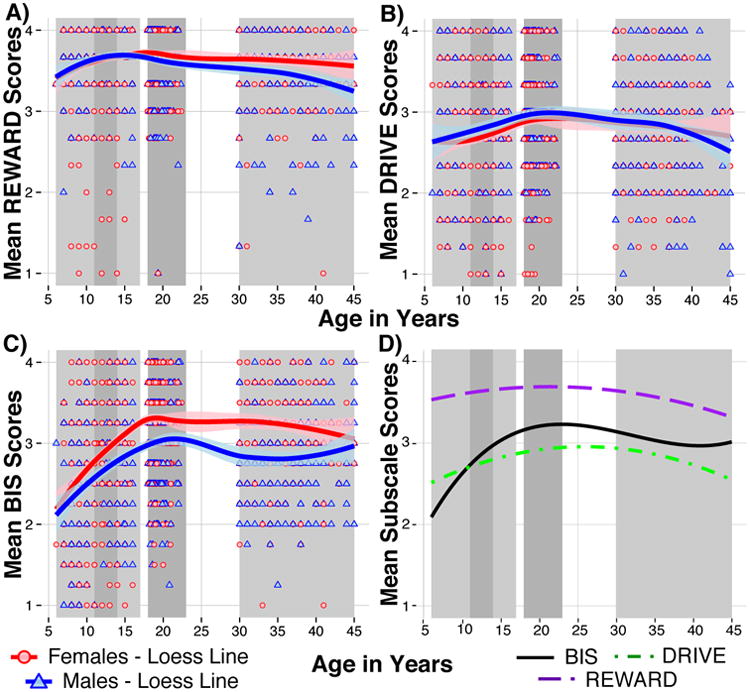
The first three panels present scatter plots of participant age against revised subscale mean scores: (A) REWARD (RWD1, RWD2, RWD4, RWD5), (B) DRIVE (DRIVE1, DRIVE2, DRIVE3, DRIVE4), (C) BIS (BIS2, BIS3, BIS4, BIS6). Loess fit lines with 95% confidence intervals are plotted by sex for these panels. Panel (D) displays the regression fit lines for all three subscales (cubic function for BIS, quadratic function for REWARD and DRIVE). The gray shaded regions on all panels mark the age groups used in the EFA and CFA analyses (from left to right: children, early adolescents, late adolescents, young adults, adults).
Examining REWARD subscale scores, we observed a significant effect of sex, a significant age × sex interaction, and found that the quadratic age function best fit the data (Figure 1D). There was a relatively shallow positive relation between REWARD scores and age through young adulthood and a comparably shallow decline into later adulthood. Similar to BIS scores, females showed higher REWARD scores on average. However, scores showed a divergence by sex beginning in young adulthood with males showing declining REWARD scores (Figure 1A). Finally, examining DRIVE scores, we observed a significant effect of sex, a significant interaction of age and sex, and found that the quadratic age function best fit the data (Figure 1D). DRIVE also showed a relatively shallow positive relation with age through young adulthood and comparably shallow declines through later adulthood. Males showed higher DRIVE scores on average, particularly earlier in development (Figure 1B).
Finally, it is important to note that the size of these age and sex effects varied by subscale. The regression model accounted for 16.3% of the total variance in BIS scores whereas it accounted for much less variance in REWARD (4.7%) and DRIVE scores (2.9%), potentially suggesting larger age-related developments in BIS than BAS as well as more salient sex differences (e.g. main effect of sex predicting BIS b=0.49 vs. predicting REWARD b=0.20). Figure 1d shows the regression fit lines for the three subscales (cubic function for BIS, quadratic function for REWARD and DRIVE) to visualize the relative associations across subscales.
Discussion
Overall, the current results indicate that the Carver and White four-factor model does not adequately fit BIS/BAS data collected from children, early adolescents, late adolescents, young adults, and adults. We found that the BIS1, BIS5, BIS7, REWARD3, and FUN subscale items had consistently problematic factor loadings across age groups in our EFAs. A revised model in which these items were removed showed improved model fit, generally reaching validated cutoff criteria for good fit, and also showed strict invariance across developmental age groups and by sex. Finally, we identified normative differences in BIS/BAS scores across age and by sex. Particularly, we found that both BIS and BAS scores showed positive associations with age across early development, peaking in young adulthood (∼20-25 years), and declining into later adulthood. Further, sex differences in BIS and REWARD emerged in late adolescence/young adulthood, with females showing greater scores, whereas sex differences in DRIVE were observed in adolescence, with males showing greater scores.
Evaluating Model Fit and Model Revision
In a confirmatory factor analysis, we found that the original Carver and White four-factor model did not adequately fit the BIS/BAS data from any of our age groups. The current fit results are similar to those previously reported in the literature, with most failing to pass validated cutoff criteria (Hu & Bentler, 1999). To address this poor fit, we identified problematic items that showed weak and/or inconsistent loadings across developmental age groups. In particular, BIS1, BIS5, BIS7, REWARD3, and the FUN subscale items showed consistent problems and were flagged for removal.
Similar fit issues have been previously noted in the literature. In particular, in an exploratory factor analysis, Cogswell, Alloy, van Dulmen, & Fresco (2006) noted that BIS5, BIS7, and FUN3showed weak loadings on their a priori factor and/or strong loadings on a different factor and that removing these items improved CFA fit. In other work, to establish well-fitting models for testing invariance across ethnic groups, BIS5, BIS7, and FUN3 had to be removed for each group's model, in addition to several other items in specific groups (Demianczyk, Jenkins, Henson, & Conner, 2014). Relatedly, tests of age invariance across adults and adolescents improved by freeing parameters for or eliminating BIS5 and BIS7 (Cooper, Perkins, & Corr, 2007; Yu et al., 2011). These two BIS items have been cited as problematic in many other studies as well (e.g., Campbell-Sills, Liverant, & Brown, 2004; Cogswell et al., 2006; Jorm et al., 1998; Morean et al., 2014; Poythress et al., 2008; Yu et al., 2011). In a PCA of data from children, Muris et al. (2005) found that BIS5 loaded alone on a fourth factor in a four-factor solution where FUN was not a separable factor.
Given that the items that we flagged for removal have often been altered or removed in previous studies, these issues are likely not specific to our sample, but rather may be problematic across development or across ethnicities/languages, as noted in other studies. However, despite the relative consistency regarding which items are problematic, it is not clear why these items are problematic. One possibility is that item-specific methodological properties or complex/idiomatic wording may disrupt relations with the hypothesized factor. In the case of the two reverse-scored items, BIS5 and BIS7, the wording of these items may be cognitively challenging and confusing, particularly for younger age groups. For example, to correctly interpret BIS7 (“I have very few fears compared to my friends.”), one must understand that disagreeing with that statement indicates not having relatively few fears. Thus, rewording and simplifying these items may be helpful in the future (e.g., revising the item to “I have many fears compared to my friends”).
Another possibility is that ‘problematic’ items actually index a distinct construct. For example, some researchers have proposed that BIS is actually comprised of two factors, Anxiety and Fear, with the two reverse-scored items indexing the Fear factor, termed the Fight-Flight-Freezing System (FFFS),(Beck, Smits, Claes, Vandereycken, & Bijttebier, 2009; Poythress et al., 2008; Johnson, Turner, & Iwata (2003). While a FFFS factor would characterize an interesting construct, given our results, we think that inconsistent/weak loading of BIS5 and BIS7 onto the larger BIS factor more likely represents methodological/wording issues with these particular items rather than them measuring a separable conceptual factor. Thus, it would be more appropriate to reword these items to better characterize BIS and/or to create new items to specifically address the FFFS, rather than separating them into two-item FFFS factor.
It should also be noted that although removing problematic items and the FUN subscale improved model fit, it is unclear whether the revised subscales assess the same constructs as the original Carver and White BIS/BAS. If these items are simply problematic due to wording/method properties, the edited version likely assesses the same constructs as the original version. However, if these items are problematic because they more closely assess related, but separable constructs, removing items would provided a more specific assessment of the desired construct. Given that only one item from the REWARD subscale was removed (and none from the DRIVE subscale), we feel that these scores still likely assess the originally intended construct. As noted above, while removing these BIS items may provided a better assessment of the intended construct, studies are needed to establish criterion validity of the revised subscales compared with the original version. However, rewording these problematic items to remove the reverse coding and any idiomatic language may be the best course of action for future use of the BIS/BAS (as well as re-establishing the factor structure of the questionnaire with revised wording). Additionally, work should aim to disentangle item valence and content, which has been posed as a problem inherent in other personality self-report (Pettersson et al., 2011). In particular, the BAS items tend to describe positive traits/tendencies, while the BIS items tend to reflect more negative traits/tendencies. Thus, future attempts to reword items should aim, for example, to confirm that BIS items are reflecting punishment sensitivity rather than a tendency to endorse negatively valenced items/self-descriptions.
Normative Effects of Age and Sex on BIS/BAS Scores
Age, sex, and their interaction predicted revised BIS and BAS scores in the current analyses. In particular, in this cross-sectional study, BIS and BAS mean scores positively associated with age across early development, peaked around young adulthood, and decreased into later adulthood. Such ‘inverted U-shaped’ patterns have been seen in previous studies of BIS/BAS sensitivity where BAS levels increased over early/late adolescence (9-17 years), peaked in young adulthood (18-23 years), and then declined (Urosevic, Collins, Muetzel, Lim, & Luciana, 2012). Developmental neuroimaging studies also highlight an ‘inverted U-shaped’ trajectory in striatal response to reward; however, the age groups investigated and the age ranges defining ‘adolescence’ and ‘adulthood’ are quite variable in this literature (for commentary, see Galvan, Van Leijenhorst, & McGlennen, 2012; Luna, Velanova, & Geier, 2010; Richards et al., 2013). Specifically, the age range that we define as young adulthood (18-22 years) most often is not included in these studies or is combined with a much larger adult age range (e.g., 18-30 years).
We observed a positive relation between BAS scores and age across childhood/adolescence, which is consistent with the extant neuroimaging literature (Galvan, 2010; Spear, 2011). However, we, and others (e.g., Urosevic et al., 2012), also observed higher BAS scores persisting into young adulthood. This finding has significant practical implications as college students (here, young adults) often form the bulk of participant pools when investigating BIS/BAS scales, related behaviors, and other normative aspects of cognition and affect. Whether the differences in BAS observed here between late adolescence and young adulthood relate to similar differences in neural response to reward is an important open question.
Interestingly, we found that mean BAS REWARD scores were the highest among the subscales across development; further while REWARD did differ across age, it showed the shallowest associations with age, indicating that positive affective responses to rewarding outcomes tend to be strong and remain so at all stages in development. The modest difference in BAS REWARD from childhood to young adulthood stands in stark contrast to the steep positive relation between age and BIS across this age range. These results are particularly compelling and suggest that examining measures of both appetitive motivation and response to punishment/negative feedback will be fruitful for developmental researchers (for developmental studies investigating both reward and punishment/loss, see Barkley-Levenson, Van Leijenhorst, & Galvan, 2013; Galvan & McGlennen, 2013; Luking, Luby, & Barch, 2014).
Our results also indicated that males tend to exhibit slightly higher BAS DRIVE earlier in development, while, for the other subscales, sex differences emerged over development with females scoring higher than males. In particular, females exhibited higher BIS scores, and this sex difference intensified from adolescence onward, a pattern also reported by Urosevic et al. (2012). Relatedly, higher scores for females than for males on BAS REWARD emerged in young adults and adults. These results build on the current literature, which typically shows higher scores on BIS and BAS REWARD in adult females than males, and mixed findings regarding elevated DRIVE in males (e.g. Carver & White, 1994; Johnson et al., 2003; Jorm et al., 1998). Specifically, we found that these sex differences previously observed in adult samples emerge across development. This rapid increase in BIS relative to BAS for adolescent females is highly relevant for our understanding of the development of internalizing psychopathology and the emergence of sex differences in the prevalence of anxiety and depression in adolescence/puberty (Angold, Costello, & Worthman, 1998). Previous work suggests that having high BIS sensitivity is related to an increased likelihood of having depression or anxiety (Johnson et al., 2003) and that both BAS REWARD and BIS are elevated in those with disordered eating (Beck et al., 2009; Loxton & Dawe, 2001). This is consistent with other work suggesting that females tend to have higher neuroticism, anxiety, and extraversion scores, paralleling higher BIS and REWARD and also contributing to risk for certain forms of psychopathology (Feingold, 1994; McCrae, & Allik, 2002; McCrae, 2004). Given the emergence of higher rates of depression and eating disorders in female compared to male adolescents, our findings suggest the need to investigate normative sex differences emerging in BIS and BAS across development as potential risk factors for these disorders.
Limitations and Future Directions
While our current focus on cross-sectional data allows us to explore a wide range of ages, this approach is particularly susceptible to cohort effects. In particular, we cannot rule out the possibility that generational effects rather than developmental trajectories account for the observed EFA results or relations with age and sex. Similarly, given that participants were collected from a variety of sites, we cannot rule out location-specific effects on the results. Furthermore, we did not have sufficient samples sizes to examine invariance across ethnicity; differential ethnic distributions across the study samples may introduce some bias, e.g. the adult sample was almost entirely white while there was more diverse sampling in the younger age groups. Additionally, none of the models (original or revised) showed good CFA fits for the child age group. This would suggest that additional revision of the BIS/BAS items will be necessary to further improve its utility across development. As the revised model slightly exceeded criteria for change in CFI from the weak to strong invariance models, we cannot rule out that differences in item thresholds across age groups might have contributed to some of the observed age differences. Finally, future methodological work should further probe these items and revisions to the scale. For example, we did not pursue hierarchical or bifactor models (for current guidelines, see Canivez (in press); Reise (2012)) currently, but given the observed factor correlations (see Supplement) this could be an interesting avenue for future investigation.
Importantly, future longitudinal studies will be necessary to confirm trajectories of normative BIS/BAS development and to investigate how individual differences in BIS/BAS influence trajectories of risk and resilience to various types of psychopathology. Relatedly, while we believe that trimming problematic items has not altered the constructs being measured and in fact may improve the subscales as measures of their intended theoretic constructs by removing extraneous items, it will be important to assess the criterion validity of the revised model (or of any edits made to the wording of problematic items). Particularly, future work should assess whether the revised model is more predictive of relevant personality, behaviors, and psychopathology outcomes than the original subscales. It will also be important to relate developmental changes in BIS and BAS sensitivity to developmental changes in behavior and brain function to gain a more comprehensive understanding of the emergence of these critical aspects of brain-behavioral associations relevant to a broad range of psychopathologies. Finally, it will be important to explore other environmental predictors of BIS/BAS sensitivity, for example, to test how stress or socio-economic status influence reward and punishment sensitivity.
Summary and Recommendations
Our findings suggest that Carver and White's four-factor model is a poor fit to BIS/BAS data within adulthood and across development. We propose a revised three-factor model that removes the FUN subscale and the BIS1, BIS5, BIS7, and REWARD3 items. This model shows improved fit and strict invariance across age groups and sex. It is also important to note that there is a positive relation between age and BIS/BAS scores across development that peaks around young adulthood, as well as sex differences that emerge in adolescence and young adulthood, particularly for BIS scores.
Thus, when using BIS/BAS data collected with the standard Carver and White scale, we recommend removing the problematic items noted above before computing subscale scores. This can improve model fit and allow for more appropriate comparisons across development. While we recommend removing the FUN subscale to improve model fit, the FUN subscale has shown relevance in the study of externalizing disorders (Colder & O'Connor, 2004) and substance use/abuse in adolescent populations (Hasking, 2007; Johnson et al., 2003; Loxton & Dawe, 2001). Therefore, we recommend that future work examine rewording the FUN subscale and other problematic items (i.e. changing confusing wording in reverse-scored items and removing idiomatic language) and thoroughly test revised items/scores to ensure good fit across populations.
Supplementary Material
Acknowledgments
The studies from which participants were drawn for the current study were supported by grants from the National Institute of Mental Health (MH097335 [K.R.L.], MH74849 [I.H.G.], MH092603 [T.M.O.], MH097767 [G.H.]), the National Institute on Drug Abuse (DA018899 [A.P.A.], DA027096 [A.P.A.], DA018899 [C.P.], DA007261 [C.P.]), the National Institute of General Medical Sciences (5T32GM081739 [D.P. & K.R.L.]), the National Alliance for Research on Schizophrenia and Depression (D.M.B.), the Canadian Institute of Health Research (MOP 86458 [E.P.H.]), and the Social Sciences and Humanities Research Council of Canada (E.P.H). The funding agencies had no further role in the design and conduct of the current study, analysis, and interpretation of data, or preparation, review, or approval of the manuscript. Authors D.P. and K.R.L. had full access to all study data and takes responsibility for the integrity of the data and accuracy of the data analysis. We would like to thank all participants and their families that provided time and effort to making this study possible.
Footnotes
The authors have no financial interest(s) or conflicts to disclose.
Contributor Information
David Pagliaccio, Washington University in St. Louis.
Katherine R. Luking, Washington University in St. Louis.
Andrey P. Anokhin, Washington University in St. Louis
Ian H. Gotlib, Stanford University
Elizabeth P. Hayden, Western University
Thomas M. Olino, Temple University
Chun-Zi Peng, Washington University in St. Louis.
Greg Hajcak, Stony Brook University.
Deanna M. Barch, Washington University in St. Louis
References
- Angold A, Costello EJ, Worthman CM. Puberty and depression: the roles of age, pubertal status and pubertal timing. Psychol Med. 1998;28(1):51–61. doi: 10.1017/s003329179700593x. [DOI] [PubMed] [Google Scholar]
- Barkley-Levenson EE, Van Leijenhorst L, Galvan A. Behavioral and neural correlates of loss aversion and risk avoidance in adolescents and adults. Dev Cogn Neurosci. 2013;3:72–83. doi: 10.1016/j.dcn.2012.09.007. [DOI] [PMC free article] [PubMed] [Google Scholar]
- Beck I, Smits DJM, Claes L, Vandereycken W, Bijttebier P. Psychometric evaluation of the behavioral inhibition/behavioral activation system scales and the sensitivity to punishment and sensitivity to reward questionnaire in a sample of eating disordered patients. Personality and Individual Differences. 2009;47(5):407–412. [Google Scholar]
- Bollen KA. Structural equations with latent variables. New York: Wiley; 1989. [Google Scholar]
- Brannick MT. Critical comments on applying covariance structure modeling. Journal of Organizational Behavior. 1995;16:201–214. [Google Scholar]
- Bress JN, Foti D, Kotov R, Klein DN, Hajcak G. Blunted neural response to rewards prospectively predicts depression in adolescent girls. Psychophysiology. 2013;50(1):74–81. doi: 10.1111/j.1469-8986.2012.01485.x. [DOI] [PubMed] [Google Scholar]
- Bress JN, Smith E, Foti D, Klein DN, Hajcak G. Neural response to reward and depressive symptoms in late childhood to early adolescence. Biol Psychol. 2012;89(1):156–162. doi: 10.1016/j.biopsycho.2011.10.004. [DOI] [PMC free article] [PubMed] [Google Scholar]
- Campbell-Sills L, Liverant GI, Brown TA. Psychometric evaluation of the behavioral inhibition/behavioral activation scales in a large sample of outpatients with anxiety and mood disorders. Psychol Assess. 2004;16(3):244–254. doi: 10.1037/1040-3590.16.3.244. [DOI] [PubMed] [Google Scholar]
- Canivez GL. Bifactor modeling in construct validation of multifactored tests: Implications for understanding multidimensional constructs and test interpretation. In: Schweizer K, DiStefano C, editors. Principles and methods of test construction: Standards and recent advancements. Gottingen, Germany: Hogrefe Publishers; in press. [Google Scholar]
- Carver CS, White TL. Behavioral inhibition, behavioral activation, and affective responses to impending reward and punishment: the BIS/BAS scales. Journal of Personality and Social Psychology. 1994;67(2):319–333. [Google Scholar]
- Chen FF. Sensitivity of Goodness of Fit Indexes to Lack of Measurement Invariance. Structural Equation Modeling: a Multidisciplinary Journal. 2007;14(3):464–504. [Google Scholar]
- Cheung GW, Rensvold RB. Evaluating Goodness-of-Fit Indexes for Testing Measurement Invariance. Structural Equation Modeling: a Multidisciplinary Journal. 2002;9(2):233–255. doi: 10.1207/S15328007SEM0902_5. [DOI] [Google Scholar]
- Cogswell A, Alloy LB, van Dulmen MHM, Fresco DM. A psychometric evaluation of behavioral inhibition and approach self-report measures. Personality and Individual Differences. 2006;40(8):1649–1658. [Google Scholar]
- Colder CR, O'Connor RM. Gray's reinforcement sensitivity model and child psychopathology: laboratory and questionnaire assessment of the BAS and BIS. J Abnorm Child Psychol. 2004;32(4):435–451. doi: 10.1023/b:jacp.0000030296.54122.b6. [DOI] [PubMed] [Google Scholar]
- Cooper A, Gomez R, Aucote H. The Behavioural Inhibition System and Behavioural Approach System (BIS/BAS) Scales: Measurement and structural invariance across adults and adolescents. Personality and Individual Differences. 2007;43(2):295–305. [Google Scholar]
- Cooper JA, Perkins AM, Corr PJ. A Confirmatory Factor Analytic Study of Anxiety, Fear, and Behavioral Inhibition System Measures. Journal of Individual Differences. 2007;28(4):179–187. [Google Scholar]
- Costello AB, Osborne JW. Best Practices in Exploratory Factor Analysis: Four Recommendations for Getting the Most From Your Analysis. Practical Assessment, Research, & Evaluation. 2005:1–9. [Google Scholar]
- Demianczyk AC, Jenkins AL, Henson JM, Conner BT. Psychometric Evaluation and Revision of Carver and White's BIS/BAS Scales in a Diverse Sample of Young Adults. J Pers Assess. 2014 doi: 10.1080/00223891.2013.870570. [DOI] [PubMed] [Google Scholar]
- Dowd EC, Barch DM. Anhedonia and emotional experience in schizophrenia: neural and behavioral indicators. Biol Psychiatry. 2010;67(10):902–911. doi: 10.1016/j.biopsych.2009.10.020. [DOI] [PMC free article] [PubMed] [Google Scholar]
- Epskamp A. semPlot: Path diagrams and visual analysis of various SEM packages' output 2013 [Google Scholar]
- Eshel N, Roiser JP. Reward and punishment processing in depression. Biol Psychiatry. 2010;68(2):118–124. doi: 10.1016/j.biopsych.2010.01.027. [DOI] [PubMed] [Google Scholar]
- Fabrigar LR, Wegener DT, MacCallum RC, Strahan EJ. Evaluating the use of exploratory factor analysis in psychological research. Psychological Methods. 1999;4(3):272. [Google Scholar]
- Feingold A. Gender differences in personality: a meta-analysis. [Meta-Analysis] Psychol Bull. 1994;116(3):429–456. doi: 10.1037/0033-2909.116.3.429. [DOI] [PubMed] [Google Scholar]
- Forbes EE, Shaw DS, Dahl RE. Alterations in reward-related decision making in boys with recent and future depression. Biol Psychiatry. 2007;61(5):633–639. doi: 10.1016/j.biopsych.2006.05.026. [DOI] [PubMed] [Google Scholar]
- Foti D, Kotov R, Klein DN, Hajcak G. Abnormal neural sensitivity to monetary gains versus losses among adolescents at risk for depression. J Abnorm Child Psychol. 2011;39(7):913–924. doi: 10.1007/s10802-011-9503-9. [DOI] [PubMed] [Google Scholar]
- Franken IHA, Muris P, Rassin E. Psychometric Properties of the Dutch BIS/BAS Scales. Journal of Psychopathology and Behavioral Assessment. 2005;27(1):25–30. [Google Scholar]
- Galvan A. Adolescent development of the reward system. Front Hum Neurosci. 2010;4:6. doi: 10.3389/neuro.09.006.2010. [DOI] [PMC free article] [PubMed] [Google Scholar]
- Galvan A, McGlennen KM. Enhanced striatal sensitivity to aversive reinforcement in adolescents versus adults. J Cogn Neurosci. 2013;25(2):284–296. doi: 10.1162/jocn_a_00326. [DOI] [PubMed] [Google Scholar]
- Galvan A, Van Leijenhorst L, McGlennen KM. Considerations for imaging the adolescent brain. Dev Cogn Neurosci. 2012;2(3):293–302. doi: 10.1016/j.dcn.2012.02.002. [DOI] [PMC free article] [PubMed] [Google Scholar]
- Garrido LE, Abad FJ, Ponsoda V. Performance of Velicer's minimum average partial factor retention method with categorical variables. Educational and Psychological Measurement 2011 [Google Scholar]
- Garrido LE, Abad FJ, Ponsoda V. A new look at Horn's parallel analysis with ordinal variables. Psychological methods. 2013;18(4):454. doi: 10.1037/a0030005. [DOI] [PubMed] [Google Scholar]
- Gotlib IH, Hamilton JP, Cooney RE, Singh MK, Henry ML, Joormann J. Neural processing of reward and loss in girls at risk for major depression. Arch Gen Psychiatry. 2010;67(4):380–387. doi: 10.1001/archgenpsychiatry.2010.13. [DOI] [PMC free article] [PubMed] [Google Scholar]
- Gray JA. The psychophysiological basis of introversion-extraversion. Behav Res Ther. 1970;8(3):249–266. doi: 10.1016/0005-7967(70)90069-0. [DOI] [PubMed] [Google Scholar]
- Gray JA. A critique of Eysenck's theory of personality. Berlin: Springer-Verlag; 1981. [Google Scholar]
- Gray JA. The neuropsychology of anxiety: An enquiry into the functions of the septo-hippocampal system. New York: Oxford University Press; 1982. [Google Scholar]
- Gray JA. The psychology of fear and stress. Cambridge: Cambridge University Press; 1987. [Google Scholar]
- Gray JA. Framework for a taxonomy of psychiatric disorder. Hove: Lawrence Erlbaum; 1994. [Google Scholar]
- Hasking PA. Reinforcement sensitivity, coping, and delinquent behaviour in adolescents. J Adolesc. 2007;30(5):739–749. doi: 10.1016/j.adolescence.2006.11.006. [DOI] [PubMed] [Google Scholar]
- Hayden EP, Klein DN, Dougherty LR, Olino TM, Laptook RS, Dyson MW, et al. Singh SM. The dopamine D2 receptor gene and depressive and anxious symptoms in childhood: associations and evidence for gene-environment correlation and gene-environment interaction. Psychiatr Genet. 2010;20(6):304–310. doi: 10.1097/YPG.0b013e32833adccb. [DOI] [PMC free article] [PubMed] [Google Scholar]
- Heym N, Ferguson E, Lawrence C. An evaluation of the relationship between Gray's revised RST and Eysenck's PEN: Distinguishing BIS and FFFS in Carver and White's BIS/BAS scales. Personality and Individual Differences. 2008;45(8):709–715. [Google Scholar]
- Hu LT, Bentler PM. Cutoff criteria for fit indexes in covariance structure analysis: Conventional criteria versus new alternatives. Structural Equation Modeling: a Multidisciplinary Journal. 1999;6(1):1–55. [Google Scholar]
- Insel T, Cuthbert B, Garvey M, Heinssen R, Pine DS, Quinn K, et al. Wang P. Research domain criteria (RDoC): toward a new classification framework for research on mental disorders. Am J Psychiatry. 2010;167(7):748–751. doi: 10.1176/appi.ajp.2010.09091379. [DOI] [PubMed] [Google Scholar]
- Institute of Medicine (US) and National Research Council (US) Committee on the Science of Adolescence. The Science of Adolescent Risk-Taking: Workshop Report. Washington (DC): National Academies Press (US); 2011. [PubMed] [Google Scholar]
- Johnson SL, Turner RJ, Iwata N. BIS/BAS levels and psychiatric disorder: An epidemiological study. Journal of Psychopathology and Behavioral Assessment. 2003;25:25–36. [Google Scholar]
- Johnson SL, Turner RJ, Iwata N. BIS/BAS Levels and Psychiatric Disorder: An Epidemiological Study. Journal of Psychopathology and behavioral assessment. 2003;25(1):1–12. [Google Scholar]
- Jonker NC, Ostafin BD, Glashouwer KA, van Hemel-Ruiter ME, de Jong PJ. Reward and punishment sensitivity and alcohol use: the moderating role of executive control. Addict Behav. 2014;39(5):945–948. doi: 10.1016/j.addbeh.2013.12.011. [DOI] [PubMed] [Google Scholar]
- Jorm AF, Christensen H, Henderson AS, Jacomb PA, Korten AE, Rodgers B. Using the BIS/BAS scales to measure behavioural inhibition and behavioural activation: Factor structure, validity and norms in a large community sample. Personality and Individual Differences. 1998;26(1):49–58. [Google Scholar]
- Kingsbury A, Coplan RJ, Weeks M, Rose-Krasnor L. Covering all the BAS's: A closer look at the links between BIS, BAS, and socio-emotional functioning in childhood. Personality and Individual Differences. 2013;55(5):521–526. [Google Scholar]
- Lebel C, Beaulieu C. Longitudinal development of human brain wiring continues from childhood into adulthood. J Neurosci. 2011;31(30):10937–10947. doi: 10.1523/JNEUROSCI.5302-10.2011. [DOI] [PMC free article] [PubMed] [Google Scholar]
- Lebel C, Walker L, Leemans A, Phillips L, Beaulieu C. Microstructural maturation of the human brain from childhood to adulthood. Neuroimage. 2008;40(3):1044–1055. doi: 10.1016/j.neuroimage.2007.12.053. [DOI] [PubMed] [Google Scholar]
- Loxton NJ, Dawe S. Alcohol abuse and dysfunctional eating in adolescent girls: the influence of individual differences in sensitivity to reward and punishment. Int J Eat Disord. 2001;29(4):455–462. doi: 10.1002/eat.1042. [DOI] [PubMed] [Google Scholar]
- Luking KR, Luby JL, Barch DM. Kids, candy, brain and behavior: Age differences in responses to candy gains and losses. Dev Cogn Neurosci. 2014;9C:82–92. doi: 10.1016/j.dcn.2014.01.005. [DOI] [PMC free article] [PubMed] [Google Scholar]
- Luna B, Velanova K, Geier CF. Methodological approaches in developmental neuroimaging studies. Hum Brain Mapp. 2010;31(6):863–871. doi: 10.1002/hbm.21073. [DOI] [PMC free article] [PubMed] [Google Scholar]
- McCrae RR. A contemplated revision of the NEO Five-Factor Inventory. Personality and Individual Differences. 2004;36(3):587–596. [Google Scholar]
- McCrae RR, Allik J. The Five-Factor Model of Personality Across Cultures. Springer Science & Business Media; 2002. [Google Scholar]
- Millsap RE, Yun-Tein J. Assessing factorial invariance in ordered-categorical measures. Multivariate Behavioral Research. 2004;39(3):479–515. [Google Scholar]
- Morean ME, DeMartini KS, Leeman RF, Pearlson GD, Anticevic A, Krishnan-Sarin S, et al. O'Malley SS. Psychometrically Improved, Abbreviated Versions of Three Classic Measures of Impulsivity and Self-Control. Psychol Assess. 2014 doi: 10.1037/pas0000003. [DOI] [PMC free article] [PubMed] [Google Scholar]
- Morgan JK, Olino TM, McMakin DL, Ryan ND, Forbes EE. Neural response to reward as a predictor of increases in depressive symptoms in adolescence. Neurobiol Dis. 2013;52:66–74. doi: 10.1016/j.nbd.2012.03.039. [DOI] [PMC free article] [PubMed] [Google Scholar]
- Muris P, Meesters C, de Kanter E, Timmerman PE. Behavioural inhibition and behavioural activation system scales for children: relationships with Eysencks personality traits and psychopathological symptoms. Personality and Individual Differences. 2005;38:831–841. [Google Scholar]
- Muthen B, Kaplan D. A comparison of some methodologies for the factor analysis of non - normal Likert variables. British Journal of Mathematical and Statistical Psychology. 1985;38(2):171–189. [Google Scholar]
- Muthen B, Kaplan D. A comparison of some methodologies for the factor analysis of non - normal Likert variables: A note on the size of the model. British Journal of Mathematical and Statistical Psychology. 1992;45(1):19–30. [Google Scholar]
- Olino TM, McMakin DL, Morgan JK, Silk JS, Birmaher B, Axelson DA, et al. Forbes EE. Reduced reward anticipation in youth at high-risk for unipolar depression: a preliminary study. Dev Cogn Neurosci. 2014;8:55–64. doi: 10.1016/j.dcn.2013.11.005. [DOI] [PMC free article] [PubMed] [Google Scholar]
- Pettersson E, Turkheimer E, Horn EE, Menatti AR. The General Factor of Personality and Evaluation. European Journal of Personality. 2011;26(3):292–302. doi: 10.1002/per.839. [DOI] [Google Scholar]
- Pornprasertmanit S, Miller P, Schoemann A, Rosseel Y. semTools: Useful tools for structural equation modeling 2013 [Google Scholar]
- Poythress NG, Skeem JL, Weir J, Lilienfeld SO, Douglas KS, Edens JF, Kennealy PJ. Psychometric Properties of Carver and White's (1994) BIS/BAS Scales in a Large Sample of Offenders. Pers Individ Dif. 2008;45(8):732–737. doi: 10.1016/j.paid.2008.07.021. [DOI] [PMC free article] [PubMed] [Google Scholar]
- Reise SP. The rediscovery of bifactor measurement models. Multivariate Behavioral Research. 2012;47:667–696. doi: 10.1080/00273171.2012.715555. [DOI] [PMC free article] [PubMed] [Google Scholar]
- Richards JM, Plate RC, Ernst M. A systematic review of fMRI reward paradigms in adolescents vs. adults: The impact of task design and implications for understanding neurodevelopment. Neurosci Biobehav Rev. 2013 doi: 10.1016/j.neubiorev.2013.03.004. [DOI] [PMC free article] [PubMed] [Google Scholar]
- Rosseel Y. lavaan: An R package for structural equation modeling 2012 [Google Scholar]
- Schmid J, Leiman JM. The development of hierarchical factor solutions. Psychometrika. 1957;22(1):53–61. [Google Scholar]
- Spear LP. The adolescent brain and age-related behavioral manifestations. Neurosci Biobehav Rev. 2000;24(4):417–463. doi: 10.1016/s0149-7634(00)00014-2. [DOI] [PubMed] [Google Scholar]
- Spear LP. Rewards, aversions and affect in adolescence: emerging convergences across laboratory animal and human data. Dev Cogn Neurosci. 2011;1(4):392–400. doi: 10.1016/j.dcn.2011.08.001. [DOI] [PMC free article] [PubMed] [Google Scholar]
- Team, R. C. R: A language and environment for statistical computing 2012 [Google Scholar]
- Tucker LR, Lewis C. A reliability coefficient for maximum likelihood factor analysis. Psychometrika. 1973;38(1-10) [Google Scholar]
- Urosevic S, Abramson LY, Harmon-Jones E, Alloy LB. Dysregulation of the behavioral approach system (BAS) in bipolar spectrum disorders: review of theory and evidence. Clin Psychol Rev. 2008;28(7):1188–1205. doi: 10.1016/j.cpr.2008.04.004. [DOI] [PMC free article] [PubMed] [Google Scholar]
- Urosevic S, Collins P, Muetzel R, Lim K, Luciana M. Longitudinal changes in behavioral approach system sensitivity and brain structures involved in reward processing during adolescence. Dev Psychol. 2012;48(5):1488–1500. doi: 10.1037/a0027502. [DOI] [PMC free article] [PubMed] [Google Scholar]
- Volkow ND, Wang GJ, Kollins SH, Wigal TL, Newcorn JH, Telang F, et al. Swanson JM. Evaluating dopamine reward pathway in ADHD: clinical implications. JAMA. 2009;302(10):1084–1091. doi: 10.1001/jama.2009.1308. [DOI] [PMC free article] [PubMed] [Google Scholar]
- Yu S, Branje SJT, Keusers L, Meeus WHJ. Psychometric Characteristics of Carver and White's BIS/BAS Scales in Dutch Adolescents and Their Mothers. Journal of Personality Assessment. 2011;93(5):500–507. doi: 10.1080/00223891.2011.595745. [DOI] [PubMed] [Google Scholar]
Associated Data
This section collects any data citations, data availability statements, or supplementary materials included in this article.