Abstract
Purpose
To provide anisotropic field-of-view (FOV) support for golden angle radial imaging.
Theory and Methods
In radial imaging, uniform spoke density leads to a circular FOV, which is excessive for objects with anisotropic dimensions. Larson et al. previously showed that the angular k-space spoke density can be determined by the desired anisotropic FOV. We show that conventional golden angle sampling can be deployed in an angle-normalized space and transformed back to k-space such that the desired non-uniform spoke density is preserved for arbitrary temporal window length. Elliptical FOVs were used to illustrate this generalized mapping approach. Point-spread-function and spoke density analysis was performed. Phantom and in vivo cardiac images were acquired.
Results
Simulations, phantom, and in vivo experiments confirmed that the proposed method is able to achieve anisotropic FOV while still maintaining the benefits of golden angle sampling. This approach requires 50% less spokes for elliptical FOV with major-to-minor-axis ratio of 1:0.3, when compared to isotropic FOV with the same undersampling factor.
Conclusions
We demonstrate a simple method for applying golden angle view ordering to anisotropic FOV radial imaging. This can reduce imaging time for objects with anisotropic dimensions while still allowing arbitrary temporal window selection.
Keywords: anisotropic FOV, golden angle radial imaging, radial imaging, scan efficiency
INTRODUCTION
Radial sampling techniques have been used extensively in medical imaging since the invention of computed tomography (CT) (1). It was also used in the first magnetic resonance imaging (MRI) experiment (2) and remains popular in the MRI community. Radial MRI supports ultra-short echo times (3) and is known to be robust to flow (4) and motion (5). It also provides a diffuse aliasing pattern (5) and therefore less sensitive to undersampling. Although Cartesian sampling dominates most clinical MRI today, radial trajectories are still preferred in many applications, including dynamic imaging, due to these favorable properties.
Standard implementations of radial imaging do not support anisotropic field-of-view (FOV), which leads to sampling redundancy and unnecessary scan time when the object being imaged has anisotropic in-plane dimensions (abdomen, spine, etc.). This problem was addressed by Larson et al., who proposed a method of designing fully sampled radial trajectories with variable densities matched to the anisotropic FOV (6). However, this method alone cannot be applied with golden angle (GA) view ordering, which was first applied in MRI by Winkelmann et. al (7), and has become an important acquisition scheme for dynamic imaging applications. GA sampling has the important feature of nearly uniform radial spoke distribution for any arbitrary temporal window. The temporal window size can therefore be retrospectively selected. Prior knowledge of the expected motion dynamics and requisite temporal resolution has become less critical.
Since radial MRI is particularly useful in dynamic applications, the work of this paper is to extend Larson’s method and provide anisotropic FOV support for GA radial imaging. The conventional GA sampling is modified to follow the desired spoke density for any predetermined FOV shape instead of a uniform distribution, which provides a circular FOV. We used elliptical FOVs for demonstration; however, the approach is compatible with any arbitrary convex FOV.
THEORY
In radial MRI, when a convex FOV is desired, it can be expressed as a function of the azimuthal angle . Since the density of spokes (6), an efficient GA sampling scheme should maintain f(θ) in physical k-space corresponding to the given FOV shape, for any arbitrary temporal window. Here f(θ) is in general not constant, and can be determined by the FOV shape. Now consider an angle-normalized space where the angles θ′ ∈ [0,1). In this space, the angle of the ith spoke is sampled by the conventional GA scheme:
| [1] |
This leads to an approximately uniform distribution of the spokes in the θ′ space, i.e. , and therefore nearly isotropic FOV for arbitrary temporal windows. The problem now becomes to find a parametric mapping such that . can then be used to transform θ′ back to the physical k-space to get the angle in real acquisition θ[i]. Based on the inverse transform sampling (8): if θ′ is uniformly distributed on [0,1), then follows distribution F, where F is the cumulative distribution function of θ. Therefore, is exactly the inverse cumulative distribution function: . is in general difficult to calculate analytically (see Appendix), and may be solved numerically by approximating F−1(θ′) with a function easier to compute.
METHODS
Without loss of generality, we consider an elliptical FOV with isotropic spatial resolution as an example. Since F−1(θ′) is very complex for elliptical FOVs, a practical interpolation approach is used here without explicitly calculating F−1(θ′). This interpolation approach can also be extended to any convex FOV shape. As illustrated in Figure 1a, first, the fully sampled radial trajectory was computed for the desired elliptical FOV using the Larson method (6), based on
| [2] |
where the angles of the spokes are noted as , , and are the angle increments. N is the total number of spokes. Further fine adjustments were performed to improve trajectory symmetry, as described in detail in (6). Second, the index for the ith GA spoke in the physical k-space was normalized to have the same range as the fully sampled spokes, by multiplying θ′ by N:
| [3] |
Next, the fully sampled trajectory calculated previously, as described by θfull (yellow dots in Figure 2b), can be used to generate a continuous mapping function between the index [0 N) and θ by any interpolation method. In the simplest form of linear interpolation (blue curve), θ[i] for the ith GA spoke is computed by
| [4] |
where A[i], D[i] are the integer and decimal part of respectively, i.e., , .
FIG. 1.
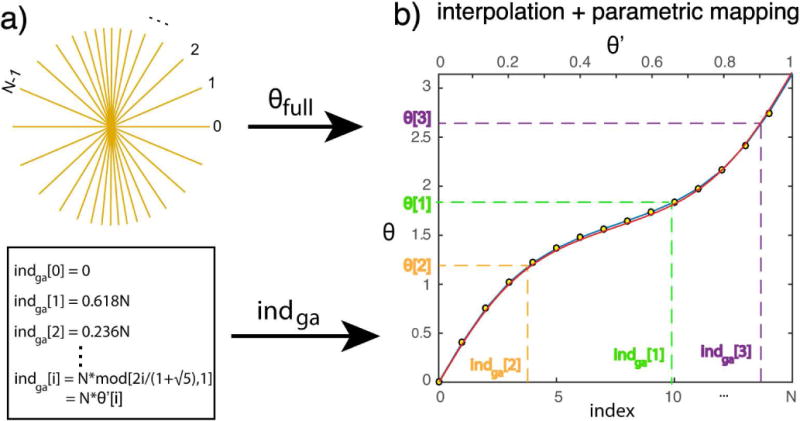
Generation of golden angle radial trajectory for anisotropic FOV. a). A fully sampled radial trajectory, indexed by [0, N), is first determined for the desired FOV. The index of the ith GA spoke indga[i] is also calculated. b) The fully sampled trajectory from a) can be described by θfull (yellow dots) and used to generate a continuous mapping function between the index and θ by any interpolation method. Piecewise linear interpolation is used here (blue curve). θ[i] can be determined based on the curve. This approach is equivalent to finding T{θ′} by finding an approximation of F−1(θ′) that is easier to compute. In the case of piecewise linear interpolation, it is the same as generating a piecewise linear approximation of F−1(θ′). The range of θ′ is [0,1), which corresponds to the index range [0 N). The numerically computed optimal F−1(θ′) is also plotted (red curve) for comparison. A small FOV (X:Y = 25:5 pixels, resulting in N = 15) is purposely chosen in the figure for better visualization.
FIG. 2.
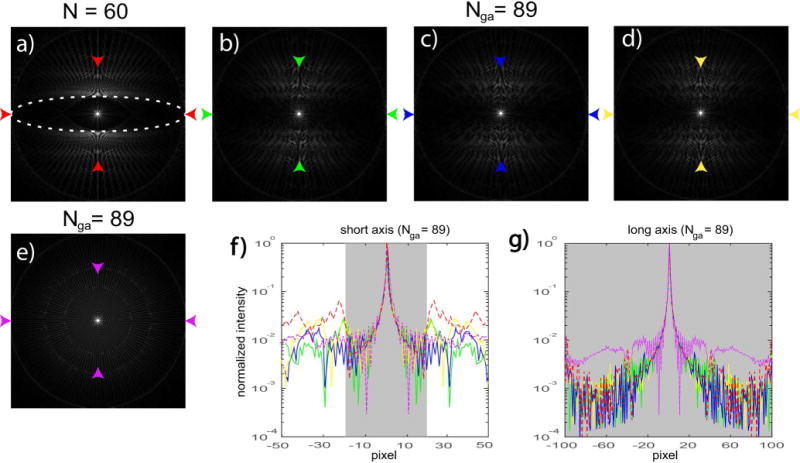
PSFs of for an elliptical FOV (X:Y = 100:20 pixels). a) fully sampled radial sampling using the Larson method (N = 60). White dash line represents the desired FOV. b)–d) 3 consecutive temporal frames using the modified GA sampling, with spoke per frame equal to the next Fibonacci number 89. e) one temporal frame using conventional GA sampling, also with 89 spokes. f)–g) plot of the major and minor axes of the PSFs between the arrows, with colors corresponding to b)–e) respectively. The fully sampled plots in a) are also shown for comparison (red dash lines). Shaded areas represent the desired FOVs.
This practical interpolation approach is in fact equivalent to finding T{θ′} by finding an approximation of F−1(θ′) that is easier to compute. In the case of piecewise linear interpolation (Figure 2b), it is the same as generating a piecewise linear approximation of F−1(θ′) (blue curve), based on which θ[i] can be determined from its corresponding . The numerically computed optimal F−1(θ′) is also plotted (red curve) for comparison.
One elliptical FOV (major:minor axis = 100:20 pixels) was generated using the approach above and used as an example to perform further analysis. The point-spread-functions (PSF) of the proposed sampling schemes were generated to analyze the main lobe and side lobes inside the desired FOV. The normalized spoke density histograms for different temporal window lengths and across different temporal windows were also compared to the optimal density distribution .
The proposed sampling scheme was implemented on a 3T Signa HDxt scanner (GE Heathcare, Milwaukee, WI). Phantom images were acquired and compared against conventional GA sampling as well as the Larson’s method. It was also implemented on a 1.5T Magnetom Avanto scanner (Siemens Healthcare, Erlangen, Germany). In vivo horizontal long-axis cardiac images were acquired using a real-time radial GRE sequence in one healthy volunteer. The proposed method with elliptical and rectangular FOV with major-to-minor-axis ratio 1:0.4 were compared with conventional GA sampling. Imaging parameters: FOV 320 mm × 320 mm (conventional GA) or 320 mm × 128 mm (elliptical/rectangular), 480 samples per readout, flip angle 85°, TE/TR 1.5/3.75 ms, acquisition time 128 ms (34 spokes) or 206 ms (55 spokes) per frame.
The sampling pattern generation and the reconstruction were also implemented in MATLAB (Mathworks, Natick, MA) and can be downloaded at http://mrel.usc.edu/share.html. All images were reconstructed using the gridding algorithm (9), with sampling density compensation factor calculated by the Voronoi approach (10).
To quantify the benefit of elliptical FOV imaging, the number of spokes required were compared between the fully sampled circular FOV trajectories and elliptical FOV trajectories with different major-to-minor-axis ratios. This comparison was also used for the same undersampling factor in both cases.
RESULTS
Figure 2 & 3 contain representative results for an elliptical FOV (major : minor axis = 100:20 pixels). Figure 2a contains the PSF of the fully sampled radial trajectory using the Larson method (60 spokes). Figure 2b–d contain PSFs using the proposed GA trajectories. Three consecutive temporal frames with spokes equal to the next Fibonacci number (Nga = 89) are shown. One temporal frame of conventional GA sampling with 89 spokes is also shown in Figure 2e. The desired FOV is plotted on top (white dash lines). Figure 2f–g plot the major and minor axes of the PSFs between the arrows, with colors that correspond to b–e, respectively. The fully sampled plots in a) are also shown for comparison (red dash lines). Shaded areas represent the desired FOVs. While small residual side lobes still exist inside the desired FOV using the proposed method, they are at least ~100× smaller when the spoke number is increased to the next Fibonacci number. Also note these side lobes are incoherent at different temporal frames. Conventional GA sampling produces significantly larger side lobes along the major axis.
FIG. 3.
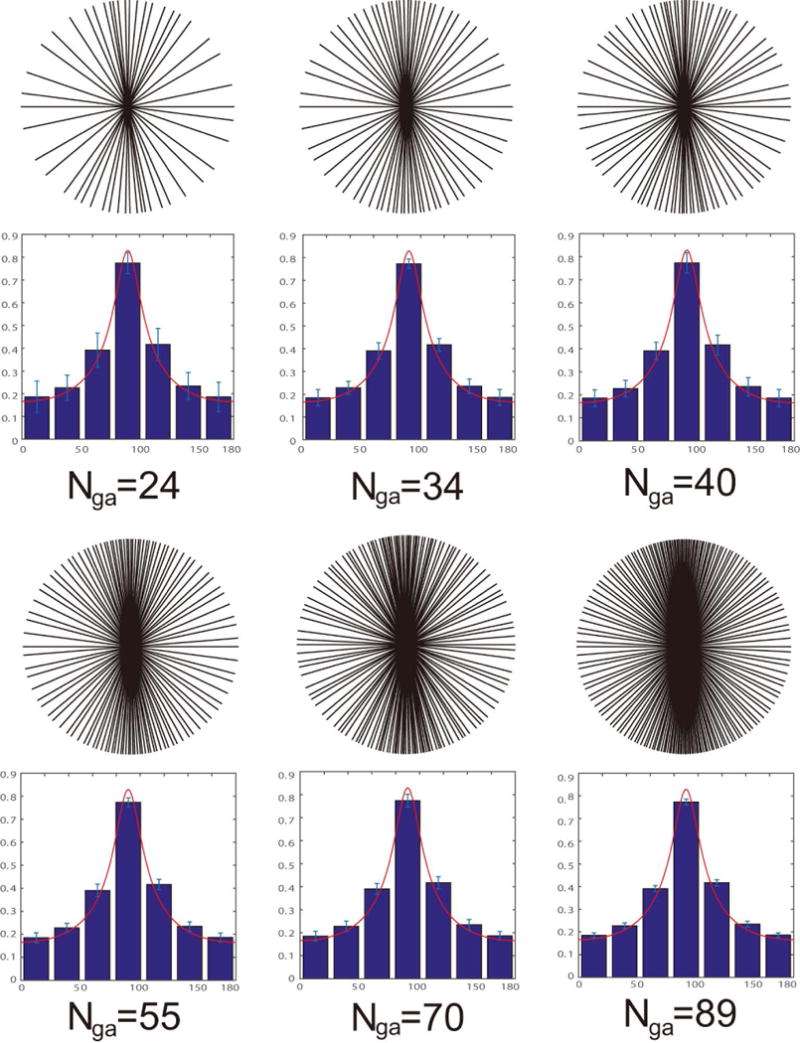
Sampling patterns using the proposed method. The same elliptical FOV ratio (100:20) in Figure 2 is used. One temporal frame is shown for each temporal width (number of spokes). The corresponding normalized spoke density histogram is averaged over 100 frames and listed below. Error bars for each bin represent plus or minus one standard deviation. The optimal spoke density distribution is also plotted (red line).
Figure 3 compares the sampling patterns using the proposed method with different spoke numbers. Both Fibonacci {34, 55, 89} and non-Fibonacci {24, 40, 70} numbers are shown. The FOV ratio is identical to what is used in Figure 2. The corresponding normalized spoke density histogram is averaged over 100 frames. Error bars represent plus or minus one standard deviations within each bin. The red line represents the optimal spoke density distribution for this FOV, i.e.:
| [5] |
where a and b are the major and minor axes of the elliptical FOV in pixel units (100, 20 in this example). The normalized density histograms indicate that the spoke distributions are very stable for different temporal window length, and across different temporal frames. They always follow the optimal densities .
Figure 4 contains images of a ball phantom and an ultra-fine resolution phantom placed side by side and acquired using different methods for comparison. All images have 400 × 120 pixels with 0.75mm isotropic resolution. Figure 4a,c were acquired using conventional GA, Figure 4b,d were acquired with the proposed GA for elliptical FOV, Figure 4e was acquired with Larson’s method satisfying Nyquist rate. The number of spokes used in Figure 4a–e were 144, 144, 315, 315, and 315 respectively. The proposed GA sampling satisfying the Nyquist rate (N = 377) is also listed in Figure 4f. The unaliased FOV shapes are plotted in white dashed lines for each sampling scheme. The enlarged regions within the white rectangle are also shown to better illustrate streaking artifacts. The strong streaking artifacts that exist in Figure 4a,c are significantly reduced with the proposed sampling in Figure 4b,d without increasing the number of samples. When Nyquist sampling rate is met, the streaking artifacts are further reduced inside the FOV (Figure 4f) and the image quality is comparable to the Larson’s method (Figure 4e).
FIG. 4.
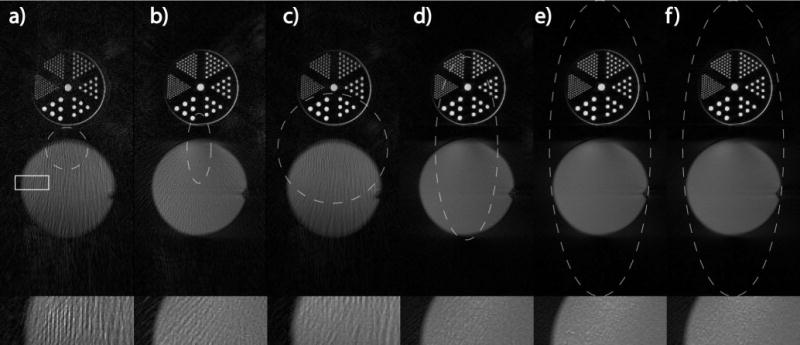
Comparison of phantom images with different FOVs. All images have 0.75 mm isotropic resolution, 400 × 120 pixels. a) & c) Conventional GA sampling, b) & d) proposed GA sampling for elliptical FOV. a)-b) both use 144 spokes; c)–d) both use 315 spokes. Note the significantly reduced streaking artifacts in b) & d). e) Larson’s method satisfying Nyquist rate (315 spokes). f) Proposed GA sampling satisfying Nyquist rate (377 spokes), the image quality is comparable to e). The unaliased FOV shapes are also shown (white dashed lines) for each sampling scheme. One region (white rectangle) is enlarged in the bottom row to better illustrate streaking artifacts due to undersampling.
Figure 5 compares real-time horizontal long-axis-view cardiac images with different sampling schemes. The top row shows one diastolic frame with 34 spokes reconstructed with gridding using conventional GA, proposed GA with rectangular and elliptical FOV (major-to-minor-axis ratio 1:0.4) sampling respectively. The unaliased FOV shapes are plotted in white dashed lines for each sampling scheme. The enlarged region of interest, together with another systolic frame are shown. The bottom rows show two frames from the same acquisition reconstructed with 55 spokes. Excess streaking artifacts can be observed in all conventional GA cases (white arrows).
FIG. 5.
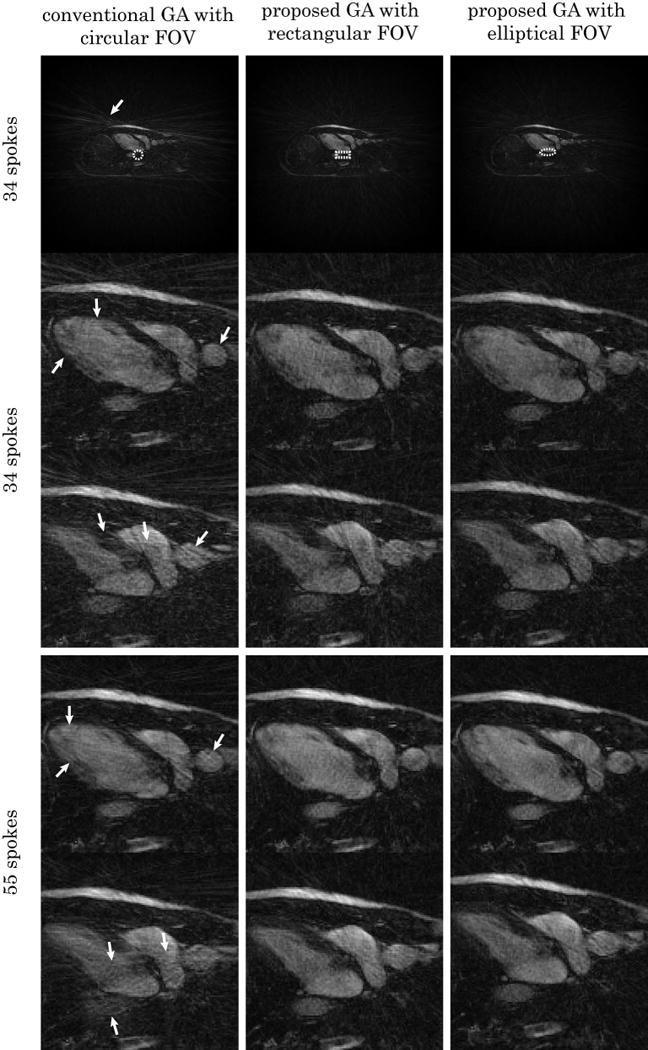
Comparison of horizontal long-axis cardiac images with different FOV shapes. Real-time acquisition with breath-hold were used for all images. Top: diastolic frame with 34 spokes reconstructed with gridding using conventional GA, proposed GA with rectangular and elliptical FOV (major-to-minor-axis ratio 1:0.4) sampling respectively. The unaliased FOV shapes are shown (white dashed contour) for each sampling scheme. The enlarged region of interest, together with another systolic frame are also shown. Bottom: two frames from the same acquisition reconstructed with 55 spokes. The conventional GA cases contain a visibly larger amount of streaking artifact due to undersampling (white arrows).
Supporting Figure S1 plots the percentage of data needed for the elliptical FOV when compared to the circular FOV radial sampling with the same acceleration factor, as a function of the major-to-minor-axis ratio. In the example provided in Figure 4 where the ratio is 0.3, it corresponds to a 50% reduction in scan time.
DISCUSSION
Figures 2–3 indicate that the proposed method is able to achieve anisotropic FOV support using a GA sampling scheme. When the same number of spokes as the fully sampled trajectory are used, the PSFs will exhibit minor side lobes inside the desired FOV, due to the nature of imperfect uniform distribution of GA spokes, especially when the number of spokes per frame is small and/or not a Fibonacci number. In applications where undersampling is not desired, the maximum azimuthal gap for conventional GA has been calculated in (7):
| [6] |
where , and is the Fibonacci number for k > 0. For elliptical FOV, this can be directly applied in the angle-normalized θ′ space to choose the spoke number that satisfies
| [7] |
to avoid undersampling, where N is the spoke number for the fully sampled trajectory determined by the Larson method. In our example (Figure 2), this results in Nga = 89, which leads to significant aliasing reduction. The remaining low-level aliasing inside the FOV is likely due to 1) imperfect parametric mapping when piecewise linear interpolation is used; and 2) the finite width of aliasing lobes is not accounted for in the Larson method, as discussed in detail in (6). Note that aliasing was insignificant (at least ~100× lower than the main lobe in the provided example) and should be negligible for most clinical applications.
When Nyquist sampling is not required, as in most of the dynamic GA applications, the proposed method nicely combines the benefits of anisotropic FOV and the GA sampling scheme. Figure 2f–g indicates that the PSFs of the proposed trajectories are stable (main lobe) and incoherent (side lobes) over time. This is desired for undersampled dynamic imaging, as it is intrinsically compatible with compressed sensing reconstruction (11). Figure 3 demonstrates that the modified GA sampling is able to maintain the desired spoke distribution for anisotropic FOV for arbitrary window sizes. Similar to conventional GA, optimal results can be obtained when a Fibonacci number is used for the window size.
Figure 4 shows that the proposed method can significantly reduce streaking artifacts for the same acquisition time when compared to conventional GA. It can also achieve comparable image quality as Larson’s method when Nyquist sampling is satisfied.
In vivo results also confirm that less streaking can be observed with the proposed method after gridding (Figure 5). Because less aliasing needs to be resolved compared to conventional GA sampling, a higher acceleration factor can be expected after combining with parallel imaging and/or constrained reconstruction. Also notice that while both have better perfomance than conventional GA sampling, the differences between elliptical and rectangular FOV samplings are difficult to detect. This implies that the proposed method is insensitive to small differences in the FOV shape when heavy undersampling is used.
The benefit of anisotropic FOV radial imaging increases with FOV asymmetry. For elliptical FOV, it can be expressed as a function of the major-to-minor-axis ratio, as plotted in supporting Figure S1. The gain could be most significant in applications such as dynamic contrast-enhanced spine or leg imaging where the major-to-minor-axis ratio can be 1:0.3 or higher. In these applications, time-intensity curves of properties like blood or bone marrow perfusion are often measured (12–14) but the optimal trade-offs between the temporal resolution and SNR for accurate measurements are difficult to know in advance. The proposed method not only makes radial sampling much more efficient but also makes such prior knowledge less critical. The optimal temporal resolution can be determined retrospectively. Even in the case of cardiac or abdominal imaging where the ratio is about 1:0.5, a 33% scan time reduction can still be achieved. This is particularly useful for real-time applications where the acquisition window is short and underdamping is inevitable (15,16).
The piecewise linear interpolation approach should be able to serve as a good approximation for FOV ranges in most clinical applications. In our experience, only in the cases of extremely small and asymmetric FOV (in pixel units), where N < 10 for fully sampled radial trajectory and X/Y > 5, did the R2 value between the optimal and approximated F−1(θ) drop below 0.99. In such cases, a higher order spline interpolation can be used. Alternatively, piecewise linear interpolation can always be applied on a larger FOV with the same shape, so that f(θ) does not change.
The proposed method is also compatible with any other sampling scheme that targets uniform spoke density distribution besides golden angle. One example is the recent work on “small golden angles” by Wundrak et. al (17), in which a set of azimuthal angle increments smaller than the golden angle were found to give nearly uniform spoke distributions as long as certain minimum number of spokes are used. This is particular useful to reduce eddy currents in balanced-SSFP radial MRI.
Recently the combination of parallel imaging, constrained reconstruction, and conventional GA sampling has become increasingly popular to push the limit of accelerating MRI (15,16,18). The proposed method can be easily incorporated into these frameworks and substitute the convention GA sampling to further reduce scan time, should they be applied to noncircular FOV imaging. It also requires very light calculations, which can be computed on-the-fly to allow interactive modifications of plane orientation and FOV change.
CONCLUSION
We have demonstrated a simple solution to enable 2D anisotropic FOV support for golden angle radial imaging. This can reduce imaging times in many scenarios (abdomen, spine, etc.) where the object dimensions are anisotropic, while still allowing for retrospective selection of temporal resolution. It can be easily extended to 3D stack-of-stars imaging and combined with other acceleration techniques to further reduce scan time.
Supplementary Material
FIG. S1. The benefit of elliptical FOV imaging increases with FOV asymmetry. The plot shows the percentage of data needed for elliptical FOV when compared to circular FOV radial sampling as a function of the major and minor axes ratio, given the same undersampling factor.
Acknowledgments
NIH R01-HL105210.
APPENDIX
Elliptical FOV
Let a, b be the major and minor axes in pixel units:
| [A1] |
For isotropic resolution, is a constant, therefore
| [A2] |
After normalization (i.e., integral over [0 π) is 1), the normalized spoke density is
| [A3] |
The angle for ith GA spoke is given by , is the cumulative distribution function:
| [A3] |
where , Fellip is the elliptic integral of the first kind, and cannot be calculated analytically. Therefore F−1 cannot be expressed analytically either.
Rectangular FOV
Let a, b be the long and short sides of the rectangle in pixel units, similar to elliptical FOV, the normalized spoke density is:
| [A4] |
where , , , , . The cumulative distribution function becomes:
| [A5] |
Although F(θ) has a close form solution, F−1 cannot be expressed analytically.
References
- 1.Hounsfield GN. Computerized transverse axial scanning (tomography): Part 1. Description of system. Br J Radiol. 1973;46(552):1016–22. doi: 10.1259/0007-1285-46-552-1016. [DOI] [PubMed] [Google Scholar]
- 2.Lauterbur PC. Image Formation by Induced Local Interactions: Examples Employing Nuclear Magnetic Resonance. Nature. 1973;242(5394):190–1. [PubMed] [Google Scholar]
- 3.Robson MD, Gatehouse PD, Bydder M, Bydder GM. Magnetic resonance: an introduction to ultrashort TE (UTE) imaging. J Comput Assist Tomogr. 2003;27(6):825–46. doi: 10.1097/00004728-200311000-00001. [DOI] [PubMed] [Google Scholar]
- 4.Nishimura DG, Jackson JI, Pauly JM. On the nature and reduction of the displacement artifact in flow images. Magn Reson Med. 1991;22(2):481–92. doi: 10.1002/mrm.1910220255. [DOI] [PubMed] [Google Scholar]
- 5.Glover GH, Pauly JM. Projection reconstruction techniques for reduction of motion effects in MRI. Magn Reson Med Off J Soc Magn Reson Med Soc Magn Reson Med. 1992;28(2):275–89. doi: 10.1002/mrm.1910280209. [DOI] [PubMed] [Google Scholar]
- 6.Larson PEZ, Gurney PT, Nishimura DG. Anisotropic Field-of-Views in Radial Imaging. IEEE Trans Med Imaging. 2008;27(1):47–57. doi: 10.1109/TMI.2007.902799. [DOI] [PubMed] [Google Scholar]
- 7.Winkelmann S, Schaeffter T, Koehler T, Eggers H, Doessel O. An Optimal Radial Profile Order Based on the Golden Ratio for Time-Resolved MRI. IEEE Trans Med Imaging. 2007;26(1):68–76. doi: 10.1109/TMI.2006.885337. [DOI] [PubMed] [Google Scholar]
- 8.Devroye L. Non-uniform random variate generation. Springer-Verlag; 1986. p. p28. [Google Scholar]
- 9.Beatty PJ, Nishimura DG, Pauly JM. Rapid gridding reconstruction with a minimal oversampling ratio. IEEE Trans Med Imaging. 2005;24(6):799–808. doi: 10.1109/TMI.2005.848376. [DOI] [PubMed] [Google Scholar]
- 10.Rasche V, Proksa R, Sinkus R, Bornert P, Eggers H. Resampling of data between arbitrary grids using convolution interpolation. IEEE Trans Med Imaging. 1999;18(5):385–92. doi: 10.1109/42.774166. [DOI] [PubMed] [Google Scholar]
- 11.Lustig M, Donoho D, Pauly JM. Sparse MRI: The application of compressed sensing for rapid MR imaging. Magn Reson Med. 2007;58(6):1182–95. doi: 10.1002/mrm.21391. [DOI] [PubMed] [Google Scholar]
- 12.Griffith JF, Yeung DKW, Antonio GE, Lee FKH, Hong AWL, Wong SYS, et al. Vertebral Bone Mineral Density, Marrow Perfusion, and Fat Content in Healthy Men and Men with Osteoporosis: Dynamic Contrast-enhanced MR Imaging and MR Spectroscopy. Radiology. 2005;236(3):945–51. doi: 10.1148/radiol.2363041425. [DOI] [PubMed] [Google Scholar]
- 13.Chen W-T, Shih TT-F, Chen R-C, Lo H-Y, Chou C-T, Lee J-M, et al. Blood perfusion of vertebral lesions evaluated with gadolinium-enhanced dynamic MRI: In comparison with compression fracture and metastasis. J Magn Reson Imaging. 2002;15(3):308–14. doi: 10.1002/jmri.10063. [DOI] [PubMed] [Google Scholar]
- 14.Biffar A, Schmidt GP, Sourbron S, D’Anastasi M, Dietrich O, Notohamiprodjo M, et al. Quantitative analysis of vertebral bone marrow perfusion using dynamic contrast-enhanced MRI: Initial results in osteoporotic patients with acute vertebral fracture. J Magn Reson Imaging. 2011;33(3):676–83. doi: 10.1002/jmri.22497. [DOI] [PubMed] [Google Scholar]
- 15.Feng L, Grimm R, Block KT, Chandarana H, Kim S, Xu J, et al. Golden-angle radial sparse parallel MRI: Combination of compressed sensing, parallel imaging, and golden-angle radial sampling for fast and flexible dynamic volumetric MRI. Magn Reson Med. 2014;72(3):707–17. doi: 10.1002/mrm.24980. [DOI] [PMC free article] [PubMed] [Google Scholar]
- 16.Chandarana H, Feng L, Block TK, Rosenkrantz AB, Lim RP, Babb JS, et al. Free-Breathing Contrast-Enhanced Multiphase MRI of the Liver Using a Combination of Compressed Sensing, Parallel Imaging, and Golden-Angle Radial Sampling. Invest Radiol. 2013;48(1) doi: 10.1097/RLI.0b013e318271869c. [DOI] [PMC free article] [PubMed] [Google Scholar]
- 17.Wundrak S, Paul J, Ulrici J, Hell E, Rasche V. A Small Surrogate for the Golden Angle in Time-Resolved Radial MRI Based on Generalized Fibonacci Sequences. IEEE Trans Med Imaging. 2014;34(6):1262–69. doi: 10.1109/TMI.2014.2382572. [DOI] [PubMed] [Google Scholar]
- 18.Coppo S, Piccini D, Bonanno G, Chaptinel J, Vincenti G, Feliciano H, et al. Free-running 4D whole-heart self-navigated golden angle MRI: Initial results. Magn Reson Med. doi: 10.1002/mrm.25523. [DOI] [PubMed] [Google Scholar]
Associated Data
This section collects any data citations, data availability statements, or supplementary materials included in this article.
Supplementary Materials
FIG. S1. The benefit of elliptical FOV imaging increases with FOV asymmetry. The plot shows the percentage of data needed for elliptical FOV when compared to circular FOV radial sampling as a function of the major and minor axes ratio, given the same undersampling factor.


