

Abstract
Background and Purpose
We hypothesized that concentrations of interleukin 6 (IL6), serum amyloid A (SAA), tumor necrosis factor alpha receptor 1 (TNFR1), CD40 ligand (CD40L), and monocyte chemoattractant protein 1 (MCP1) would predict recurrent ischemic stroke and major vascular events after recent lacunar stroke.
Methods
Levels of Inflammatory Markers in the Treatment of Stroke (LIMITS) was an international, multicenter, prospective ancillary biomarker study nested within the Secondary Prevention of Small Subcortical Strokes (SPS3) study, a Phase III trial in patients with recent lacunar stroke. Crude and Adjusted Cox proportional hazards models were used to calculate hazard ratios and 95% confidence intervals (HR, 95% CI) for recurrence risks.
Results
Among 1244 lacunar stroke patients (mean age 63.3 ± 10.8 years), there were 115 major vascular events (stroke, myocardial infarction, vascular death). The risk of major vascular events increased with elevated concentrations of both TNFR1 (adjusted HR per standard deviation [SD] 1.21, 95% CI 1.05-1.41, p=0.01) and IL6 (adjusted HR per SD 1.10, 95% CI 1.02-1.19, p=0.008). Compared with the bottom quartile (TNFR1<2.24 ng/L), those in the top quartile of TNFR1 (>3.63 ng/L) were at twice the risk of major vascular events after adjusting for demographics (partially adjusted HR 1.98, 95% CI 1.11-3.52), though the effect attenuated after adjusting for other risk factors and statin use (adjusted HR 1.68, 95% CI 0.93-3.04). SAA, CD40L, and MCP1 were not associated with prognosis.
Conclusions
Among recent lacunar stroke patients, IL6 and TNF receptor concentrations predict risk of recurrent vascular events, and are associated with the effect of antiplatelet therapies.
Keywords: Ischemic Stroke, Inflammation, Lacunar Stroke, Recurrent Event
Introduction
Lacunar strokes have high disability rates and are the leading cause of vascular dementia.1-6 The causes of lacunar strokes are believed to be lipohyalinosis and microatheromas in the small cerebral vessels.7-9 The risk factors that have been identified for ischemic stroke do not account for a considerable number of stroke cases, thereby increasing the importance of identifying novel risk factors for stroke.10 Moreover, little is known about secondary prevention after a lacunar stroke despite the frequency and burden of lacunar strokes.
Recent evidence suggests that inflammatory mechanisms may be involved in causing lacunar stroke, but there is limited data from large, multicenter studies regarding the role of inflammatory biomarkers in prognosis after lacunar stroke. Previous studies analyzed the predictive role of inflammatory markers in acute lacunar and non-lacunar subtype ischemic strokes and found a relationship between inflammatory markers and recurrent cerebrovascular events.11, 12 A polymorphism of the interleukin-6 (IL-6) gene has been associated with increased inflammation and was identified as an independent risk factor for lacunar stroke.13 The Women's Health Study (WHS) identified IL-6 and serum amyloid A (SAA) as predictors of incident stroke, and found that tumor necrosis factor (TNF)-α levels were associated with poor outcome after a stroke.14, 15
A prospective, observational study was conducted to test the hypothesis that inflammatory biomarkers are associated with stroke recurrence after lacunar stroke. The Levels of Inflammatory Markers in the Treatment of Stroke study (LIMITS) was nested within the Secondary Prevention of Small Subcortical Stroke (SPS3) trial, the results of which have been published.16, 17 In LIMITS, high sensitivity C-reactive protein (hsCRP) levels were identified as a risk factor for recurrent stroke and vascular events following a lacunar stroke.18 In the present analysis, we aimed to investigate whether several other inflammatory biomarkers representing innate and adaptive immunity are independent risk factors for prognosis after lacunar stroke, before and after adjusting for potential confounders.
Methods
The methodology for LIMITS, an ancillary study to the SPS3 trial, has been described in detail previously. 19, 20 SPS3 was a multicenter, investigator-initiated, NIH/NINDS-funded Phase III trial of the secondary prevention of stroke recurrence after a small vessel ischemic stroke. The ancillary study, LIMITS, involved the collection of plasma and serum samples at baseline and at one-year (up to 18 months) follow-up during the study. The plasma and serum samples were stored and analyzed for inflammatory marker levels. The blood samples were drawn at least 3 weeks after the primary stroke event occurred.
Inclusion and Exclusion Criteria
This ancillary study included patients enrolled into the SPS3 trial at sites participating in LIMITS with all patients eligible for SPS3 eligible for LIMITS (45 sites (54% of the SPS3 sites)). Patients were eligible if they had a clinical diagnosis of MRI-proven lacunar stroke in the absence of a cortical or large subcortical stroke, carotid stenosis or cardioembolic source. LIMITS was approved by the Columbia University Medical Center IRB and by IRBs at all participating sites, with written informed consent obtained from all study participants.
Blood Collection Kits, Phlebotomy, and Local Processing
Participating sites were provided with materials for collection and shipping of blood specimens including a 10 cc blood sample in ethylenediaminetetraacetic acid (EDTA) and a 9.5 ml gel serum separator tube. The samples were drawn on the day of randomization, but prior to the initiation of antiplatelet therapy. Samples were centrifuged on site and samples were aliquotted and frozen locally before being shipped to the central lab at Columbia University. Plasma samples were analyzed in batches blinded to treatment and outcome.
Outcomes
The co-primary outcomes of this analysis were recurrent ischemic stroke and a major cardiovascular event (recurrent ischemic stroke, myocardial infarction, or vascular death). Ischemic strokes were defined as a clinical syndrome of rapidly developing symptoms or signs of focal loss of cerebral function with symptoms lasting more than 24 h and no apparent cause other than the ischemic vascular origin. 19, 20 The definition of other vascular events was previously described in the SPS3 trial reports.1, 21 Additional analyses were performed for the outcome of ischemic or hemorrhagic stroke. Hemorrhagic strokes were defined as neurologic deficits associated with intraparenchymal or subarachnoid hemorrhagic lesions confirmed by CT, MRI, or autopsy.
Statistical Analysis and Sample Size Calculations
Descriptive statistics were calculated for patients in the ancillary LIMITS study, and levels of inflammatory biomarkers were compared across different patient characteristics. ANOVA was used to determine if there were differences in marker categories for continuous variables, a Chi-Square test for nominal categorical variables, and Cochran-Mantel-Haenszel (CMH) when categorical variables were ordinal.
For the analyses of primary outcomes, biomarker values at baseline were considered the independent variable of primary interest. Levels of the biomarkers were log-transformed to stabilize the variance. Cox proportional hazards regression was used to estimate the unadjusted hazard ratio for the biomarkers with time-to-event for ischemic stroke as the dependent variable. Multivariable Cox proportional hazards regression was then used to estimate the adjusted hazard ratio for biomarkers after adjusting for additional potential risk factors, including age, sex, race-ethnicity, region, and traditional stroke risk factors defined either dichotomously (hypertension, cardiac disease, diabetes mellitus, smoking) or continuously (body mass index, HDL, LDL). Because statin therapy may influence the levels of biomarkers as well as outcomes, analyses were further adjusted for statin use. We considered the time until event as our primary outcome, and those who did not have an event were censored at time of the last observed follow-up visit. In addition to the analyses of the biomarkers as continuous variables, additional analyses were conducted using quartiles of the biomarker levels as the independent variable with the lowest quartile the reference group.
A sample size of 1440 (57% of the initial planned total of 2500 patients to be enrolled in SPS3) was chosen based on feasibility, assuming that about 40 enrolling centers would enroll at least 12 patients annually for 3 years. All hypothesis tests performed during the analysis of the primary and secondary endpoints are two-sided and use an alpha of 0.05.
Results
Distribution of inflammatory markers and characteristics of the cohort
Table 1 provides median biomarker values by characteristics of LIMITS study participants. There were a total of 1016 subjects with IL-6 values collected at baseline. The distribution of sex differed across IL6 quartiles (p<0.01), as did the distributions of smoking (p<0.01; Supplemental Table I). There were a total of 628 subjects with MCP values collected at baseline. The distribution of age differed across MCP1 quartiles (p<0.01), as did the distributions of race (p<0.01) and region (p<0.01; Supplemental Table II).
Table 1. Median Biomarker Levels by Baseline Characteristics of the Entire Sample.
| IL6 | MCP1 | SAA | TNFR1 | CD40L | |
|---|---|---|---|---|---|
| Characteristic | Median (IQR) | Median (IQR) | Median (IQR) | Median (IQR) | Median (IQR) |
| Age | |||||
| <50 | 1.8 (1.4-3.4) | 193.4 (135.8-257.5) | 5.2 (2.9-8.1) | 2.5 (2.0-3.2) | 5.1 (2.3-8.1) |
| 50-65 | 2.4 (1.6-3.7) | 223.6 (158.0-302.7) | 5.1 (2.8-9.6) | 2.8 (2.2-3.5) | 5.3 (2.3-8.3) |
| >65-75 | 2.2 (1.6-3.6) | 243.6 (181.0-311.9) | 4.3 (2.4-8.2) | 2.9 (2.3-3.7) | 6.1 (2.8-9.1) |
| >75 | 2.5 (1.7-3.5) | 233.5 (182.2-311.5) | 5.0 (3.1-8.8) | 3.2 (2.5-4.1) | 5.7 (3.4-8.3) |
| Gender | |||||
| Male | 2.2 (1.5-3.5) | 230.2 (171.0-302.6) | 4.5 (2.4-8.0) | 2.8 (2.2-3.5) | 5.4 (2.5-8.3) |
| Female | 2.5 (1.6-3.9) | 217.8 (156.0-292.2) | 5.8 (3.3-10.6) | 3.0 (2.3-3.8) | 5.7 (2.7-8.6) |
| Race | |||||
| Hispanic | 2.5 (1.6-3.9) | 232.8 (182.6-299.8) | 4.4 (2.5-8.4) | 2.8 (2.2-3.5) | 7.6 (4.7-10.8) |
| Non-Hispanic White | 2.2 (1.5-3.4) | 240.6 (186.0-317.6) | 5.1 (2.8-8.6) | 2.9 (2.3-3.7) | 4.9 (2.4-7.8) |
| Black | 2.2 (1.6-4.0) | 157.3 (111.9-257.2) | 5.7 (2.8-11.0) | 2.9 (2.3-3.8) | 3.5 (1.8-6.7) |
| Other | 2.6 (1.6-3.2) | 212.0 (166.5-288.9) | 3.7 (2.9-8.7) | 2.7 (2.2-2.8) | 3.7 (2.2-4.9) |
| Region | |||||
| United States | 2.3 (1.5-3.5) | 214.8 (146.2-291.9) | 5.3 (3.1-9.4) | 2.9 (2.3-3.7) | 4.7 (2.1-7.4) |
| Canada | 2.2 (1.5-3.4) | 198.9 (153.4-257.7) | 4.8 (2.9-7.1) | 2.6 (2.1-3.1) | 4.7 (1.5-7.6) |
| Latin America | 2.6 (1.7-4.0) | 243.9 (192.0-294.0) | 4.3 (2.4-8.1) | 2.8 (2.2-3.4) | 8.3 (6.1-11.5) |
| Spain | 2.1 (1.4-3.3) | 270.1 (207.0-331.6) | 4.6 (2.4-8.8) | 2.9 (2.3-3.7) | 5.3 (2.5-8.1) |
| Hypertension | |||||
| Yes | 2.3 (1.6-3.7) | 226.5 (157.7-300.2) | 5.1 (2.8-9.1) | 2.9 (2.3-3.7) | 5.4 (2.5-8.3) |
| No | 2.0 (1.4-3.2) | 226.6 (194.8-317.5) | 4.2 (2.5-7.8) | 2.6 (2.1-3.2) | 7.0 (3.6-10.1) |
| Smoking | |||||
| Never | 2.2 (1.5-3.6) | 223.6 (161.4-299.2) | 5.1 (2.9-8.9) | 2.8 (2.2-3.6) | 6.0 (3.0-8.9) |
| Former | 2.2 (1.5-3.4) | 226.6 (165.5-311.9) | 4.4 (2.5-8.7) | 2.9 (2.3-3.6) | 5.2 (2.3-7.9) |
| Current | 2.5 (1.7-4.2) | 231.4 (168.8-288.8) | 5.5 (3.1-9.4) | 2.8 (2.2-3.8) | 5.4 (2.4-8.9) |
| Ischemic Disease | |||||
| Yes | 2.4 (1.7-3.6) | 215.2 (179.6-326.0) | 5.3 (3.0-9.1) | 2.9 (2.4-3.6) | 3.8 (1.8-6.3) |
| No | 2.3 (1.6-3.6) | 227.8 (161.4-299.2) | 4.9 (2.7-8.9) | 2.8 (2.2-3.6) | 5.8 (2.6-8.6) |
| Diabetes Mellitus | |||||
| Yes | 2.4 (1.7-3.6) | 224.3 (154.3-312.9) | 5.1 (3.1-9.3) | 3.2 (2.5-4.1) | 5.0 (2.2-7.6) |
| No | 2.2 (1.5-3.6) | 227.7 (173.4-298.3) | 4.9 (2.6-8.7) | 2.7 (2.2-3.4) | 5.8 (2.7-9.1) |
There were 1008 subjects with SAA values collected at baseline. The distribution of sex differed across SAA quartiles (p<0.01), as did the distributions of region (p=0.02) and HDL (Supplemental Table III). There were a total of 1017 subjects with TNFR1 values collected at baseline. The distribution of sex differed across TNFR1 quartiles (p<0.01), as did the distributions of age (p<0.01), region (p=0.02), hypertension (p=0.04) and diabetes (p<0.01; Supplemental Table IV).
There were a total of 1015 subjects with CD40L values collected at baseline. The distribution of race differed across CD40L quartiles (p<.01), as did the distributions of region (p<0.01), hypertension (p=0.01), ischemic disease (p<0.01) and diabetes (p<0.01; Supplemental Table V).
IL6 and Recurrent Events
In unadjusted analyses, IL6 was significantly related to the risk of having a recurrent ischemic stroke (adjusted HR per SD 1.1, 95% CI 1.0-1.2, p<0.01; Table 2). After adjusting for age, sex, race and region, co-morbidities and statin use at baseline, the same associations persisted (Table 2). IL6 was also associated with an increase in risk of major vascular events (adjusted HR per SD 1.1, 95% CI 1.02-1.19, p=0.008).
Table 2. Risk of Recurrent Ischemic Stroke, Unadjusted and Adjusted by Potential Confounders.
| Model 1 | Model 2 | Model 3 | Model 4 | |||||
|---|---|---|---|---|---|---|---|---|
| HR (95%) | p | HR (95%) | p | HR (95%) | p | HR (95%) | ||
| IL6 continuous (per SD=11.98) | 1.1 (1.0, 1.2) | 0.007 | 1.1 (1.1, 1.2) | 0.002 | 1.1 (1.0, 1.2) | 0.006 | 1.1 (1.0, 1.2) | 0.015 |
| IL6 | 0.19 | 0.20 | 0.28 | 0.29 | ||||
| Quartile 1 (Referent) | -- | -- | -- | -- | ||||
| Quartile 2 | 0.79[0.39,1.61] | 0.82[0.40,1.66] | 0.85[0.41,1.76] | 0.87[0.42,1.80] | ||||
| Quartile 3 | 1.56[0.85,2.87] | 1.60 [0.86,2.97] | 1.57[0.82,2.98] | 1.59[0.83,3.03] | ||||
| Quartile 4 | 1.07[0.55,2.09] | 1.13[0.58,2.20] | 1.12[0.55,2.25] | 1.16[0.58,2.34] | ||||
| MCP1 continuous (per SD=127.93) | 1.0 (0.79, 1.3) | 0.84 | 1.1 (0.82, 1.4) | 0.58 | 1.0 (0.76, 1.3) | 0.93 | 1.0 (0.78, 1.3) | 0.85 |
| MCP1 | 0.46 | 0.55 | 0.74 | 0.68 | ||||
| Quartile 1 (Referent) | -- | -- | -- | -- | ||||
| Quartile 2 | 0.54[0.24,1.21] | 0.60[0.26,1.38] | 0.65[0.28,1.51] | 0.66[0.28,1.55] | ||||
| Quartile 3 | 0.84[0.42,1.70] | 0.94 [0.44,2.01] | 0.91[0.42,1.99] | 0.98[0.45,2.16] | ||||
| Quartile 4 | 0.99[0.50,1.94] | 1.07[0.52,2.20] | 1.00[0.48,2.12] | 1.10[0.52,2.34] | ||||
| SAA continuous (per SD=22.6) | 1.1 (0.94, 1.2) | 0.28 | 1.1 (0.94, 1.2) | 0.27 | 1.1 (0.94. 1.2) | 0.27 | 1.1 (0.96 1.3) | 0.18 |
| SAA | 0.66 | 0.61 | 0.54 | 0.49 | ||||
| Quartile 1 (Referent) | -- | -- | -- | -- | ||||
| Quartile 2 | 0.83[0.44,1.56] | 0.82[0.43,1.56] | 0.78[0.41,1.51] | 0.76[0.39,1.47] | ||||
| Quartile 3 | 0.73[0.38,1.42] | 0.71 [0.36,1.39] | 0.69[0.34,1.38] | 0.67[0.33,1.34] | ||||
| Quartile 4 | 1.07[0.59,1.94] | 1.07[0.58,1.97] | 1.07[0.57,2.01] | 1.07[0.57,2.00] | ||||
| TNFR1 continuous (per SD=1.46) | 1.2 (1.0, 1.4) | 0.024 | 1.2 (1.0, 1.4) | 0.027 | 1.1 (0.95, 1.4) | 0.17 | 1.2 (0.97, 1.4) | 0.11 |
| TNFR1 | 0.23 | 0.23 | 0.48 | 0.37 | ||||
| Quartile 1 (Referent) | -- | -- | -- | -- | ||||
| Quartile 2 | 0.97[0.46,2.04] | 0.95[0.45,2.00] | 0.87[0.41,1.86] | 0.88[0.41,1.87] | ||||
| Quartile 3 | 1.55[0.80,3.02] | 1.50 [0.77,2.94] | 1.41[0.72,2.78] | 1.51[0.77,2.98] | ||||
| Quartile 4 | 1.67[0.87,3.24] | 1.70[0.87,3.33] | 1.30[0.65,2.61] | 1.35[0.67,2.70] | ||||
| CD40L continuous (per SD=4.39) | 0.99 (0.79, 1.3) | 0.95 | 1.1 (0.84 1.4) | 0.59 | 0.99 (0.77, 1.3) | 0.99 | 0.99 (0.77, 1.3) | 0.94 |
| CD40L | 0.87 | 0.99 | 0.80 | 0.71 | ||||
| Quartile 1 (Referent) | -- | -- | -- | -- | ||||
| Quartile 2 | 1.02[0.55,1.88] | 1.01[0.54,1.86] | 1.14[0.61,2.12] | 1.14[0.61,2.14] | ||||
| Quartile 3 | 0.92[0.50,1.72] | 0.99 [0.52,1.86] | 1.02[0.54,1.93] | 1.08[0.57,2.05] | ||||
| Quartile 4 | 0.78[0.40,1.52] | 0.91[0.46,1.80] | 0.78[0.38,1.62] | 0.75[0.36,1.55] | ||||
- Unadjusted
- Adjusted for Demographics (Age, Sex, Race, Region)
- Adjusted for Demographics (Age, Sex, Race, Region) and Co-morbidities (Hypertension, Smoking, History of Prior Ischemic Stroke, Diabetes, LDL and HDL)
- Adjusted for Demographics (Age, Sex, Race, Region) Co-morbidities (Hypertension, Smoking, History of Prior Ischemic Stroke, Diabetes, Low Density Lipoprotein and High Density Lipoprotein) and Statin use at baseline
There was no interaction between assigned antiplatelet treatment and IL-6, considered as a continuous variable, with regard to any of the outcome events. In categorical analyses, however, there was evidence that the treatment effect of dual antiplatelet therapy depended upon IL6 levels (p for interaction=0.04 for major vascular events). The risk of recurrent events for patients with IL6 levels in Q3 (>2.30 and <3.58 pg/L) was significantly higher than for those with the lowest IL6 level (<1.58 pg/L) in the ASA+clopidogrel treatment group (for ischemic stroke and major CNS hemorrhage HR=2.93, 95% CI 1.15-7.43, p=0.02; for major vascular events HR=3.01,95% CI 1.27-7.12, p=0.01). After adjusting for age, sex, race and region, co-morbidities and statin use, there was no longer a significant association in the categorical analysis (Table 3, 4). IL6 was not related to the risk of recurrent lacunar stroke (Table 5). There was an interaction between antiplatelet treatment assignment and IL6 quartiles; as IL6 quartiles increased, dual antiplatelet therapy became relatively less effective than aspirin alone.
Table 3. Risk of Ischemic Stroke or Central Nervous System Hemorrhage Unadjusted and Adjusted by Potential Confounders.
| Model 1* | Model 2 | Model 3 | Model 4 | |||||
|---|---|---|---|---|---|---|---|---|
| HR (95%) | p | HR (95%) | p | HR (95%) | p | HR (95%) | ||
| IL6 continuous (per SD=11.98) | 1.1 (1.0, 1.2) | 0.010 | 1.1 (1.0, 1.2) | 0.002 | 1.1 (1.0, 1.2) | 0.006 | 1.1 (1.0, 1.2) | 0.014 |
| IL6 | 0.28 | 0.28 | 0.38 | 0.40 | ||||
| Quartile 1 (Referent) | -- | -- | -- | -- | ||||
| Quartile 2 | 0.70 [0.37,1.34] | 0.71[0.37,1.36] | 0.73[0.38,1.41] | 0.74[0.38,1.43] | ||||
| Quartile 3 | 1.29 [0.74,2.26] | 1.31[0.74,2.31] | 1.27[0.71,2.28] | 1.27 [0.71,2.29] | ||||
| Quartile 4 | 1.01[0.56,1.83] | 1.07[0.59,1.94] | 1.08[0.58,2.01] | 1.11[0.60,2.06] | ||||
| MCP1 continuous (per SD=127.93) | 1.1 (0.87, 1.4) | 0.47 | 1.1 (0.89, 1.4) | 0.34 | 1.1 (0.83, 1.4) | 0.27 | 1.1 (0.85, 1.4) | 0.52 |
| MCP1 | 0.37 | 0.42 | 0.52 | 0.45 | ||||
| Quartile 1 (Referent) | -- | -- | -- | -- | ||||
| Quartile 2 | 0.60[0.29,1.25] | 0.61[0.29,1.32] | 0.64[0.30,1.39] | 0.65[0.30,1.42] | ||||
| Quartile 3 | 0.81 [0.41,1.58] | 0.82 [0.40,1.68] | 0.78[0.38,1.64] | 0.84[0.40,1.77] | ||||
| Quartile 4 | 1.11[0.60,2.07] | 1.12[0.58,2.18] | 1.07[0.55,2.12] | 1.18[0.59,2.33] | ||||
| SAA continuous (per SD=22.6) | 1.1 (0.93 1.2) | 0.39 | 1.1 (0.94, 1.2) | 0.34 | 1.1 (0.93, 1.2) | 0.34 | 1.1 (0.95, 1.2) | 0.25 |
| SAA | 0.56 | 0.50 | 0.43 | 0.39 | ||||
| Quartile 1 (Referent) | -- | -- | -- | -- | ||||
| Quartile 2 | 0.71[0.39,1.29] | 0.71[0.39,1.31] | 0.68[0.37,1.26] | 0.67[0.36,1.25] | ||||
| Quartile 3 | 0.75 [0.42,1.36] | 0.76[0.42,1.38] | 0.74[0.40,1.36] | 0.72[0.39,1.34] | ||||
| Quartile 4 | 0.98[0.57,1.70] | 1.05[0.60,1.84] | 1.04[0.59,1.85] | 1.04[0.59,1.85] | ||||
| TNFR1 continuous (per SD=1.46) | 1.2 (1.0, 1.4) | 0.049 | 1.2 (0.99, 1.4) | 0.054 | 1.1 (0.94, 1.3) | 0.21 | 1.1 (0.95, 1.4) | 0.15 |
| TNFR1 | 0.17 | 0.19 | 0.37 | 0.30 | ||||
| Quartile 1 (Referent) | -- | -- | -- | -- | ||||
| Quartile 2 | 0.92[0.46,1.81] | 0.90[0.45,1.78] | 0.83[0.41,1.66] | 0.83[0.41,1.67] | ||||
| Quartile 3 | 1.51 [0.82,2.76] | 1.45[0.79,2.67] | 1.37[0.74,2.54] | 1.43[0.77,2.66] | ||||
| Quartile 4 | 1.61[0.88,2.95] | 1.62[0.87,3.00] | 1.33[0.71,2.50] | 1.36[0.72,2.56] | ||||
| CD40L continuous (per SD=4.39) | 0.99 (0.80, 1.2) | 0.89 | 1.0 (0.83,1.3) | 0.73 | 0.99 (0.78, 1.3) | 0.92 | 0.98 (0.77, 1.2) | 0.86 |
| CD40L | 0.80 | 0.93 | 0.82 | 0.81 | ||||
| Quartile 1 (Referent) | -- | -- | -- | -- | ||||
| Quartile 2 | 1.03[0.58,1.80] | 1.00[0.57,1.76] | 1.10[0.62,1.94] | 1.09[0.61,1.93] | ||||
| Quartile 3 | 0.81 [0.45,1.47] | 0.84[0.46,1.54] | 0.87[0.48,1.60] | 0.91[0.49,1.67] | ||||
| Quartile 4 | 0.82[0.45,1.50] | 0.91[0.49,1.70] | 0.83[0.43,1.59] | 0.80[0.42,1.53] | ||||
- Unadjusted
- Adjusted for Demographics (Age, Sex, Race, Region)
- Adjusted for Demographics (Age, Sex, Race, Region) and Co-morbidities (Hypertension, Smoking, History of Prior Ischemic Stroke, Diabetes, LDL and HDL)
- Adjusted for Demographics (Age, Sex, Race, Region) Co-morbidities (Hypertension, Smoking, History of Prior Ischemic Stroke, Diabetes, Low Density Lipoprotein and High Density Lipoprotein) and Statin use at baseline
Table 4. Risk of Major Vascular Event Unadjusted and Adjusted by Potential Confounders.
| Model 1 | Model 2 | Model 3 | Model 4 | |||||
|---|---|---|---|---|---|---|---|---|
| HR (95%) | p | HR (95%) | p | HR (95%) | p | HR (95%) | p | |
| IL6 continuous (per SD=11.98) | 1.1 (1.0, 1.2) | 0.01 | 1.1 (1.0, 1.2) | 0.003 | 1.1 (1.0, 1.2) | 0.008 | 1.1 (1.0, 1.2) | 0.017 |
| IL6 | 0.23 | 0.21 | 0.33 | 0.32 | ||||
| Quartile 1 (Referent) | -- | -- | -- | -- | ||||
| Quartile 2 | 1.23[0.72,2.08] | 0.79[0.43,1.46] | 0.81[0.43,1.50] | 0.82[0.44,1.53] | ||||
| Quartile 3 | 1.03[0.60,1.78] | 1.37[0.80,2.37] | 1.32[0.75,2.31] | 1.33[0.76,2.33] | ||||
| Quartile 4 | 0.88[0.50,1.57] | 1.32[0.76,2.30] | 1.27[0.72,2.27] | 1.32[0.74,2.34] | ||||
| MCP1 continuous (per SD=127.93) | 1.1 (0.89, 1.3) | 0.42 | 1.1 (0.92, 1.4) | 0.23 | 1.1 (0.88, 1.4) | 0.64 | 1.1 (0.89 1.3) | 0.79 |
| MCP1 | 0.347 | 0.56 | 0.55 | 0.47 | ||||
| Quartile 1 (Referent) | -- | -- | -- | -- | ||||
| Quartile 2 | 0.71[0.37,1.36] | 0.77 [0.39,1.52] | 0.72[0.36,1.45] | 0.73 [0.36,1.48] | ||||
| Quartile 3 | 0.84[0.45,1.57] | 0.91 [0.47,1.77] | 0.87[0.44,1.70] | 0.92[0.47,1.82] | ||||
| Quartile 4 | 1.16[0.65,2.07] | 1.22 [0.66,2.27] | 1.16[0.62,2.18] | 1.25[0.67,2.37] | ||||
| SAA continuous (per SD=22.6) | 1.1 (0.95, 1.2) | 0.27 | 1.1 (0.95, 1.2) | 0.26 | 1.1 (0.95 1.2) | 0.27 | 1.1 (0.96, 1.2) | 0.19 |
| SAA | 0.34 | 0.31 | 0.20 | 0.19 | ||||
| Quartile 1 (Referent) | -- | -- | -- | -- | ||||
| Quartile 2 | 0.70[0.39,1.23] | 0.70 [0.40,1.25] | 0.64[0.351.14] | 0.63 [0.35,1.13] | ||||
| Quartile 3 | 0.78[0.45,1.36] | 0.78 [0.45,1.37] | 0.76[0.43,1.35] | 0.75[0.42,1.33] | ||||
| Quartile 4 | 1.10[0.67,1.83] | 1.14 [0.68,1.92] | 1.12[0.66,1.90] | 1.11[0.66,1.89] | ||||
| TNFR1 continuous (per SD=1.46) | 1.2 (1.1 1.4) | 0.002 | 1.2 (1.1, 1.4) | 0.003 | 1.2 (1.0, 1.4) | 0.017 | 1.2 (1.0, 1.4) | 0.01 |
| TNFR | 0.02 | 0.02 | 0.06 | 0.05 | ||||
| Quartile 1 (Referent) | -- | -- | -- | -- | ||||
| Quartile 2 | 0.92[0.47,1.78] | 0.89 [0.46,1.72] | 0.78[0.39,1.54] | 0.78 [0.39,1.55] | ||||
| Quartile 3 | 1.66[0.93,2.97] | 1.59 [0.89,2.86] | 1.50[0.83,2.70] | 1.55[0.86, 2.80] | ||||
| Quartile 4 | 1.99[1.13,3.51] | 1.98 [1.11,3.52] | 1.66[0.92,2.99] | 1.68[0.93,3.04] | ||||
| CD40L continuous (per SD=4.39) | 0.99 (0.81, 1.2) | 0.93 | 1.0 (0.85, 1.3) | 0.67 | 1.0 (0.81, 1.3) | 0.94 | 0.99 (0.80, 1.2) | 0.99 |
| CD40L | 0.70 | 0.88 | 0.65 | 0.62 | ||||
| Quartile 1 (Referent) | -- | -- | -- | -- | ||||
| Quartile 2 | 1.23[0.72,2.08] | 1.20[0.70,2.04] | 1.31[0.76,2.25] | 1.29[0.75,2.22] | ||||
| Quartile 3 | 1.03[0.60,1.78] | 1.07[0.61,1.86] | 1.09[0.62,1.92] | 1.12[0.63,1.97] | ||||
| Quartile 4 | 0.88[0.50,1.57] | 0.97[0.53,1.76] | 0.91[0.49,1.70] | 0.88[0.47,1.63] | ||||
- Unadjusted
- Adjusted for Demographics (Age, Sex, Race, Region)
- Adjusted for Demographics (Age, Sex, Race, Region) and Co-morbidities (Hypertension, Smoking, History of Prior Ischemic Stroke, Diabetes, LDL and HDL)
- Adjusted for Demographics (Age, Sex, Race, Region) Co-morbidities (Hypertension, Smoking, History of Prior Ischemic Stroke, Diabetes, Low Density Lipoprotein and High Density Lipoprotein) and Statin use at baseline
Table 5. Risk of Lacunar Stroke Unadjusted and Adjusted by Potential Confounders.
| Model 1 | Model 2 | Model 3 | Model 4 | |||||
|---|---|---|---|---|---|---|---|---|
| HR (95%) | p | HR (95%) | p | HR (95%) | p | HR (95%) | p | |
| IL6 continuous (per SD=11.98) | 0.99[0.95,1.04] | 0.79 | 0.99[0.94,1.04] | 0.67 | 0.99[0.95,1.04] | 0.74 | 0.99[0.96,1.03] | 0.77 |
| IL6 | 0.35 | 0.33 | 0.55 | 0.58 | ||||
| Quartile 1 (Referent) | -- | -- | -- | -- | ||||
| Quartile 2 | 0.87[0.35,2.13] | 0.86[0.35,2.14] | 0.89[0.36,2.23] | 0.93[0.37,2.32] | ||||
| Quartile 3 | 1.62[0.74,3.58] | 1.68[0.75,3.76] | 1.55[0.68,3.54] | 1.59[0.69,2.64] | ||||
| Quartile 4 | 0.91[0.37,2.23] | 0.95[0.38,2.36] | 1.01[0.40,2.56] | 1.11[0.44,2.82] | ||||
| MCP1 continuous (per SD=127.93) | 1.00[0.99,1.00] | 0.65 | 1.01[0.99,1.00] | 0.32 | 1.01[1.00,1.00] | 0.69 | 1.01[1.00,1.00] | 0.55 |
| MCP1 | 0.21 | 0.28 | 0.35 | 0.30 | ||||
| Quartile 1 (Referent) | -- | -- | -- | -- | ||||
| Quartile 2 | 0.27[0.08,0.98] | 0.36 [0.10,1.31] | 0.34[0.09,1.28] | 0.35[0.09,1.35] | ||||
| Quartile 3 | 0.84[0.35,2.00] | 1.08[0.42,2.79] | 1.06[0.40,2.80] | 1.17[0.44,3.13] | ||||
| Quartile 4 | 1.05 [0.46,2.38] | 1.26[0.52,3.05] | 1.04[0.40,2.66] | 1.18[0.46,3.06] | ||||
| SAA continuous (per SD=22.6) | 1.00[0.99,1.01] | 0.16 | 1.01[0.99,1.01] | 0.13 | 1.01[1.00,1.01] | 0.07 | 1.01[1.00,1.01] | 0.03 |
| SAA | 0.78 | 0.74 | 0.69 | 0.62 | ||||
| Quartile 1 (Referent) | -- | -- | -- | -- | ||||
| Quartile 2 | 0.74[0.33,1.67] | 0.71 [0.31,1.61] | 0.70[0.30,1.63] | 0.66[0.28,1.54] | ||||
| Quartile 3 | 0.66[0.28,1.53] | 0.64[0.28,1.49] | 0.60[0.25,1.45] | 0.59[0.25,1.42] | ||||
| Quartile 4 | 0.79[0.36,1.75] | 0.80[0.36,1.80] | 0.83[0.36,1.93] | 0.86[0.37,2.01] | ||||
| TNFR1 continuous (per SD=1.46) | 1.18[1.03,1.34] | 0.02 | 1.15[1.01,1.32] | 0.04 | 1.13[0.98,1.30] | 0.10 | 1.16[1.00,1.34] | 0.05 |
| TNFR1 | 0.29 | 0.26 | 0.34 | 0.27 | ||||
| Quartile 1 (Referent) | -- | -- | -- | -- | ||||
| Quartile 2 | 0.75[0.28,2.01] | 0.72 [0.27,1.95] | 0.61[0.22,1.71] | 0.60[0.21,1.70] | ||||
| Quartile 3 | 1.23[0.52,2.92] | 1.18[0.49,2.81] | 1.11[0.46,2.67] | 1.22[0.51,2.99] | ||||
| Quartile 4 | 1.69[0.75,3.84] | 1.72[0.75,3.97] | 1.47[0.63,3.43] | 1.54[0.66,3.63] | ||||
| CD40L continuous (per SD=4.39) | 0.97[0.90,1.04] | 0.35 | 0.99[0.92,1.07] | 0.77 | 0.98[0.90,1.06] | 0.56 | 0.97[0.90,1.05] | 0.51 |
| CD40L | 0.45 | 0.51 | 0.38 | 0.25 | ||||
| Quartile 1 (Referent) | -- | -- | -- | -- | ||||
| Quartile 2 | 1.09[0.49,2.43] | 1.10[0.49,2.48] | 1.22[0.54,2.78] | 1.24[0.54,2.83] | ||||
| Quartile 3 | 1.22[0.56,2.63] | 1.44[0.66,3.18] | 1.46[0.66,3.25] | 1.60[0.72,3.58] | ||||
| Quartile 4 | 0.56[0.21,1.49] | 0.70[0.26,1.92] | 0.60[0.20,1.78] | 0.57[0.19,1.69] | ||||
- Unadjusted
- Adjusted for Demographics (Age, Sex, Race, Region)
- Adjusted for Demographics (Age, Sex, Race, Region) and Co-morbidities (Hypertension, Smoking, History of Prior Ischemic Stroke, Diabetes, LDL and HDL)
- Adjusted for Demographics (Age, Sex, Race, Region) Co-morbidities (Hypertension, Smoking, History of Prior Ischemic Stroke, Diabetes, Low Density Lipoprotein and High Density Lipoprotein) and Statin use at baseline
There was no interaction between IL6 and time interval from stroke to blood draw.
TNFR1 and Recurrent Events
In unadjusted analyses, TNFR1 was associated with the risk of having a recurrent ischemic stroke (HR per SD 1.20, 95% CI 1.0-1.4, p=0.024) and a major vascular event (HR per SD 1.20, 95% CI 1.1-1.4, p=0.002). After adjusting for demographics and comorbidities, TNFR1 was no longer associated with the risk of recurrent ischemic stroke (HR per SD 1.20, 95% CI 0.97-1.4, p=0.11) but remained associated with the risk of major vascular events (adjusted HR per SD 1.21, 95% CI 1.05-1.41, p=0.01).
Compared with the bottom quartile (TNFR1<2.24 ng/L), those in the top quartile of TNFR1 (>3.63 ng/L) were at twice the risk of major vascular events after adjusting for demographics (partially adjusted HR 1.98, 95% CI 1.11-3.52), though the effect attenuated after adjusting for other risk factors and statin use (fully adjusted HR 1.68, 95% CI 0.93-3.04). There was no evidence that TNFR1 was related to the risk of having recurrent lacunar stroke (Table 5).
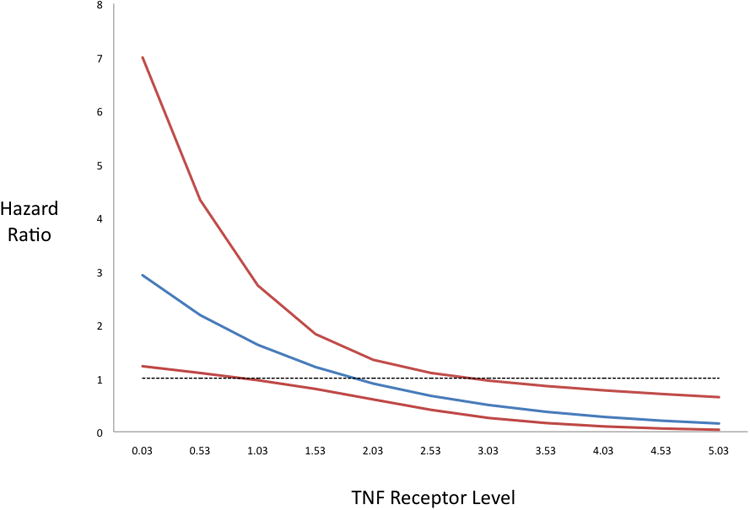
The risk of having a recurrent major vascular event associated with antiplatelet treatment assignment depended on TNFR1 concentration. There was an interaction between antiplatelet treatment assignment and TNFR1 (p=0.008; Figure 1); as TNFR1 concentrations increased, dual antiplatelet therapy became relatively less effective than aspirin alone.
Figure 1. Hazard Ratios of Major Vascular Events for aspirin vs clopidogrel across TNF Receptor Levels.
SAA and Recurrent Events
In unadjusted analyses, SAA, either as a continuous or categorical variable, was not related to the risk of having a recurrent ischemic stroke or a major vascular event. After adjusting for sex, race, region, co-morbidities and statin use at baseline, however, SAA was associated with a minimally increased risk of recurrent lacunar stroke (HR per SD SAA 1.01, 95% CI 1.00-1.01, p=0.03; Table 5). There were no interactions between treatment assignment and SAA.
MCP1 and CD40L and Recurrent Events
Neither MCP1 nor CD40L, either as continuous or categorical variables, was related to the risk of having recurrent events. There was no evidence of an interaction between either MCP1 or CD40L with antiplatelet treatment assignment.
Discussion
We investigated whether several inflammatory markers were independent risk factors for recurrent vascular events, including ischemic stroke, among patients with lacunar stroke in the SPS3 trial. We found that IL6 and TNFR1 concentrations were associated with the risk of recurrent ischemic stroke and major vascular events. We were unable to demonstrate an association with recurrent lacunar stroke, but our power was limited for this outcome. Other markers, such as MCP-1, SAA and CD40L, were not associated with recurrent ischemic stroke or other vascular events. We further investigated whether there was evidence that inflammatory markers could be used to help identify a group of lacunar stroke patients who might benefit from dual antiplatelet therapy with aspirin and clopidogrel, which has not been shown to be of benefit in unselected lacunar stroke patients. We found that among recent lacunar stroke patients, IL6 and TNF receptor concentrations predict risk of recurrent vascular events, and are associated with the effect of antiplatelet therapies.
The relationship between IL6 and recurrent events that we found in LIMITS was consistent with prior research. For every increase in the SD of IL-6 the risk of recurrent ischemic stroke or major vascular event increased by 10%. Prior prospective studies identified a similar relationship between increased IL-6 and recurrent stroke or myocardial infarction.22,23-25 IL6 is the major cytokine that stimulates the liver to produce CRP, and it is therefore in some ways not surprising that IL6 would also be associated with an increase in risk of recurrent events in this same cohort. The relationship of IL6 to recurrence risk, however, was not as robust as the relationship found with hsCRP, as quartiles of IL6 were not associated with recurrence risk after adjusting for other risk factors. The relationship between CRP and IL6 as predictors of risk, however, may be complicated by bidirectional feedback loops in the regulation of IL6 and CRP production. In the Northern Manhattan Study (NOMAS), for example, those with the combination of elevated levels of IL6 and hsCRP were found to be at highest risk of a first ischemic event.26
TNFR1 has been associated with an increased risk of vascular events and mortality in several studies.27, 28 In NOMAS, TNFR1 was also associated with carotid atherosclerosis29, and increased levels were identified as a risk factor for poor outcome after stroke in studies in other populations.30 In the present lacunar stroke patient cohort, TNFR1 levels predicted recurrent vascular events, including ischemic stroke, but these results were attenuated once the models were adjusted for other potentially confounding covariates. It is thus possible that some of the positive findings from other studies were also due to residual confounding.
We could not confirm that several other inflammatory biomarkers are associated with recurrent ischemic stroke and vascular events, in contrast to prior research. The mechanisms of lacunar stroke, which include liphyalinosis and microemboli, as well as microatheroma, may be sufficiently distinct from those of atherosclerotic disease that predictive variables differ. Though there is emerging evidence that inflammation plays an important role in small vessel disease, these biomarkers related to atherosclerotic disease may not be optimally suited to measure this risk. The associations of inflammatory biomarkers may differ between essentially healthy populations and those who have already experienced a first stroke. There is growing evidence, for example, that the effects of stroke itself may lead to prolonged elevation in inflammation, lasting months or more.31 Alternatively, there may be other explanations for our inability to confirm MCP1, SAA and CD40L as risk factors for recurrence in lacunar stroke patients, including laboratory error, confounding by other key variables, and small sample size.
The reason for the differential effect of intensity of antiplatelet therapies among those with higher concentrations of IL6 and TNFR1 remain uncertain. We hypothesized that those with more inflammation (i.e., higher marker levels) would have a greater benefit from dual antiplatelets than those with less inflammation. We found, however, the opposite: dual antiplatelets were more effective among those with lower concentrations of inflammatory markers. As levels increased, aspirin alone was more effective. It is possible that among those with higher levels of inflammation, the addition of clopidogrel provided no further benefit beyond aspirin alone. The increased risk associated with inflammation may have been more determinative of an adverse cardiovascular outcome, and less subject to reduction by a second agent. Future studies would be needed to confirm that lower inflammatory marker levels could be used as a criterion for dual antiplatelet treatment after ischemic stroke and lacunar stroke in particular. There are other potential explanations, as well, however. It has been hypothesized that aspirin's vascular protective effects are due to its antiplatelet and anti-inflammatory effects, 32 while clopidogrel has primarily antiplatelet effects.
Our study had limitations. Selection bias could have occurred due to the nesting of LIMITS within SPS3. There was also limited data on chronic inflammatory diseases and clinical infections. A further limitation is the use of specifically selected biomarkers as opposed to a more extensive omics based approach. This study also has strengths, however. First, LIMITS had a multicenter, international design with a central laboratory, which should have reduced inter-laboratory error. The population included in this study is very diverse with a well-defined lacunar stroke population. As prior reviews of the role of inflammatory biomarkers in stroke management have suggested, similarly designed studies are needed.33
LIMITS suggests that elevations in the inflammatory biomarkers IL-6 and TNFR1 marginally increase the risk of recurrent vascular events whereas elevations in the markers MCP-1, SAA and CD40L are not associated with recurrent vascular events. Future studies are needed to further explore and identify risk factors for recurrent vascular events after a lacunar stroke event.
Supplementary Material
Acknowledgments
None
Sources of Funding: The SPS3 trial was funded by a cooperative agreement with the National Institute of Neurological Disorders and Stroke (NINDS) (NINDS UO1 NS038529), and the LIMITS ancillary study was funded through an ancillary award (NINDS R01 NS050724) from the NIH/NINDS. Supplemental funding was provided by the Bristol-Myers Squibb-Sanofi Pharmaceutical Partnership. Dr. Boehme is supported by NINDS NIH T32 NS007153. The content is solely the responsibility of the authors and does not necessarily represent the official views of the NINDS or the NIH.
Footnotes
Disclosures: Dr. Mitchell S. V. Elkind received research support from BMS-Sanofi Partnership for the LIMITS ancillary study to SPS3, and he receives compensation for providing consultative services for BMS-Pfizer Partnership and for serving as an expert witness for BMS-Sanofi Partnership regarding clopidogrel and stroke.
Clinical Trial Registration: URL: http://www.clinicaltrials.gov. Unique identifier: NCT00059306.
References
- 1.Chamorro A, Sacco RL, Mohr JP, Foulkes MA, Kase CS, Tatemichi TK, et al. Clinical-computed tomographic correlations of lacunar infarction in the stroke data bank. Stroke; a journal of cerebral circulation. 1991;22:175–181. doi: 10.1161/01.str.22.2.175. [DOI] [PubMed] [Google Scholar]
- 2.Rothrock JF, Lyden PD, Brody ML, Taft-Alvarez B, Kelly N, Mayer J, et al. An analysis of ischemic stroke in an urban southern california population. The university of california, san diego, stroke data bank. Archives of internal medicine. 1993;153:619–624. [PubMed] [Google Scholar]
- 3.Wolfe CD, Rudd AG, Howard R, Coshall C, Stewart J, Lawrence E, et al. Incidence and case fatality rates of stroke subtypes in a multiethnic population: The south london stroke register. Journal of neurology, neurosurgery, and psychiatry. 2002;72:211–216. doi: 10.1136/jnnp.72.2.211. [DOI] [PMC free article] [PubMed] [Google Scholar]
- 4.Gorelick PB, Caplan LR, Hier DB, Parker SL, Patel D. Racial differences in the distribution of anterior circulation occlusive disease. Neurology. 1984;34:54–59. doi: 10.1212/wnl.34.1.54. [DOI] [PubMed] [Google Scholar]
- 5.Ross GW, Petrovitch H, White LR, Masaki KH, Li CY, Curb JD, et al. Characterization of risk factors for vascular dementia: The honolulu-asia aging study. Neurology. 1999;53:337–343. doi: 10.1212/wnl.53.2.337. [DOI] [PubMed] [Google Scholar]
- 6.Tatemichi TK, Desmond DW, Paik M, Figueroa M, Gropen TI, Stern Y, et al. Clinical determinants of dementia related to stroke. Annals of neurology. 1993;33:568–575. doi: 10.1002/ana.410330603. [DOI] [PubMed] [Google Scholar]
- 7.Fisher CM. Cerebral ischemia--less familiar types. Clinical neurosurgery. 1971;18:267–336. [PubMed] [Google Scholar]
- 8.Fisher CM. Capsular infarcts: The underlying vascular lesions. Archives of neurology. 1979;36:65–73. doi: 10.1001/archneur.1979.00500380035003. [DOI] [PubMed] [Google Scholar]
- 9.Fisher CM. Thalamic pure sensory stroke: A pathologic study. Neurology. 1978;28:1141–1144. doi: 10.1212/wnl.28.11.1141. [DOI] [PubMed] [Google Scholar]
- 10.Sacco RL. Risk factors, outcomes, and stroke subtypes for ischemic stroke. Neurology. 1997;49:S39–44. doi: 10.1212/wnl.49.5_suppl_4.s39. [DOI] [PubMed] [Google Scholar]
- 11.Tuttolomondo A, Di Raimondo D, Di Sciacca R, Pecoraro R, Arnao V, Butta C, et al. Arterial stiffness and ischemic stroke in subjects with and without metabolic syndrome. Atherosclerosis. 2012;225:216–219. doi: 10.1016/j.atherosclerosis.2012.08.027. [DOI] [PubMed] [Google Scholar]
- 12.Pinto A, Tuttolomondo A, Casuccio A, Di Raimondo D, Di Sciacca R, Arnao V, et al. Immuno-inflammatory predictors of stroke at follow-up in patients with chronic non-valvular atrial fibrillation (nvaf) Clin Sci (Lond) 2009;116:781–789. doi: 10.1042/CS20080372. [DOI] [PubMed] [Google Scholar]
- 13.Revilla M, Obach V, Cervera A, Davalos A, Castillo J, Chamorro A. A -174g/c polymorphism of the interleukin-6 gene in patients with lacunar infarction. Neuroscience letters. 2002;324:29–32. doi: 10.1016/s0304-3940(02)00169-6. [DOI] [PubMed] [Google Scholar]
- 14.Ridker PM, Buring JE, Shih J, Matias M, Hennekens CH. Prospective study of c-reactive protein and the risk of future cardiovascular events among apparently healthy women. Circulation. 1998;98:731–733. doi: 10.1161/01.cir.98.8.731. [DOI] [PubMed] [Google Scholar]
- 15.Ridker PM, Hennekens CH, Buring JE, Rifai N. C-reactive protein and other markers of inflammation in the prediction of cardiovascular disease in women. The New England journal of medicine. 2000;342:836–843. doi: 10.1056/NEJM200003233421202. [DOI] [PubMed] [Google Scholar]
- 16.Benavente OR, Hart RG, McClure LA, Szychowski JM, Coffey CS, et al. The SPS Investigators. Effects of clopidogrel added to aspirin in patients with recent lacunar stroke. The New England journal of medicine. 2012;367:817–825. doi: 10.1056/NEJMoa1204133. [DOI] [PMC free article] [PubMed] [Google Scholar]
- 17.Benavente OR, Coffey CS, Conwit R, Hart RG, McClure LA, et al. The SPSS Investigators. Blood-pressure targets in patients with recent lacunar stroke: The sps3 randomised trial. Lancet. 2013;382:507–515. doi: 10.1016/S0140-6736(13)60852-1. [DOI] [PMC free article] [PubMed] [Google Scholar]
- 18.Elkind MS, Luna JM, McClure LA, Zhang Y, Coffey CS, Roldan A, et al. C-reactive protein as a prognostic marker after lacunar stroke: Levels of inflammatory markers in the treatment of stroke study. Stroke; a journal of cerebral circulation. 2014;45:707–716. doi: 10.1161/STROKEAHA.113.004562. [DOI] [PMC free article] [PubMed] [Google Scholar]
- 19.Benavente OR, White CL, Pearce L, Pergola P, Roldan A, Benavente MF, et al. The secondary prevention of small subcortical strokes (sps3) study. International journal of stroke : official journal of the International Stroke Society. 2011;6:164–175. doi: 10.1111/j.1747-4949.2010.00573.x. [DOI] [PMC free article] [PubMed] [Google Scholar]
- 20.Elkind MS, Luna JM, Coffey CS, McClure LA, Liu KM, Spitalnik S, et al. The levels of inflammatory markers in the treatment of stroke study (limits): Inflammatory biomarkers as risk predictors after lacunar stroke. International journal of stroke : official journal of the International Stroke Society. 2010;5:117–125. doi: 10.1111/j.1747-4949.2010.00420.x. [DOI] [PMC free article] [PubMed] [Google Scholar]
- 21.Samuelsson M, Soderfeldt B, Olsson GB. Functional outcome in patients with lacunar infarction. Stroke; a journal of cerebral circulation. 1996;27:842–846. doi: 10.1161/01.str.27.5.842. [DOI] [PubMed] [Google Scholar]
- 22.Whiteley W, Jackson C, Lewis S, Lowe G, Rumley A, Sandercock P, et al. Inflammatory markers and poor outcome after stroke: A prospective cohort study and systematic review of interleukin-6. PLoS medicine. 2009;6:e1000145. doi: 10.1371/journal.pmed.1000145. [DOI] [PMC free article] [PubMed] [Google Scholar]
- 23.Biasucci LM, Vitelli A, Liuzzo G, Altamura S, Caligiuri G, Monaco C, et al. Elevated levels of interleukin-6 in unstable angina. Circulation. 1996;94:874–877. doi: 10.1161/01.cir.94.5.874. [DOI] [PubMed] [Google Scholar]
- 24.Vila N, Castillo J, Davalos A, Chamorro A. Proinflammatory cytokines and early neurological worsening in ischemic stroke. Stroke; a journal of cerebral circulation. 2000;31:2325–2329. doi: 10.1161/01.str.31.10.2325. [DOI] [PubMed] [Google Scholar]
- 25.Beamer NB, Coull BM, Clark WM, Hazel JS, Silberger JR. Interleukin-6 and interleukin-1 receptor antagonist in acute stroke. Annals of neurology. 1995;37:800–805. doi: 10.1002/ana.410370614. [DOI] [PubMed] [Google Scholar]
- 26.Luna JM, Moon YP, Liu KM, Spitalnik S, Paik MC, Cheung K, et al. High-sensitivity c-reactive protein and interleukin-6-dominant inflammation and ischemic stroke risk: The northern manhattan study. Stroke; a journal of cerebral circulation. 2014;45:979–987. doi: 10.1161/STROKEAHA.113.002289. [DOI] [PMC free article] [PubMed] [Google Scholar]
- 27.Luna JM, Moon Y, Liu K, Spitalnik S, Paik M, Sacco R, et al. Tumour necrosis factor receptor 1 and mortality in a multi-ethnic cohort: The northern manhattan study. Age and ageing. 2013;42:385–390. doi: 10.1093/ageing/afs175. [DOI] [PMC free article] [PubMed] [Google Scholar]
- 28.Pai JK, Pischon T, Ma J, Manson JE, Hankinson SE, Joshipura K, et al. Inflammatory markers and the risk of coronary heart disease in men and women. The New England journal of medicine. 2004;351:2599–2610. doi: 10.1056/NEJMoa040967. [DOI] [PubMed] [Google Scholar]
- 29.Elkind MS, Cheng J, Boden-Albala B, Rundek T, Thomas J, Chen H, et al. Tumor necrosis factor receptor levels are associated with carotid atherosclerosis. Stroke; a journal of cerebral circulation. 2002;33:31–37. doi: 10.1161/hs0102.100531. [DOI] [PMC free article] [PubMed] [Google Scholar]
- 30.Castellanos M, Castillo J, Garcia MM, Leira R, Serena J, Chamorro A, et al. Inflammation-mediated damage in progressing lacunar infarctions: A potential therapeutic target. Stroke; a journal of cerebral circulation. 2002;33:982–987. doi: 10.1161/hs0402.105339. [DOI] [PubMed] [Google Scholar]
- 31.Doyle KP, Quach LN, Sole M, Axtell RC, Nguyen TV, Soler-Llavina GJ, et al. B-lymphocyte-mediated delayed cognitive impairment following stroke. The Journal of neuroscience : the official journal of the Society for Neuroscience. 2015;35:2133–2145. doi: 10.1523/JNEUROSCI.4098-14.2015. [DOI] [PMC free article] [PubMed] [Google Scholar]
- 32.Ridker PM, Cushman M, Stampfer MJ, Tracy RP, Hennekens CH. Inflammation, aspirin, and the risk of cardiovascular disease in apparently healthy men. The New England journal of medicine. 1997;336:973–979. doi: 10.1056/NEJM199704033361401. [DOI] [PubMed] [Google Scholar]
- 33.Di Napoli M, Schwaninger M, Cappelli R, Ceccarelli E, Di Gianfilippo G, Donati C, et al. Evaluation of c-reactive protein measurement for assessing the risk and prognosis in ischemic stroke: A statement for health care professionals from the crp pooling project members. Stroke; a journal of cerebral circulation. 2005;36:1316–1329. doi: 10.1161/01.STR.0000165929.78756.ed. [DOI] [PubMed] [Google Scholar]
Associated Data
This section collects any data citations, data availability statements, or supplementary materials included in this article.