Abstract
Hypromellose is a hydrophilic polymer widely used in immediate- and modified-release oral pharmaceutical dosage forms. However, currently available grades of hypromellose are difficult, if not impossible, to process by hot melt extrusion (HME) because of their high glass transition temperature, high melt viscosity, and low degradation temperature. To overcome these challenges, a modified grade of hypromellose, AFFINISOL™ HPMC HME, was recently introduced. It has a significantly lower glass transition temperature and melt viscosity as compared to other available grades of hypromellose. The objective of this paper is to assess the extrudability and performance of AFFINISOL™ HPMC HME (100LV and 4M) as compared to other widely used polymers in HME, including HPMC 2910 100cP (the currently available hypromellose), Soluplus®, Kollidon® VA 64, and EUDRAGIT® E PO. Formulations containing polymer and carbamazepine (CBZ) were extruded on a co-rotating 16-mm twin-screw extruder, and the effect of temperature, screw speed, and feed rate was investigated. The performance of the solid dispersions was evaluated based on Flory–Huggins modeling and characterized by differential scanning calorimetry (DSC), X-ray powder diffraction (XRD), Raman spectroscopy, Fourier-transform infrared (FTIR) spectroscopy, and dissolution. All formulations extruded well except for HPMC 2910 100cP, which resulted in over-torqueing the extruder (machine overloading because the motor cannot provide efficient energy to rotate the shaft). Among the HME extrudates, only the EUDRAGIT® E PO formulation was crystalline as confirmed by DSC, XRD, and Raman, which agreed with predictions from Flory–Huggins modeling. Dissolution testing was conducted under both sink and non-sink conditions. Sink dissolution testing in neutral media revealed that amorphous CBZ in the HME extrudates completely dissolved within 15 min, which was much more rapid than the time for complete dissolution of bulk CBZ (60 min) and EUDRAGIT® E PO solid dispersion (more than 6 h). Non-sink dissolution in acidic media testing revealed that only CBZ contained in the AFFINISOL™ HPMC HME, and EUDRAGIT® E PO solid dispersions rapidly supersaturated after 15 min, reaching a twofold drug concentration compared to the CBZ equilibrium solubility. In summary, AFFINISOL™ HPMC HME 100LV and AFFINISOL™ HPMC HME 4M are useful in the pharmaceutical HME process to increase wetting and dissolution properties of poorly water-soluble drugs like CBZ.
Electronic supplementary material
The online version of this article (doi:10.1208/s12249-015-0395-9) contains supplementary material, which is available to authorized users.
KEY WORDS: Affinisol, carbamazepine, HPMC, melt extrusion, solid dispersion
INTRODUCTION
Applying high throughput screening in the discovery and synthesis of small-molecule drugs has dramatically increased the number of poorly water-soluble compounds (1). The absorption of poorly water-soluble drugs into the systemic circulation is highly dependent upon their aqueous solubility, and therefore increasing the solubility/dissolution properties of poorly water-soluble drugs for oral delivery is a mandatory and challenging task in dosage form development. Solid dispersions are considered an attractive approach to increase solubility, dissolution, and bioavailability of poorly soluble drugs (2). Solid dispersions have been prepared by various approaches such as HME, KinetiSol® technique, co-evaporation, hot spin mixing, roll-mixing or co-milling, thin-film freezing (i.e., ultra-rapid freezing), spray drying, and supercritical fluid processing (3–7).
HME was originally adapted from the plastics industry, first used for pharmaceutical formulations in 1971 by El-Egakey et al., and refined in later years by various research groups (8–11). HME technology has gained favor over traditional pharmaceutical formulation techniques in solubility enhancement because it is a solvent-free and the continuous operation process that does not require major downstream processing (9,12). By selecting a suitable exit die and processing parameters, a variety of solid dosage forms including granules, pellets, tablets, suppositories, implants, stents, transdermal and transmucosal systems, and ophthalmic inserts can be produced using HME (9,13). As for the quality of the extruded material (i.e., the extrudate), carrier (polymer) properties such as the glass transition temperature (i.e., Tg; the temperature at which the polymer starts to soften), the solubility of the drug in the softened or molten polymer, and the stability of the polymer are crucial to forming a homogeneous composition (11).
Hypromellose is a hydrophilic polymer widely used in pharmaceutical dosage forms, including immediate-release and modified-release formulations. It is an amorphous polymer that typically exhibits a broad glass transition temperature from about 160°C to 210°C. The polymer has a comparatively low decomposition temperature, showing significant degradation at temperatures in the range of 200°C to 250°C, depending upon the substitution (14). These high glass transition temperature and low degradation temperature together with the high melt viscosity make it challenging to process hypromellose by HME. Current techniques reported to improve the processability of hypromellose require the use of high levels of plasticizer and other processing aids (15), which for certain amorphous systems, including solid dispersions, may result in crystallization of the drug during storage and during imbibition of water as the dosage form travels through the gastrointestinal tract leading to a subsequent reduction in dissolution and absorption (e.g., decrease in bioavailability). Hypromellose has been shown to be an effective recrystallization inhibitor in stabilizing amorphous drugs which can enhance the bioavailability of poorly soluble compounds (16). Therefore, it is highly desirable to incorporate hypromellose into a HME formulation without the use of plasticizers. Although some recent studies suggest the possibility of extrusion of existing commercial grades of hypromellose at high temperatures (17,18), it is very challenging to apply these conditions to most drug candidates due to thermal degradation of the drug itself. A modified hypromellose, AFFINISOL™ HPMC HME, was recently introduced by The Dow Chemical Company. It is produced using traditional HPMC manufacturing methods to result in a different substitution architecture, which makes AFFINISOL™ HPMC HME exhibit a significantly lower Tg (117°C–128°C) (19) and melt viscosity than presently available grades of hypromellose, making it more suitable to thermal processing.
The purpose of this study was to compare the extrudability of two different grades of AFFINISOL™ HPMC HME 4M (552.8 kDa) and 100LV (179.3 kDa) to currently available HPMC as well as alternative extrusion polymers. Additionally, the ability to generate and the performance of amorphous solid dispersions with the selected polymers were studied using carbamazepine as a poorly soluble model API. Flory–Huggins modeling was used to predict the initial experimental conditions and drug load.
MATERIALS AND METHODS
Materials
Crystalline CBZ was purchased from Letco Medical (Decatur, AL). The Dow Chemical Company (Midland, MI) kindly donated AFFINISOL™ HPMC HME 4M and 100LV (AFF4000 or AFF100) and HPMC 2910 100cP (HPMC100). BASF Corporation (Florham Park, NJ) kindly donated Soluplus® (Soluplus) and Kollidon® VA 64 (VA64). Evonik (Piscataway, NJ) kindly donated EUDRAGIT® E PO (EPO). High-performance liquid chromatography (HPLC) grade acetonitrile and water were purchased from Fisher Scientific Co. (Houston, TX). All other chemicals used in this study were of American Chemical Society (ACS) grade.
Methods
Modeling Based on Flory–Huggins Theory
Phase diagrams for CBZ and polymer systems were generated using Flory–Huggins Theory as previously described (20–26). Briefly speaking, the Gibbs free energy of mixing function that results from application of the Flory–Huggins model is dependent on the volume fraction of the drug, ϕ, a constant indicative of the relative size of the polymer in relation to the drug, m, and the interaction parameter, χ:
| 1 |
DSC experiments was used to determine the melting enthalpy of the drug, ∆H, and either the melting temperature (22,23), onset of melting (24), or ending of melting (25) have been applied by various authors to determine χ, which is a function of temperature (27). For CBZ and polymer systems, melting temperature was selected based on the reproducibility of this value in experimental trials. The temperature dependency of χ at room temperature can be calculated with the application of solubility parameters (24). Calculation of the solubility parameters, along with the molar volume per Flory–Huggins lattice size, was performed using Molecular Modeling Pro software (Chem SW Inc., Fairfield, CA)
For our analysis, χ is assumed to only be a function of temperature. Any dependency on composition is neglected, and this assumption is in line with that reported previously (22,25). With the χ value at different temperatures being calculated by the linear equation predicted by the two points (χ) at room temperature and Tm, a Gibbs free energy diagram at selected temperatures can be produced.
Setting the second derivative of Equation 1 equal to 0 and determining ϕ as a function of χ allow for the determination of the boundary between unstable and metastable regions, or referred to as the spinodal curve. Furthermore, constructing the common tangents between the minima on the free energy diagram can form the boundary between the metastable and stable regions called bimodal curve. This corresponds to points in which the chemical potentials of the two phases are in equilibrium. The binodal curve which is solved numerically will intersect the spinodal curve at the critical point, the third derivative of Equation 1.
Hot Melt Extrusion and Milling
HME studies were conducted on a co-rotating Leistritz Nano-16 twin-screw extruder (American Leistritz Extruder Corp. USA, Somerville, NJ) equipped with screws containing two kneading elements (30° and 60°) were used in each screw and a 3-mm strand die. A single screw feeder set on top of the barrel feed zone provided an accurate 5 g/min feed rate of the powder blend. Polymer drug blend with 15% and 30% CBZ loading was extruded using Leistritz extruder at different temperatures ranging from 120°C to 180°C, with screw speed at 100, 150, and 200 rpm. Extrudates were cooled to room temperature before milling. A Fitzmill L1A hammer mill (Fitzpatrick) operating at 9000 rpm with knives side forward and a 0.020-in. screen installed in the chamber was used to mill the extrudates. The powder fraction retained between 60 mesh and 100 mesh screens was collected for further analysis.
High-Performance Liquid Chromatography
CBZ was detected by a Dionex HPLC system (ThermoFisher Scientific Inc., Waltham, MA) equipped with a Phenomenex® Luna 250 mm C18 (5 μm, 4.6 × 250 mm) column. The composition of HPLC mobile phase was 60:40 acetonitrile/water. Prior to use, the mobile phase was filtered through a 0.45-μm filter and then degassed under vacuum with sonication. The mobile phase flow rate was 1 mL/min. The retention time of CBZ was approximately 4.2 min. The detection wavelength was 263 nm.
X-ray Powder Diffraction
XRD studies were conducted on a Philips 1710 X-ray diffractometer with a copper target and a nickel filter (Philips Electronic Instruments, Inc., Mahwah, NJ). The voltage and current of the equipment were set to 40 kV and 40 mA, respectively. Prior to analysis, the sample was placed in the quartz slot of a zero background XRD sample holder and flattened with a glass slide. The 2-theta angle, step size, and dwell time were set to 10°–50°, 0.05°, and 2 s, respectively. In order to obtain XRD patterns, the raw data was processed using Jade 5.0 software (Materials Data, Inc., Livermore, CA).
Modulated Differential Scanning Calorimetry
To characterize the thermal behavior of the samples, modulated DSC equipped with a DSC refrigerated cooling system (DSC 2920, TA Instruments, New Castle, DE) was employed. Dry nitrogen gas at a flow rate of 40 mL/min throughout the testing was used to purge the DSC cell. Samples were accurately weighed in aluminum sample pan kits (PerkinElmer Inc., Waltham, MA) and crimped before analysis. Samples were heated from 50°C to 220°C with a heating rate of 10°C/min using a 0.5°C/40 s modulation program. TA Universal Analysis 2000 software was used to process the raw data.
Spectroscopy
Raman Spectroscopy
Raman spectra were collected with a Raman RXN1 microscope (Kaiser Optical Systems, Inc.) equipped with a 785-nm Invictus laser. The laser was focused on the sample with an Mk II probe and a ×50 microscope objective (≈30 mW at sample), and the back-scattered light was collected with the same optics. The total acquisition time of each spectrum was 60 s. The Raman shift axis was calibrated with the 801.8 cm−1 band of cyclohexane (28). The amorphous form of carbamazepine was prepared by heating the material on a hot stage until it was completely melted and then quench cooling it in liquid nitrogen.
Fourier-Transform Infrared Spectroscopy
Attenuated total reflectance (ATR) infrared spectra were acquired with a Perkin Elmer Spectrum One FTIR and Universal ATR Sampling Accessory at a resolution of 4 cm−1. Sixteen scans (≈90 s acquisition time) were collected for each spectrum in the wavelength region between 300 and 4000 cm−1. The Universal ATR Sampling Accessory was equipped with a single-bounce diamond/ZnSe crystal.
Dissolution Testing
Dissolution Testing at Sink Conditions
A VanKel VK 7000 dissolution system (Varian, Inc., Palo Alto, CA) with the corresponding paddle was utilized to perform the testing according to USP 29 apparatus II. The paddle speed and temperature were set to 100 rpm and 37°C ± 0.5°C, respectively. Before testing, 1000 mL of DI water was pre-heated to 37°C in each dissolution vessel. Milled extrudates containing 100 mg CBZ equivalent (n = 6) were pre-wetted in a 20-mL scintillation vial using dissolution media for 10 s; the time at which the material was pre-wetted was considered the 0 min time point. The wetted sample was then added immediately to the dissolution vessel. At time points of 15 min, 30 min, 45 min, 1 h, 1 h and 30 min, and 2 h, a 1-mL sample was pulled and filtered through a 0.2-μm 13-mm PVDF membrane filter. A 200 μL aliquot of filtered solution was diluted with 1.4 mL HPLC grade acetonitrile, and the concentration of CBZ in the diluted sample was measured using HPLC.
Dissolution Testing at Non-sink Conditions
Dissolution testing was also conducted at non-sink conditions in acidic media using 200 mL vessels and corresponding paddles. Solution of 100 mL of 0.1 N HCl was pre-heated to 37°C in each dissolution vessel. Milled extrudate containing 100 mg CBZ equivalent (n = 6) was pre-wetted in a 20-mL scintillation vial using dissolution media for 10 s; the time at which the material was pre-wetted was considered the 0 min time point. The wetted sample was then added immediately to the dissolution vessel. At time points of 15 min, 30 min, 45 min, 1 h, 1 h and 30 min, 2 h, and 6 h, a 1-mL sample was taken and filtered through a 0.2-μm 13-mm PVDF membrane filter. Sample dilution and HPLC quantification were the same as the sink condition dissolution testing above.
Statistical Analysis
Data are presented as mean ± standard deviation. The data were analyzed through paired t-test and one-way ANOVA using the JMP® 11 software. For the paired t-test, p < 0.05 was set as the significance threshold for the differences within groups. For one-way ANOVA, p < 0.05 was set as the significance threshold for differences between groups.
RESULTS
Polymer–CBZ Miscibility Based on Flory–Huggins Theory
The Flory–Huggins interaction parameter, χ was calculated based on the linear equation predicted by the experimentally determined χ at melting point of each polymer and drug mixture and solubility parameters estimated χ at 25°C. Substitution of χ value into Equation 1 yields the free energy of mixing versus drug composition plot which is shown in Fig. 1a. As shown in Fig. 1a, the free energy of mixing is convex at elevated temperatures (200°C), and homogeneous mixtures of CBZ and all polymers were stable for all compositions at this temperature and above. For all systems except AFF100 and AFF4000, χ decreased at elevated temperatures, which indicated mixing of CBZ and polymer became more favorable with increasing temperature. The results shown in Fig. 1b, which were generated by solving the free energy relationship (Equation 1) at specific temperatures, further highlight this relationship. To the contrary, for AFF100 and AFF4000 systems, χ was negative at all temperatures between −200°C to 200°C. Moreover, χ increased with increasing temperature for those two systems. Therefore, no unstable zone of CBZ was observed in Fig. 1b unless at high drug load and temperature.
Fig. 1.
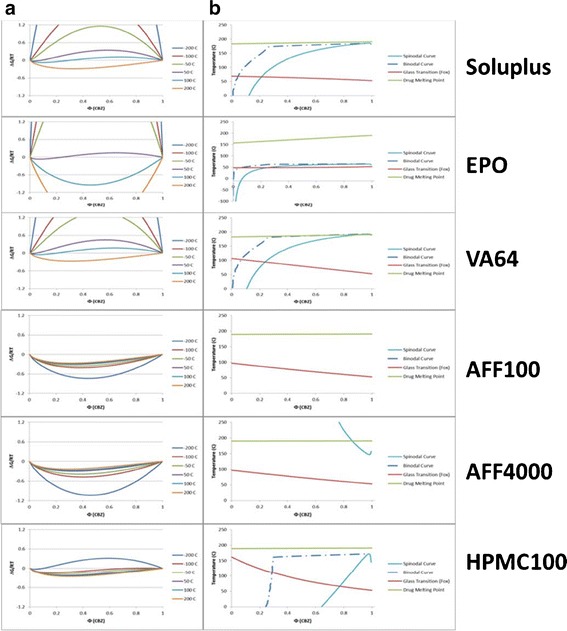
Free energy and phase diagrams. a Free energy diagram of the CBZ/polymers system as determined using Flory–Huggins Theory. b Thermal phase diagram of the CBZ/polymers representing the boundaries between thermodynamically unstable, metastable, and stable regions as bounded by the spinodal and binodal curves along with the glass transition boundary [Soluplus® (Soluplus), Kollidon® VA 64 (VA64), EUDRAGIT® E PO (EPO), HPMC 2910 100cP (HPMC100), and AFFINISOL™ HPMC HME 4000 (AFF4000) or 100 (AFF100)]
Hot Melt Extrusion
Hypromellose (2910 100cP) having the comparable viscosity in aqueous as AFF100 exhibited different properties when processed at elevated temperature by a twin-screw melt extruder (Fig. 2). Both AFF100 and HPMC100 were processed at 140°C, 100 rpm; however, at that condition it was not possible to extrude the HPMC100 formulation due to machine over-torqueing. To decrease the viscosity of HPMC100, the processing temperature and screw speed were increased to 160°C, 150 rpm. As seen in the figure, the AFF100 extrudate at 140°C, 100 rpm (Fig. 2a) was slightly less yellow and clear than AFF100 extruded at 160°C, 150 rpm (Fig. 2b). On the other hand, the higher temperature and shear force helped facilitate HPMC100 extrusion because the torque created during the extrusion process decreased, enabling the machine to operate. However, after being exposed to a higher temperature for a long period of time (approximately 15 min), together with more energy input caused by a higher rpm, the extrudate was burned as observed upon exiting (Fig. 2c). The results demonstrated that at similar HME process conditions, currently available HPMC was difficult to extrude while the newly designed AFFINISOL™ HPMC HME was much more amendable to process by HME.
Fig. 2.
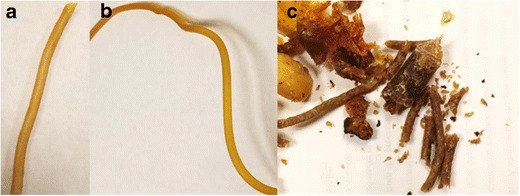
Extrudate of 30% CBZ and 70% a AFF100 at 140°C, 100 rpm, b AFF100, and c HPMC100 at 160°C, 150 rpm, using Leistritz Nano-16
Moreover, Soluplus, VA64, EPO, and another grade of AFFINISOL™ HPMC HME with a higher viscosity (AFF4000) were used in HME as comparisons. As shown in Fig. 3, except for the EPO formulation (white rod), all other extrudates were clear and transparent, indicating a good mixing between drug and polymers that concurred with the miscibility predicted by Flory–Huggins Theory.
Fig. 3.

Extrudate of 30% CBZ and 70% a AFF100, b AFF4000, c EPO, d VA64, e Soluplus, at 140°C, 100 rpm using Leistritz Nano-16
X-ray Powder Diffraction
XRD diffractograms of the unprocessed powders (polymers and CBZ) are shown in Fig. 4. Bulk CBZ powder showed characteristic crystalline peaks at 2θ = 15.2°, 15.8°, and 27.4°, which agreed with the CBZ P-monoclinic form III pattern (29). No crystalline peaks were observed in the patterns of the extrudates except for the EPO extrudate which exhibited characteristic crystalline peaks at 2θ = 12.8°, 18.9°, and 19.6°, corresponding to CBZ form I (29). Therefore, within these extrudates CBZ was confirmed to be in the amorphous or molecular state, or the crystallinity was too low to be detected by XRD.
Fig. 4.
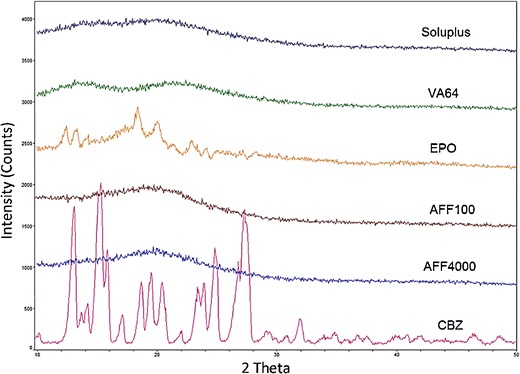
XRD patterns of extrudate containing 30% CBZ and 70% polymer (listed above each XRD signal line; see legend for Fig. 1 for abbreviations of extrudates)
Modulated Differential Scanning Calorimetry
The thermograms of bulk CBZ and CBZ-polymer extrudates are shown in Fig. 5. Bulk CBZ, EPO, AFF100, and AFF4000 extrudates exhibited endothermic peaks that indicated the existence of crystalline CBZ. For bulk CBZ, three events were observed as described in previous reports (29,30): (1) the endothermic peak observed at 175.4°C was attributed to the melting of CBZ form III (P-monoclinic); (2) a very small exothermic peak was observed at 181.7°C because form I CBZ crystal generates during heating process; (3) the third event observed at 195.7°C is attributed to the melting of form I (triclinic). For EPO, AFF100, and AFF4000, however, the observed melting points did not match the endothermic peak of bulk CBZ. Soluplus and VA64 extrudates were amorphous due to the lack of any observed endothermic peak.
Fig. 5.
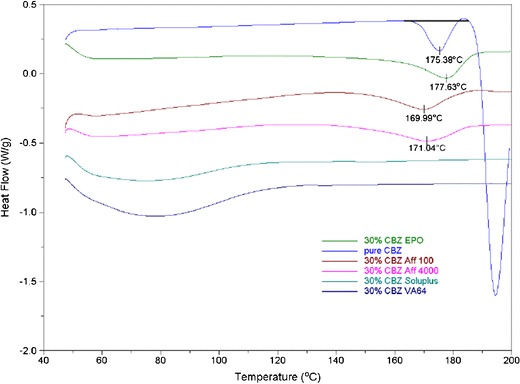
DSC thermograms of CBZ and extrudates containing 30% CBZ and 70% polymer (see legend for Fig. 1 for abbreviations of extrudates)
Raman and FTIR Spectroscopy
Raman spectra of crystalline (form III) and amorphous CBZ are shown in Fig. 6. There are substantial changes in the frequencies, intensities, and peak shapes of bands at 253, 374, 723, 768, 873, 987, 1222, 1250, 1412, and 1566 cm−1 from the crystalline to the amorphous form. The Raman spectra of CBZ extrudates in AFF100, AFF4000, EPO, and VA64 were dominated by bands from CBZ (data not shown). An overlay of the 1600 cm−1 region (Fig. 7) illustrates the spectral changes among crystalline CBZ, amorphous CBZ, and CBZ-polymer extrudates. The Raman spectra of CBZ-polymer extrudates were not consistent with either crystalline (form III) CBZ or amorphous CBZ, which indicated that all of the polymers had substantial interactions with CBZ.
Fig. 6.
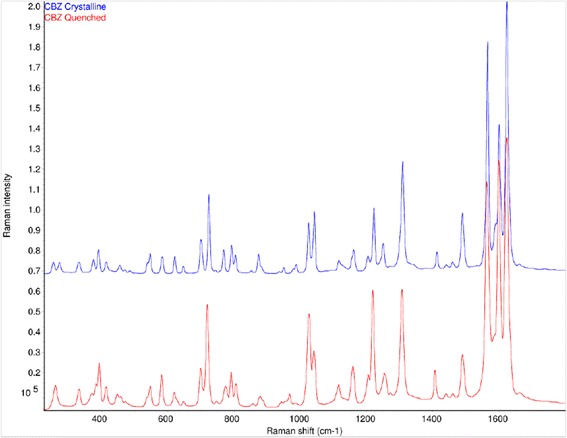
Raman spectra of crystalline (top) and amorphous CBZ (bottom)
Fig. 7.
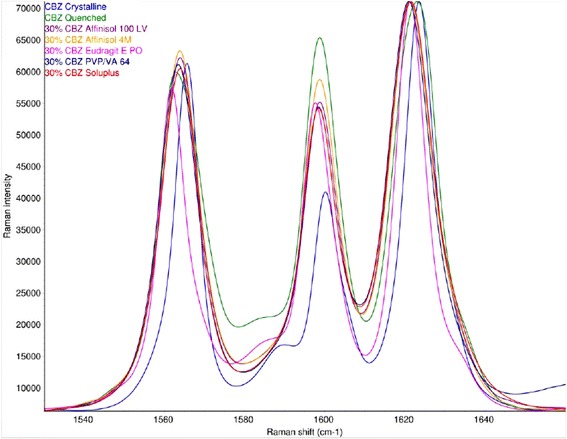
Raman spectra of the 1600 cm−1 region of crystalline CBZ (blue), amorphous CBZ (green), and 30% CBZ in AFF100 (purple), AFF4000 (orange), EPO (pink), VA 64 (dark blue), and Soluplus (red). The spectra are scaled to the strongest band for comparison. (See legend for Fig. 1 for abbreviations of extrudates)
Infrared spectra of CBZ in EPO (Fig. 8) were consistent with these observations. From the IR spectrum, the 30% CBZ formulation was partially crystalline (form I, bands at 3486 cm−1 and 1393 cm−1) (29), which was in agreement with the DSC and XRD results. However, the 15% CBZ formulation was amorphous. The carbonyl stretch of CBZ (31) occurs at 1674, 1681, 1686, and 1685 cm−1 in crystalline (form III) CBZ, amorphous CBZ, 15% CBZ in EPO, and 30% CBZ in EPO, respectively. The ≈12 cm−1 frequency increase from bulk CBZ to the CBZ-polymer extrudates indicated that there was less hydrogen bonding to the carbonyl group of CBZ in the EPO formulations.
Fig. 8.
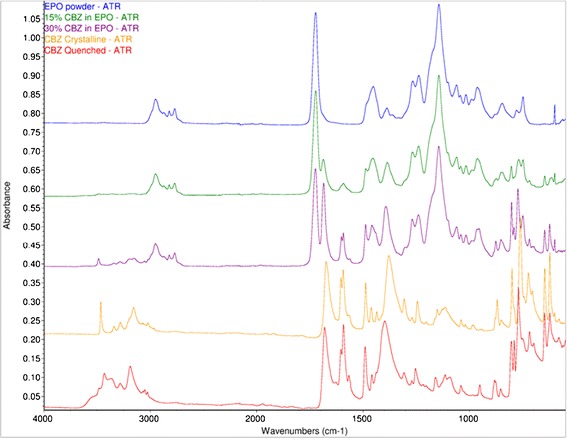
ATR FTIR spectra of EPO (blue), 15% CBZ in EPO (green), 30% CBZ in EPO (purple), crystalline CBZ (orange), and amorphous CBZ (red)
Dissolution testing
Dissolution Testing at Sink Conditions
The dissolution profiles for bulk CBZ and CBZ-polymer extrudates are shown in Fig. 9. The dissolution rate of bulk CBZ was slow; 90% release was achieved after about 60 min due to poor wettability and agglomeration. The dissolution rates of the CBZ-polymer extrudates were faster than that of bulk CBZ, except for the crystalline drug-EPO extrudate; all other drug-polymer extrudates achieved at least 90% release by 15 min. For the CBZ-EPO extrudate, a much slower release rate (40% release at 2 h) was observed. CBZ-polymer extrudates except for CBZ-EPO were well dispersed and gradually swelled and dissolved during the dissolution process. For CBZ-EPO extrudate, due to the low solubility of EUDRAGIT® E PO at neutral pH, particles stayed at the bottom of the vessel and were not dissolved in the dissolution study.
Fig. 9.
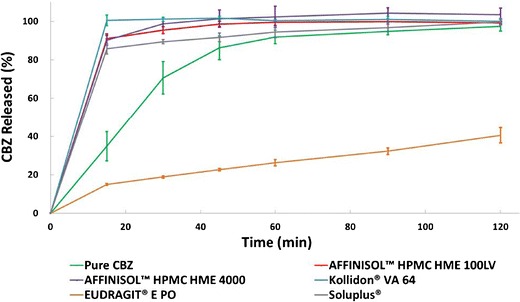
Sink condition dissolution test of extrudates and bulk CBZ containing 100 mg CBZ in 1000 mL DI water (n = 3) (see legend for Fig. 1 for abbreviations of extrudates)
Dissolution Testing at Non-sink Conditions
The results of dissolution testing at non-sink conditions are presented in Fig. 10. The CBZ-EPO extrudate exhibited the most rapid dissolution rate with approximately 55% of CBZ released in solution at 15 min, and the concentration was maintained through 360 min. Meanwhile, CBZ-AFF100 and CBZ-AFF4000 extrudates, as well as the CBZ-EPO physical mixture, released 45% CBZ by 15 min and reached 50% after 45 min; the supersaturation state did not change after that. However, CBZ-VA64 and CBZ-Soluplus extrudates dissolved remarkably more slowly than CBZ-AFF100, CBZ-AFF4000, and CBZ-EPO extrudates, and by the end of the study reached approximately the same drug release amount as bulk CBZ. Because of the limited volume of dissolution media, CBZ-AFFs (both AFF100 and AFF4000), CBZ-Soluplus, and CBZ-VA64 extrudates clumped at the beginning of the dissolution test and were not fully dissolved at the final sampling time point. CBZ-EPO extrudate, however, was dispersed fast and homogeneously in the dissolution vessel due to the solubility of EUDRAGIT® E PO at acidic conditions. Toward the end of the test, the dissolution media became a stable white suspension.
Fig. 10.

Non-sink condition dissolution test of extrudates and bulk CBZ containing 100 mg CBZ in 100 mL 0.1 HCl (n = 3) (See legend for Fig. 1 for abbreviations of extrudates)
To provide a more quantitative examination of these dissolution results, the area under the dissolution curve (AUDC) for the non-sink condition dissolution test in acidic environment was calculated by the linear trapezoidal method. These values are presented in Table I. The AUDC values further indicated the significant superiority of the CBZ-AFFINISOL HPMC HME (both AFF100 and AFF4000) extrudates which exhibited 157%, 182%, and 163% mean AUDC total values of bulk CBZ, CBZ-VA64, and CBZ-Soluplus extrudates, respectively. The AUDC of CBZ-EPO extrudate was 12% greater (not significantly) than CBZ-AFF (both AFF100 and AFF4000) extrudates.
Table I.
Area Under the Dissolution Curve (AUDC) Values for Non-sink Dissolution Testing in 0.1 N HCl
| EPO | AFF100 | AFF4000 | |
|---|---|---|---|
| AUC (mg · min) | 19,164 ± 157 | 17,064 ± 451 | 17,174 ± 628 |
| Bulk CBZ | VA64 | Soluplus | |
| AUC (mg · min) | 10,894 ± 252 | 9371 ± 282 | 10,467 ± 594 |
AUC area under curve, CBZ carbamazepine, EPO EUDRAGIT® E PO
DISCUSSION
For HME applications in pharmaceutical industry, it is crucial to successfully develop amorphous dispersions without degrading drug and other ingredients in the formulation. Therefore, identifying drug loadings and processing temperatures become necessary to ensure chemical and physical stability of the final formulation. In our study, the phase diagram obtained through Flory–Huggins modeling shown in Fig. 1b indicated that at 15% CBZ drug load, amorphous systems would be obtained at processing temperatures below 150°C for all polymers. However, modeling result suggested that 30% CBZ concentration systems would be challenging to formulate, first because 30% CBZ systems require much higher energy input to achieve the amorphous state compared to 15% CBZ systems and secondly, when extrudates are cooled, 30% CBZ systems will fall within the spinodal curve which refers to the unstable region (24). Based on the modeling results, 15% and 30% drug loadings were chosen to compare the performance of different polymers. As for processing temperature, the upper boundary allowing the amorphous system to be generated without heat-induced drug degradation was determined by the thermal stability of CBZ. In forced-degradation study (exposure to heat for 6 min), CBZ was observed to be thermally stable at temperatures lower than 190°C (Tm = 192°C). When 30% (w/w) CBZ was mixed with 70% (w/w) polymers, CBZ degradation beyond 0.5% was observed at temperatures greater than 170°C (data not shown). Both CBZ by itself and CBZ-polymer mixtures showed increasing rate of decomposition as temperature increased. Meanwhile, polymer decomposition temperatures have also been reported such as Soluplus at 250°C(32), EPO at 200°C (33), VA64 at 230°C (32), HPMC at 200°C–250°C (34). According to these results, the processing temperature should be controlled below 170°C and other conditions like screw speed and screw design should be optimized based on the extrusion outcomes.
To avoid drug degradation, HME was performed at 160°C, 150 rpm with 30% CBZ in AFF100 using the screw design in Figure 11 at 3 g/min feed rate (F1). However, as shown in Table II, at this condition, F1 only provided 85.46% drug recovery according to the HPLC result. From F1 to F3, increasing screw speeds were used. Inspecting the CBZ recovery and extrudate appearance in Table II, decrease in CBZ recovery rate and significant darkening of extrudate colors were observed due to more shear force being transferred to the materials (9,35). For CBZ, according to forced-degradation studies (Supplementary Fig. 1), drug degradation happened at 170°C and above with only heat applied to the sample. However, about 15% drug degradation was observed in F3 at 160°C, 200 rpm. It has been previously reported that significant heat will be generated inside the extruder chamber by shear and pressure at kneading elements that cannot be detected by the thermal sensors effectively, since sensors are normally built in the chamber wall which are not detecting material real temperature (on the screw) directly (36). As shown in Fig. 11, two mixing elements (30° and 60°) were used in each screw, and high shear and hot spots might occur at those areas. Moreover, unvented system was applied throughout the extruder, which helped keep the heat inside. In other words, the actual temperature that the samples were experiencing can be much higher than the set temperature for the extrusion process (36). Therefore, we believed that the degradation was attributed to localized hot spots generated by shear and pressure. For further process optimization, 100 rpm was chosen instead of a higher speed to avoid drug degradation. From F4 to F7, the effect of barrel temperature was investigated. The opaque appearance of F4 processed at 120°C as well as its XRD pattern shown in Fig. 12 indicated that CBZ was not molecularly dispersed in the polymer during the extrusion process. Considering heat is one of the most important energy inputs of the extrusion process to ensure complete mixing (36), it was determined that temperatures above 120°C were necessary to generate an amorphous system. Moreover, for F4, the low temperature resulted in high melt viscosity of polymer, which provided higher energy transfer efficiency (10); thus, more shear was transferred to CBZ causing degradation and low recovery. However, even with the increased melt viscosity at this low temperature (120°C), AFFINISOL™ HPMC HME did not result in operational failure. As for F8 and F9, different feed rates were tested. The results indicated that a faster feed rate can help increase CBZ recovery primarily because of a shorter residence time and thus less thermal and shear exposure. Ultimately, 100% CBZ recovery was achieved using 140°C, 100 rpm, at 5 g/min feed rate, and this condition was applied to all other formulations.
Fig. 11.

Screw design for all formulations processed (Leistritz Nano-16)
Table II.
Processing Conditions Optimization Using AFF100-CBZ Formulations and Screw Design Shown in Fig. 11
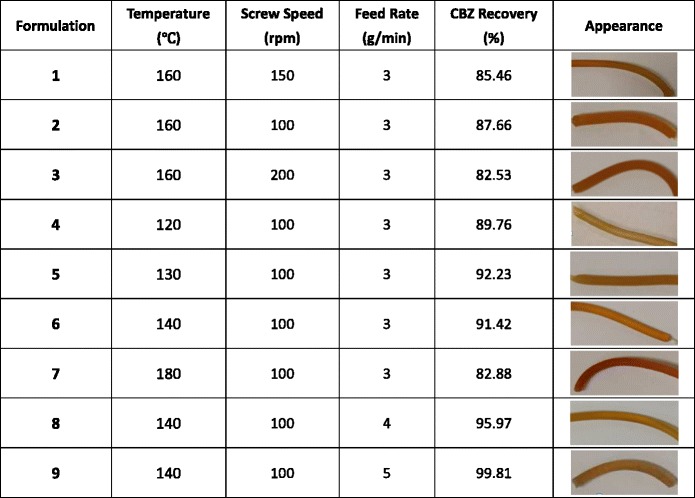
Fig. 12.
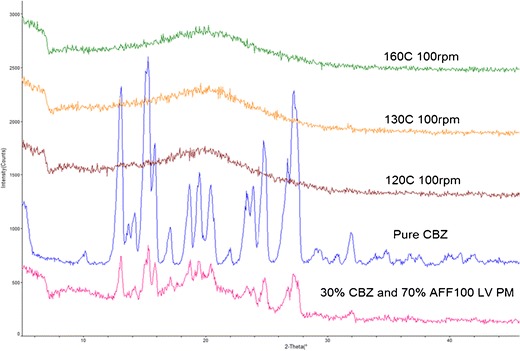
XRD patterns of extruded material using different temperature
The DSC thermogram (Fig. 5) for 30% CBZ-polymer extrudates showed a distinct endothermic peak in the CBZ-EPO formulation at 177.6°C; this incomplete amorphicity was predicted by our Flory–Huggins model. The XRD (Fig. 4) and FTIR results (Fig. 8) indicated that after extrusion, CBZ in EPO recrystallized into form I (triclinic) crystalline form, with the melting point of approximately 180°C (29). The 3°C difference in observed Tm and literature data was attributed to the molecular interaction between EPO and CBZ at elevated temperature (27), which was also predicted in our modeling result. The DSC results for VA64 and Soluplus formulations matched the information obtained from the XRD study, which showed that CBZ exists in amorphous form in those systems. Preparing of CBZ-VA64 and CBZ-Soluplus amorphous solid dispersions by HME has also been reported previously in literature (37). In contrast to our result, Djuris et al. reported immiscibility between Soluplus and carbamazepine at 30% drug load (38). However, that study was performed on a melt-fusion product instead of an HME product. For the Soluplus extrudate herein, CBZ dissolved to a higher degree in the polymer because of the shear provided by extruder; thus, the final DSC thermogram did not show any endothermic peak. Small endothermic peaks at approximately 170°C were also observed in AFF100 and AFF4000 formulations. As mentioned before, the depression of those two peaks compared with CBZ form III (P-monoclinic) (Tm approximately 175°C) was also due to the strong interaction between AFF and CBZ. In Fig. 4, however, the existence of crystalline CBZ in the AFF extrudates was not detected by XRD or Raman. Considering that Raman and FTIR have good sensitivity detecting crystalline material, we believe that the endothermic peaks detected in the DSC result are because that CBZ miscibility in both AFF100 and AFF4000 decreased at elevated temperature as predicted by the Flory–Huggins modeling results.
Dissolution testing at sink conditions (Fig. 9) showed significant enhancement of the drug dissolution rate in amorphous formulations. It has been widely reported (39,40) that the strong interaction between drug and polymer in amorphous solid dispersions can increase dissolution rate. Raman spectroscopy was used in this research to characterize the interactions between CBZ and polymers. Subsets of the Raman bands that were reasonably strong and had little or no interference from the polymers were examined in greater detail. The positions of these bands in the 30% CBZ formulations and the frequency shifts from crystalline CBZ are shown in Table III and Fig. 13. The frequency shifts are generally consistent with the amorphous form except for the 374 cm−1 (lattice vibration) and 1160 cm−1 (C–C ring stretch/C–N–C asymmetric stretch) bands. In these cases, the shifts are substantially greater than the amorphous form, which indicated that the polymers had substantial interactions with CBZ. These interactions may include contributions from both hydrogen bonding and dipole-dipole forces. But unlike amorphous formulations, CBZ-EPO extrudate showed a decreased dissolution rate compared to bulk CBZ. This is first attributed to CBZ still existing in crystalline form in the CBZ-EPO extrudate; second, EPO is not soluble but swellable and permeable at neutral pH condition according to the USP monograph, therefore, the matrix formed by EPO can prevent crystalline CBZ from dissolving into the dissolution media; thirdly, during the dissolution process, CBZ in the CBZ-EPO extrudate (form I) changes to its less soluble dihydrate form more rapidly than bulk CBZ (form III) (41).
Table III.
Frequencies of Selected Raman Bands for the Crystalline, Amorphous, and Formulated Forms of CBZ
| Raman frequency (cm−1) | |||||||
|---|---|---|---|---|---|---|---|
| Raman band assignment (59) | Crystalline CBZ | Amorphous CBZ | CBZ-AFF100 | CBZ-AFF4000 | CBZ-EPO | CBZ-VA 64 | CBZ-Soluplus |
| Lattice vibration | 374.4 | 369.3 | 364.4 | 364.8 | 369.7 | 365.2 | 365.4 |
| C–N–C stretch | 723.4 | 718.1 | 718.1 | 718.2 | 719.3 | 720.2 | 719.4 |
| C–C ring stretch/C-N-C asymmetric stretch | 1160.4 | 1158.4 | 1154.8 | 1154.8 | 1154.2 | 1154.8 | 1154.9 |
| C–N stretch (amide III) | 1222.0 | 1218.4 | 1219.4 | 1219.4 | 1217.8 | 1219.6 | 1219.4 |
| C=C ring stretch | 1565.6 | 1562.8 | 1563.9 | 1563.8 | 1561.8 | 1563.4 | 1563.9 |
| Mean difference from crystalline CBZ | −3.7 | −5.0 | −5.0 | −4.6 | −4.5 | −4.6 | |
For each formulation, the Raman spectrum of the neat polymer was subtracted from the Raman spectrum of the 30% CBZ/polymer formulation
CBZ carbamazepine, EPO EUDRAGIT® E PO
Fig. 13.
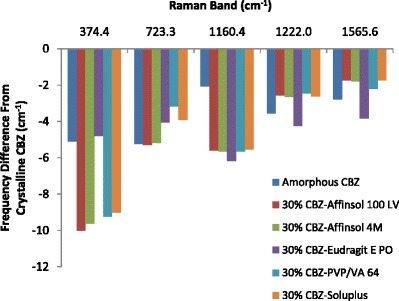
Frequency shifts of selected Raman bands from crystalline CBZ (see legend for Fig. 1 for abbreviations of extrudates)
In non-sink dissolution testings (Fig. 10), the significant dissolution rate improvement of CBZ-AFF extrudates was also observed and is because of the fact that cellulose-based polymers are excellent drug recrystallization inhibitors in amorphous systems by lowering the thermodynamic tendency of drugs toward recrystallization (42,43). As for CBZ-Soluplus and CBZ-VA64 extrudates, CBZ dissolved rapidly because it existed in its high-energy form. However, neither was able to reach supersaturation, despite being amorphous. From the Flory–Huggins modeling result of CBZ-VA64 and CBZ-Soluplus systems shown in Fig. 1, both extrudates were in the unstable state with low system mobility (within spinodal curve and below Tg of the CBZ-polymer system) when cooled down to room temperature after extrusion. In that state, phase separation is highly favorable (27). However, the reason why CBZ was amorphous may be because of the low mobility of these systems providing resistance to drug recrystallization (44). When calculating χ at room temperature, instead of using an experimental method such as the melting point depression to estimate the interaction parameter χ at elevated temperature (25), the solubility parameters were used. The limitation of using the solubility parameter method in this model is that it overlooks the interactions between polymer and CBZ (45). These interactions, however, were well represented at elevated temperatures using the experimental methods (23). Therefore, the F-H modeling results of CBZ-VA64 and CBZ-Soluplus might not be accurate at room temperature.
Once the CBZ-VA64 and CBZ-Soluplus extrudates mixed with the dissolution media, the incorporation of water into CBZ-VA64 and CBZ-Soluplus extrudates initiates drug crystallization due to the decrease of system Tg, which can provide necessary system mobility for CBZ to recrystallize (46). Moreover, water dominating H-bonds and dipole forces with water-soluble polymers like VA64 and Soluplus will also result in thermodynamic driving forces for drug crystallization (47). It is known that the dissolution advantage of amorphous solids can be negated either by crystallization of the amorphous solid on contact with the dissolution medium or through rapid crystallization of the supersaturated solution (2). Therefore, CBZ-Soluplus and CBZ-VA64 extrudates lose the ability to reach supersaturation conditions as shown in Fig. 10. It should be noted that the presence of CBZ with a Tg as low as 52°C (48) may contribute to considerable Tg depression in the formulations. Therefore, system made by carrier with a higher Tg such as AFFINISOL™ HPMC HME (115°C) was more beneficial to improve physical stability of CBZ during storage and dissolution by preventing drug recrystallization or phase separation (49) compared to Soluplus® (70°C) and Kollidon® VA 64 (101°C) (32). The difference in dissolution performance between CBZ-AFF, CBZ-Soluplus, and CBZ-VA64 at non-sink condition can also be attributed to the gelification of HPMC-based polymer slowing down diffusion of water to the solid dispersion, which also decreases CBZ recrystallization rate (50).
Surprisingly, the CBZ-EPO extrudate enabled CBZ to supersaturate in acidic dissolution media and maintain supersaturation over 6 h (Fig. 10). Based on the structure of CBZ and EPO, it is hypothesized that this result is due to cation-π interactions between CBZ and ionized EPO polymer. The most studied cation-π interactions involve binding between an aromatic π-system and an alkali metal or nitrogenous cation. Numerous studies have shown the existence of cation–π interactions in protein structures (51), protein–ligand (52), and protein–DNA complexes (53). It has been revealed that the preferential localization of amine groups are close to aromatic rings (54). In particular, it is found that the positive charge of amine groups makes favorable interactions with the π-electron cloud of aromatic side chains. The optimal interaction geometry places the cation in Van der Waals contact with the aromatic ring, centered on top of the π face along the sixfold axis (55). This cation-π interaction, electrostatic in nature, is calculated to be more stabilizing than analogous salt-bridge interactions and comparable with hydrogen bonding (56,57). Based on these literature studies, when ionized, EPO will generate the nitrogenous cation that can interact with the aromatic π-system in CBZ. Moreover, EPO does not ionize above pH 5.0 (58); therefore, the cation-π interaction does not exist at neutral conditions. Thus, the slow release rate of CBZ from the EPO extrudate in neutral media (Fig. 9) also supports this cation-π interaction hypothesis. On the other hand, it was also found that CBZ-EPO extrudate showed a higher dissolution rate of CBZ compared to the other extrudates. Besides the interaction between EPO and CBZ mentioned above, CBZ-EPO extrudate was better dispersed in acidic condition as observed in the experiment, which contributed to the higher dissolution rate as well.
CONCLUSIONS
In this study, a co-rotating twin-screw extruder was used to evaluate the modified grades of hypromellose AFFINISOL™ HPMC HME 100LV and AFFINISOL™ HPMC HME 4M. The results revealed that these polymers are readily processed by HME without plasticizers and act as effective precipitation inhibitors of drug. Different extrusion conditions were tested on these new polymers, demonstrating that these modified HPMC polymers can serve as excellent carriers (polymers) for HME solid dispersions over a broad temperature range. Moreover, the newly developed HPMC made extruding viscous HPMC polymer possible (AFFINISOL™ HPMC HME 4M) and, therefore, has the potential of being used as a sustained release excipient in a HME process.
Electronic supplementary material
Below is the link to the electronic supplementary material.
(DOCX 91.5 kb)
Acknowledgments
The authors would like to thank The Dow Chemical Company for sponsoring this work, Jamie Stanley for collecting for the Raman spectra, and Professor Ben Liu (Medicinal Chemistry) for his help confirming the cation-π interactions between CBZ and ionized EPO.
™Trademark of The Dow Chemical Company (“Dow”) or an affiliated company of Dow.
Soluplus® and Kollidon® are registered trademarks of BASF Corporation EUDRAGIT® is a registered trademark of Evonik Industries.
References
- 1.Keseru GM, Makara GM. The influence of lead discovery strategies on the properties of drug candidates. Nat Rev Drug Discov. 2009;8(3):203–12. doi: 10.1038/nrd2796. [DOI] [PubMed] [Google Scholar]
- 2.Alonzo D, Zhang GZ, Zhou D, Gao Y, Taylor L. Understanding the behavior of amorphous pharmaceutical systems during dissolution. Pharm Res. 2010;27(4):608–18. doi: 10.1007/s11095-009-0021-1. [DOI] [PubMed] [Google Scholar]
- 3.Serajuddin ATM. Solid dispersion of poorly water-soluble drugs: early promises, subsequent problems, and recent breakthroughs. J Pharm Sci. 1999;88(10):1058–66. doi: 10.1021/js9900396. [DOI] [PubMed] [Google Scholar]
- 4.Chauhan B, Shimpi S, Paradkar A. Preparation and characterization of etoricoxib solid dispersions using lipid carriers by spray drying technique. AAPS PharmSciTech. 2005;6(3):E405–E9. doi: 10.1208/pt060350. [DOI] [PMC free article] [PubMed] [Google Scholar]
- 5.Shah N, Sandhu H, Phuapradit W, Pinal R, Iyer R, Albano A, et al. Development of novel microprecipitated bulk powder (MBP) technology for manufacturing stable amorphous formulations of poorly soluble drugs. Int J Pharm. 2012;438(1–2):53–60. doi: 10.1016/j.ijpharm.2012.08.031. [DOI] [PubMed] [Google Scholar]
- 6.O’Donnell KP, Cai Z, Schmerler P, Williams RO., 3rd Atmospheric freeze drying for the reduction of powder electrostatics of amorphous, low density, high surface area pharmaceutical powders. Drug Dev Industr Pharma. 2012;39(2):205–17. doi: 10.3109/03639045.2012.669385. [DOI] [PubMed] [Google Scholar]
- 7.Hughey J, Dinunzio J, Bennett R, Brough C, Miller D, Ma H, et al. Dissolution enhancement of a drug exhibiting thermal and acidic decomposition characteristics by fusion processing: a comparative study of hot melt extrusion and Kinetisol® dispersing. AAPS PharmSciTech. 2010;11(2):760–74. doi: 10.1208/s12249-010-9431-y. [DOI] [PMC free article] [PubMed] [Google Scholar]
- 8.El-Egakey MA, Soliva M, Speiser P. Hot extruded dosage forms. I. Technology and dissolution kinetics of polymeric matrices. Pharm Acta Helv. 1971;46(1):31–52. [PubMed] [Google Scholar]
- 9.Breitenbach J. Melt extrusion: from process to drug delivery technology. Eur J Pharm Biopharm. 2002;54(2):107–17. doi: 10.1016/S0939-6411(02)00061-9. [DOI] [PubMed] [Google Scholar]
- 10.Prodduturi S, Urman K, Otaigbe J, Repka M. Stabilization of hot-melt extrusion formulations containing solid solutions using polymer blends. AAPS PharmSciTech. 2007;8(2):E152–E61. doi: 10.1208/pt0802050. [DOI] [PMC free article] [PubMed] [Google Scholar]
- 11.Crowley MM, Zhang F, Repka MA, Thumma S, Upadhye SB, Kumar Battu S, et al. Pharmaceutical applications of hot-melt extrusion: part I. Drug Dev Industr Pharma. 2007;33(9):909–26. doi: 10.1080/03639040701498759. [DOI] [PubMed] [Google Scholar]
- 12.Forster A, Hempenstall J, Rades T. Characterization of glass solutions of poorly water-soluble drugs produced by melt extrusion with hydrophilic amorphous polymers. J Pharm Pharmacol. 2001;53(3):303–15. doi: 10.1211/0022357011775532. [DOI] [PubMed] [Google Scholar]
- 13.Swarbrick J, Boylan JC. Encyclopedia of pharmaceutical technology: Volume 20-Supplement 3: CRC; 2000.
- 14.Jani R, Patel D. Hot melt extrusion: an industrially feasible approach for casting orodispersible film. Asian J Pharmaceut Sci. 2015;10(4):292–305. doi: 10.1016/j.ajps.2015.03.002. [DOI] [Google Scholar]
- 15.Bennett R, Keen J, Bi Y, Porter S, Dürig T, Mcginity J. Investigation of the interactions of enteric and hydrophilic polymers to enhance dissolution of griseofulvin following hot melt extrusion processing. J Pharma Pharma. 2015;67(7):918–38. doi: 10.1111/jphp.12388. [DOI] [PubMed] [Google Scholar]
- 16.Konno H, Handa T, Alonzo D, Taylor L. Effect of polymer type on the dissolution profile of amorphous solid dispersions containing felodipine. Eur J Pharm Biopharm. 2008;70(2):493–9. doi: 10.1016/j.ejpb.2008.05.023. [DOI] [PubMed] [Google Scholar]
- 17.Six K, Berghmans H, Leuner C, Dressman J, Van Werde K, Mullens J, et al. Characterization of solid dispersions of itraconazole and hydroxypropylmethylcellulose prepared by melt extrusion, part II. Pharm Res. 2003;20(7):1047–54. doi: 0724-8741/03/0700-1047/0. [DOI] [PubMed]
- 18.Verreck G, Six K, Van den Mooter G, Baert L, Peeters J, Brewster ME. Characterization of solid dispersions of itraconazole and hydroxypropylmethylcellulose prepared by melt extrusion—part I. International Journal of Pharmaceutics. 2003;251(1):165–74. doi: 0378-5173/02. [DOI] [PubMed]
- 19.O’Donnell, K. P. and W. H. H. Woodward. Dielectric spectroscopy for the determination of the glass transition temperature of pharmaceutical solid dispersions. Drug Dev Industr Pharma. 2014: 1–10. [DOI] [PubMed]
- 20.Flory PJ. Thermodynamics of high polymer solutions. J Chem Phys. 1942;10(1):51–61. doi: 10.1063/1.1723621. [DOI] [Google Scholar]
- 21.Huggins ML. Thermodynamic properties of solutions of long-chain compounds. Ann N Y Acad Sci. 1942;43(1):1–32. doi: 10.1111/j.1749-6632.1942.tb47940.x. [DOI] [Google Scholar]
- 22.Marsac P, Li T, Taylor L. Estimation of drug–polymer miscibility and solubility in amorphous solid dispersions using experimentally determined interaction parameters. Pharm Res. 2009;26(1):139–51. doi: 10.1007/s11095-008-9721-1. [DOI] [PubMed] [Google Scholar]
- 23.Lin D, Huang Y. A thermal analysis method to predict the complete phase diagram of drug–polymer solid dispersions. Int J Pharm. 2010;399(1–2):109–15. doi: 10.1016/j.ijpharm.2010.08.013. [DOI] [PubMed] [Google Scholar]
- 24.Zhao Y, Inbar P, Chokshi HP, Malick AW, Choi DS. Prediction of the thermal phase diagram of amorphous solid dispersions by Flory–Huggins theory. J Pharm Sci. 2011;100(8):3196–207. doi: 10.1002/jps.22541. [DOI] [PubMed] [Google Scholar]
- 25.Tian Y, Booth J, Meehan E, Jones DS, Li S, Andrews GP. Construction of drug–polymer thermodynamic phase diagrams using Flory–Huggins interaction theory: identifying the relevance of temperature and drug weight fraction to phase separation within solid dispersions. Mol Pharm. 2012;10(1):236–48. doi: 10.1021/mp300386v. [DOI] [PubMed] [Google Scholar]
- 26.Bellantone RA, Patel P, Sandhu H, Choi DS, Singhal D, Chokshi H, et al. A method to predict the equilibrium solubility of drugs in solid polymers near room temperature using thermal analysis. J Pharm Sci. 2012;101(12):4549–58. doi: 10.1002/jps.23319. [DOI] [PubMed] [Google Scholar]
- 27.Marsac P, Shamblin S, Taylor L. Theoretical and practical approaches for prediction of drug–polymer miscibility and solubility. Pharm Res. 2006;23(10):2417–26. doi: 10.1007/s11095-006-9063-9. [DOI] [PubMed] [Google Scholar]
- 28.Fountain AW, Vickers TJ, Mann CK. Factors that affect the accuracy of Raman shift measurements on multichannel spectrometers. Appl Spectrosc. 1998;52(3):462–8. doi: 0003–7028 / 98 / 5203-0462$2.00 / 0.
- 29.Grzesiak AL, Lang M, Kim K, Matzger AJ. Comparison of the four anhydrous polymorphs of carbamazepine and the crystal structure of form I. J Pharm Sci. 2003;92(11):2260–71. doi: 10.1002/jps.10455. [DOI] [PubMed] [Google Scholar]
- 30.Naima Z, Siro T, Juan-Manuel G-D, Chantal C, René C, Jerome D. Interactions between carbamazepine and polyethylene glycol (PEG) 6000: characterisations of the physical, solid dispersed and eutectic mixtures. Eur J Pharm Sci. 2001;12(4):395–404. doi: 10.1016/S0928-0987(00)00168-8. [DOI] [PubMed] [Google Scholar]
- 31.Rustichelli C, Gamberini G, Ferioli V, Gamberini MC, Ficarra R, Tommasini S. Solid-state study of polymorphic drugs: carbamazepine. J Pharm Biomed Anal. 2000;23(1):41–54. doi: 10.1016/S0731-7085(00)00262-4. [DOI] [PubMed] [Google Scholar]
- 32.Kolter K, Karl M, Gryczke A, Ludwigshafen am Rhein B. Hot-melt extrusion with BASF pharma polymers: extrusion compendium: BASF; 2012.
- 33.McGinity JW, Felton LA. Aqueous polymeric coatings for pharmaceutical dosage forms: CRC Press; 2013.
- 34.Coppens K, Hall M, Larsen P, Mitchell S, Nguyen P, Read M, et al., editors. Thermal and rheological evaluation of pharmaceutical excipients for hot melt extrusion. AAPS Annual Meeting and Exposition, Baltimore, MD; 2004.
- 35.Hughey JR, Keen JM, Miller DA, Brough C, Mcginity JW. Preparation and characterization of fusion processed solid dispersions containing a viscous thermally labile polymeric carrier. Int J Pharm. 2012;438(1–2):11–9. doi: 10.1016/j.ijpharm.2012.08.032. [DOI] [PubMed] [Google Scholar]
- 36.Martin C. Twin screw extrusion for pharmaceutical processes. In: Repka MA, Langley N, Dinunzio J, editors. Melt extrusion. New York: Springer; 2013. pp. 47–79. [Google Scholar]
- 37.Liu J, Cao F, Zhang C, Ping Q. Use of polymer combinations in the preparation of solid dispersions of a thermally unstable drug by hot-melt extrusion. Acta Pharmaceut Sinica B. 2013;3(4):263–72. doi: 10.1016/j.apsb.2013.06.007. [DOI] [Google Scholar]
- 38.Djuris J, Nikolakakis I, Ibric S, Djuric Z, Kachrimanis K. Preparation of carbamazepine–Soluplus® solid dispersions by hot-melt extrusion, and prediction of drug–polymer miscibility by thermodynamic model fitting. Eur J Pharm Biopharm. 2013;84(1):228–37. doi: 10.1016/j.ejpb.2012.12.018. [DOI] [PubMed] [Google Scholar]
- 39.Miller DA, Mcconville JT, Yang W, Williams RO, Mcginity JW. Hot-melt extrusion for enhanced delivery of drug particles. J Pharm Sci. 2007;96(2):361–76. doi: 10.1002/jps.20806. [DOI] [PubMed] [Google Scholar]
- 40.Leuner C, Dressman J. Improving drug solubility for oral delivery using solid dispersions. Eur J Pharm Biopharm. 2000;50(1):47–60. doi: 10.1016/S0939-6411(00)00076-X. [DOI] [PubMed] [Google Scholar]
- 41.Kobayashi Y, Ito S, Itai S, Yamamoto K. Physicochemical properties and bioavailability of carbamazepine polymorphs and dihydrate. Int J Pharm. 2000;193(2):137–46. doi: 10.1016/S0378-5173(99)00315-4. [DOI] [PubMed] [Google Scholar]
- 42.Tanno F, Nishiyama Y, Kokubo H, Obara S. Evaluation of hypromellose acetate succinate (HPMCAS) as a carrier in solid dispersions. Drug Dev Industr Pharma. 2004;30(1):9–17. doi: 10.1081/DDC-120027506. [DOI] [PubMed] [Google Scholar]
- 43.Mehuys E, Vervaet C, Gielen I, Van Bree H, Remon JP. In vitro and in vivo evaluation of a matrix-in-cylinder system for sustained drug delivery. J Control Release. 2004;96(2):261–71. doi: 10.1016/j.jconrel.2004.01.023. [DOI] [PubMed] [Google Scholar]
- 44.Matsumoto T, Zografi G. Physical properties of solid molecular dispersions of indomethacin with poly(vinylpyrrolidone) and poly(vinylpyrrolidone-co-vinyl-acetate) in relation to indomethacin crystallization. Pharm Res. 1999;16(11):1722–8. doi: 10.1023/A:1018906132279. [DOI] [PubMed] [Google Scholar]
- 45.Barton AFM. Solubility parameters. Chem Rev. 1975;75(6):731–53. doi: 10.1021/cr60298a003. [DOI] [Google Scholar]
- 46.Hancock B, Zografi G. The relationship between the glass transition temperature and the water content of amorphous pharmaceutical solids. Pharm Res. 1994;11(4):471–7. doi: 10.1023/A:1018941810744. [DOI] [PubMed] [Google Scholar]
- 47.Crowley KJ, Zografi G. Water vapor absorption into amorphous hydrophobic drug/poly(vinylpyrrolidone) dispersions. J Pharm Sci. 2002;91(10):2150–65. doi: 10.1002/jps.10205. [DOI] [PubMed] [Google Scholar]
- 48.Murphy D, Rodriguez-Cintron F, Langevin B, Kelly RC, Rodriguez-Hornedo N. Solution-mediated phase transformation of anhydrous to dihydrate carbamazepine and the effect of lattice disorder. Int J Pharmaceut. 2002;246(1–2):121–34. doi: 10.1016/S0378-5173(02)00358-7. [DOI] [PubMed] [Google Scholar]
- 49.Sotthivirat S, Mckelvey C, Moser J, Rege B, Xu W, Zhang D. Development of amorphous solid dispersion formulations of a poorly water-soluble drug, MK-0364. Int J Pharm. 2013;452(1–2):73–81. doi: 10.1016/j.ijpharm.2013.04.037. [DOI] [PubMed] [Google Scholar]
- 50.Goddeeris C, Willems T, Van den Mooter G. Formulation of fast disintegrating tablets of ternary solid dispersions consisting of TPGS 1000 and HPMC 2910 or PVPVA 64 to improve the dissolution of the anti-HIV drug UC 781. Eur J Pharm Sci. 2008;34(4–5):293–302. doi: 10.1016/j.ejps.2008.05.005. [DOI] [PubMed] [Google Scholar]
- 51.Minoux H, Chipot C. Cation−π interactions in proteins: can simple models provide an accurate description? J Am Chem Soc. 1999;121(44):10366–72. doi: 10.1021/ja990914p. [DOI] [Google Scholar]
- 52.Meyer EA, Castellano RK, Diederich F. Interactions with aromatic rings in chemical and biological recognition. Angew Chem Int Ed. 2003;42(11):1210–50. doi: 10.1002/anie.200390319. [DOI] [PubMed] [Google Scholar]
- 53.Wintjens R, Liévin J, Rooman M, Buisine E. Contribution of cation-π interactions to the stability of protein-DNA complexes. J Mol Biol. 2000;302(2):393–408. doi: 10.1006/jmbi.2000.4040. [DOI] [PubMed] [Google Scholar]
- 54.Crowley PB, Golovin A. Cation–π interactions in protein–protein interfaces. Protein Struct Funct Bioinform. 2005;59(2):231–9. doi: 10.1002/prot.20417. [DOI] [PubMed] [Google Scholar]
- 55.Tsuzuki S, Yoshida M, Uchimaru T, Mikami M. The origin of the cation/π interaction: the significant importance of the induction in Li+ and Na+ complexes. J Phys Chem A. 2001;105(4):769–73. doi: 10.1021/jp003287v. [DOI] [Google Scholar]
- 56.Gallivan JP, Dougherty DA. A computational study of cation−π interactions vs salt bridges in aqueous media: implications for protein engineering. J Am Chem Soc. 2000;122(5):870–4. doi: 10.1021/ja991755c. [DOI] [Google Scholar]
- 57.Zhong W, Gallivan JP, Zhang Y, Li L, Lester HA, Dougherty DA. From ab initio quantum mechanics to molecular neurobiology: a cation–π binding site in the nicotinic receptor. Proc Natl Acad Sci. 1998;95(21):12088–93. doi: 10.1073/pnas.95.21.12088. [DOI] [PMC free article] [PubMed] [Google Scholar]
- 58.Jung J-Y, Yoo SD, Lee S-H, Kim K-H, Yoon D-S, Lee K-H. Enhanced solubility and dissolution rate of itraconazole by a solid dispersion technique. Int J Pharm. 1999;187(2):209–18. doi: 10.1016/S0378-5173(99)00191-X. [DOI] [PubMed] [Google Scholar]
- 59.O’Brien LE, Timmins P, Williams AC, York P. Use of in situ FT-Raman spectroscopy to study the kinetics of the transformation of carbamazepine polymorphs. J Pharm Biomed Anal. 2004;36(2):335–40. doi: 10.1016/j.jpba.2004.06.024. [DOI] [PubMed] [Google Scholar]
Associated Data
This section collects any data citations, data availability statements, or supplementary materials included in this article.
Supplementary Materials
(DOCX 91.5 kb)


