Abstract
Brown adipose tissue (BAT) dissipates chemical energy as heat and can counteract obesity. MicroRNAs are emerging as key regulators in development and disease. Combining microRNA and mRNA microarray profiling followed by bioinformatic analyses, we identified miR‐455 as a new regulator of brown adipogenesis. miR‐455 exhibits a BAT‐specific expression pattern and is induced by cold and the browning inducer BMP7. In vitro gain‐ and loss‐of‐function studies show that miR‐455 regulates brown adipocyte differentiation and thermogenesis. Adipose‐specific miR‐455 transgenic mice display marked browning of subcutaneous white fat upon cold exposure. miR‐455 activates AMPKα1 by targeting HIF1an, and AMPK promotes the brown adipogenic program and mitochondrial biogenesis. Concomitantly, miR‐455 also targets the adipogenic suppressors Runx1t1 and Necdin, initiating adipogenic differentiation. Taken together, the data reveal a novel microRNA‐regulated signaling network that controls brown adipogenesis and may be a potential therapeutic target for human metabolic disorders.
Keywords: brown adipogenesis, differentiation, metabolism, microRNA, UCP1
Subject Categories: Development & Differentiation, RNA Biology, Signal Transduction
Introduction
Obesity is a pandemic and major contributor to metabolic syndrome and disorders such as type 2 diabetes, cardiovascular disease, and some cancers. Of the two types of adipocytes, white adipocytes specialize in energy storage, while brown adipocytes specialize in thermogenic energy expenditure 1. Adult humans have functional brown adipose tissue (BAT) 2, 3, 4, 5, 6, raising the possibility of counteracting obesity through enhancing the development and activity of brown adipocytes. In addition to the classical BAT located in the interscapular depot of rodents, recruitable BAT (also known as “inducible,” “beige,” or “brite” BAT) represents UCP1‐expressing brown adipocytes emerging in subcutaneous white adipose tissue (sWAT) upon stimulation 7.
Increasing evidence has demonstrated that microRNAs, a class of short non‐coding RNAs, represent a fundamental layer in the regulation of gene expression 8 and are important regulators of diverse biological processes such as development, disease, and establishment of cell identity 9. Recently, microRNAs, including miR‐193b/365 10, miR‐196a 11, miR‐155 12, and miR‐133 13, have been reported to modulate brown adipocyte differentiation by targeting adipogenic regulators. Brown adipogenesis is a complex process requiring coordination of multiple regulators and signaling pathways. It has been suggested that microRNAs form links to regulate BAT development by affecting the expression of key genes 14. However, it remains uncertain how microRNAs may modulate and integrate multiple signaling networks leading to mitochondria biogenesis and UCP1 expression, the defining signature of brown adipogenesis. We and others have previously demonstrated that bone morphogenetic protein (BMP) 7 is essential for the development of both classical BAT 15, 16 and recruitable beige fat 17, 18, 19 Additionally, the BMP signaling pathway can regulate microRNA biogenesis 20. We therefore hypothesized that microRNAs may mediate BMP7's effect in regulating brown/beige adipocyte differentiation and function. Pairing microRNA and mRNA microarray profiling with mirBridge bioinformatic analysis 21, here we show that miR‐455, a BMP7‐induced microRNA, promoted brown adipogenesis of committed preadipocytes and non‐committed progenitor cells by inducing PGC1α expression and mitochondria biogenesis. We demonstrate that miR‐455 targets several key adipogenic regulators including Necdin, Runx1t1, and hypoxia‐inducible factor 1 α inhibitor (HIF1an). Necdin and Runx1t1 are important adipogenic suppressors gating an adipocyte differentiation program, while HIF1an is a hydroxylase that modifies AMP‐activated kinase α1 subunit (AMPKα1) by hydroxylation. We uncover that HIF1an can directly hydroxylate AMPKα1 and thereby inhibit its activity. Thus, miR‐455 suppresses Necdin and Runx1t1 to initiate adipogenic program, and suppresses HIF1an to activate AMPKα1 which in turn acts as a metabolic trigger to induce a brown adipogenic program.
Results
Identification of microRNAs regulating brown adipocyte differentiation
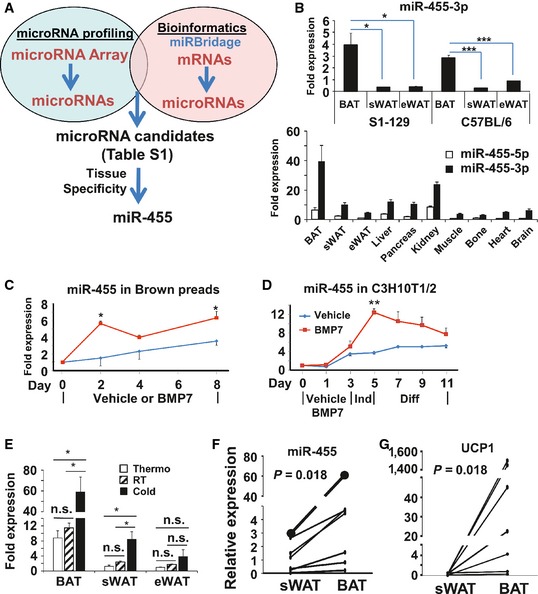
Most microRNAs regulate gene expression by targeting the 3′ UTR of mRNAs, leading to translational repression and/or mRNA degradation. It remains a challenge to identify candidate microRNAs and targets involved in a given signaling pathway since multiple microRNAs may be involved and each can have hundreds of predicted targets. To this end, we undertook a multipronged approach by combining microRNA and mRNA expression profiling followed by computational analysis using mirBridge 21 to identify candidate microRNAs that may regulate brown adipocyte differentiation (Fig 1A). We have previously demonstrated that the developmental regulator BMP7 can trigger commitment of the multipotent mesenchymal cell C3H10T1/2 to the brown adipocyte lineage 15. Thus, we first performed microRNA array analysis on C3H10T1/2 cells treated with BMP7 or vehicle to obtain a list of microRNAs differentially regulated by BMP7 stimulation (Fig 1A, Dataset EV1). Next, we performed mRNA microarray analysis on BMP7 or vehicle‐treated C3H10T1/2 cells to identify genes regulated by BMP7 (Dataset EV2), and subjected these candidate genes to mirBridge analysis 21 to predict microRNAs whose putative target sites are specifically enriched in the 3′ UTR of BMP7‐regulated genes (Dataset EV3). Since C3H10T1/2 cells became committed to the brown fat lineage upon BMP7 pretreatment 15, and the genes identified from the mRNA microarrays are potential candidates for determining brown adipogenic commitment and differentiation, therefore the microRNAs predicted by this workflow (Appendix Table S1) would involve in the regulation of brown adipocyte differentiation.
Figure 1. Identification of microRNAs mediating BMP7‐induced brown adipogenesis.
-
AmicroRNA and mRNA arrays were performed on C3H10T1/2 cells treated with vehicle or BMP7. The gene sets from the mRNA arrays were subjected to mirBridge analysis to predict the microRNAs. microRNA candidates were selected as those with up‐ or down‐regulation by > 1.5‐fold in microRNA arrays and P < 0.05 in mirBridge analysis (Appendix Table S1).
-
BmiR‐455 expression in different tissues of C57BL/6 and S1‐129 mice at the age of 5 weeks (n = 5–6).
-
C, DmiR‐455 expression during the differentiation of brown preadipocytes (C) and C3H10T1/2 cells (D). Shown is a representative of four independent experiments for each cell type.
-
EC57B/L6 mice were maintained at thermoneutral temperature, room temperature (RT), or 5°C (cold) for 7 days, and miR‐455 expression was quantified by qRT–PCR (n = 6).
-
F, GExpression of miR‐455 (F) and UCP1 (G) in human BAT versus sWAT from 7 individuals (Appendix Table S2) quantified by qRT–PCR was expressed in arbitrary units.
To further narrow down our list of putative microRNA regulators, we examined the tissue specificity of our candidates using qRT–PCR (Appendix Fig S1) and found that miR‐455‐5p and miR‐455‐3p displayed a BAT‐specific expression pattern, with miR‐455‐3p (miR‐455 hereafter) as the dominant and highly expressed form (Fig 1B). Interestingly, miR‐455‐5p expression was previously reported to be induced during brown adipocyte differentiation 22. miR‐455 expression was up‐regulated during BMP7‐induced brown adipocyte differentiation of both committed brown preadipocytes (Fig 1C) and multipotent progenitor C3H10T1/2 cells (Fig 1D). In addition, miR‐455 expression in the interscapular BAT and sWAT was induced by cold exposure (Fig 1E), suggesting that miR‐455 could potentially mediate cold‐induced thermogenesis. Importantly, the expression of miR‐455 was also significantly higher in human BAT versus human WAT collected from anatomically defined neck fat of human subjects (Appendix Table S2) in paired comparisons for each subject (P = 0.018, Fig 1F). This pattern was concordantly parallel to UCP1 expression in BAT and WAT of the same individuals (P = 0.018, Fig 1G). Thus, these data strongly suggest that miR‐455 is a genuine BAT marker for both rodents and humans.
Our data demonstrated that miR‐455 is a downstream effector of BMP7 (Fig 1A, C and D) and cold exposure (Fig 1E). BMP7 induces Smads and p38MAPK/ATF2 signaling pathways, and cold activates cAMP signaling via beta3‐adrenergic receptor. Bioinformatic analysis identified a number of Smad‐binding elements (SBEs) and cAMP‐responsive elements (CREs) present in the promoter region of miR‐455 (Appendix Fig S2). Because SBEs mediate Smads‐induced transcription and CREs are responsible for conveying p38APK/ATF2 and cAMP‐induced transcription, these data suggest that the upstream signals, such as BMP7 and cold, could directly regulate miR‐455 expression via SBEs‐ and CREs‐mediated transcriptional control.
miR‐455 promotes brown adipogenesis in committed brown and white preadipocytes and non‐committed multipotent progenitor cells in vitro
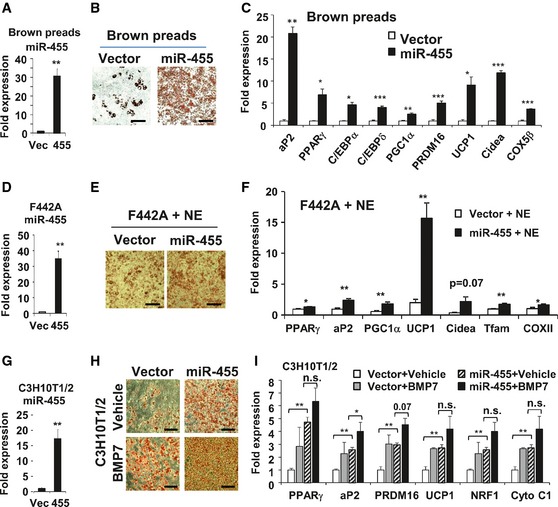
To assess the function of miR‐455, we first overexpressed miR‐455 in brown preadipocytes by lentiviral transduction (Fig 2A and Appendix Fig S3A). Overexpression of miR‐455 in brown preadipocytes induced the cells to differentiate into mature brown adipocytes with (Appendix Fig S3B and C) or without (Fig 2B and C) the normally required adipogenic inducers. This was evidenced by both lipid accumulation (Fig 2B and Appendix Fig S3B) and increased expression of adipogenic and brown fat‐selective genes (Fig 2C and Appendix Fig S3C). These results suggest that miR‐455 is capable of turning on the brown adipogenic program in committed brown fat progenitors.
Figure 2. miR‐455 overexpression induced brown adipogenesis in vitro .
-
A–CmiR‐455 expression (A), Oil Red O staining (B), and qRT–PCR analysis of gene expression quantified (C) in brown adipocytes (day 17).
-
D–FmiR‐455 expression (D), Oil Red O staining (E), and qRT–PCR analysis of gene expression (F) in 3T3‐F442A adipocytes (day 8) incubated with 100 μM norepinephrine (NE) for 4 h.
-
G–ImiR‐455 expression (G), Oil Red O staining (H), and qRT–PCR of gene expression (I) in C3H10T1/2 adipocytes (day 8).
Interestingly, while overexpression of miR‐455 in white preadipocyte 3T3‐F442A cells only modestly enhanced the differentiation (Appendix Fig S3D and E), these cells gained propensity for β‐adrenergic stimulation. When exposed to norepinephrine (NE) treatment, the expression of UCP1 was robustly increased in miR‐455‐overexpressing cells compared with control cells (Fig 2D–F). Similar results were observed in miR‐455‐overexpressing primary preadipocytes derived from sWAT (Fig EV1) and a selected population of beige fat precursor cells in sWAT based on cell surface expression of Sca‐1 (ScaPCs) 17 (Fig EV2). These data suggest that miR‐455 may work in concert with sympathetic signals to recruit beige adipocyte differentiation.
Figure EV1. miR‐455 induced brown adipogenesis of primary sWAT‐SVFs.
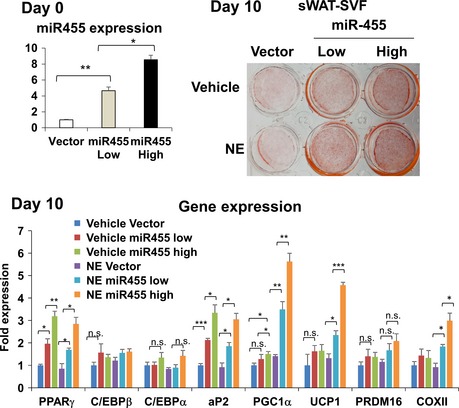
SVF was isolated from subcutaneous white adipose tissue (sWAT) of C57BL/6 mice, plated in a cell culture dish, and transduced with different dosages of miR‐455 and control (vector) lentiviruses to achieve different levels (low or high) of miR‐455 overexpression. At confluence, the cells were induced to differentiate by standard differentiation protocol (see Materials and Methods) with supplement of 1 mM rosiglitazone. On day 10, cells were treated with 100 mM norepinephrine (NE) for 4 h and stained with Oil Red O, and RNA was isolated for gene expression analysis by qRT–PCR. Data were analyzed with Student's t‐test and are presented as mean ± SEM of a representative from three independent experiments each performed in quadruplicates (*P < 0.05, **P < 0.01, and ***P < 0.001; n.s., non‐significant).
Figure EV2. miR‐455 committed sWAT‐ScaPCs to the brown adipogenic lineage.
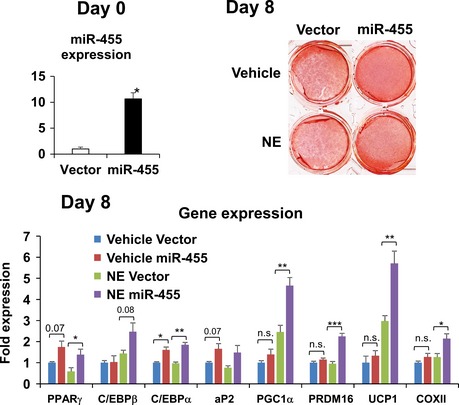
ScaPCs isolated from subcutaneous adipose tissues as described previously 17 were transduced with miR‐455 or control (vector) lentiviruses and induced to differentiate by standard differentiation protocol (see Materials and Methods). On day 8, cells were treated with 100 mM norepinephrine (NE) for 4 h and then stained with Oil Red O, and RNA was isolated for gene expression analysis by qRT–PCR. Data were analyzed with Student's t‐test and are presented as mean ± SEM of a representative from three independent experiments each performed in quadruplicates (*P < 0.05, **P < 0.01, and ***P < 0.001; n.s., non‐significant).
Furthermore, we also isolated primary preadipocytes from BAT and sWAT of wild‐type (WT) and FAT455 (aP2‐miR‐455) transgenic mice, which overexpressed miR‐455 in adipose tissue (see below), and subjected them to standard brown adipogenic differentiation in vitro. Consistent with the data obtained from established cell lines, SVFs isolated from BAT and sWAT of FAT455 mice showed significantly greater degrees of brown adipogenic differentiation compared with those from WT mice, as evidenced by both lipid content (Appendix Fig S4A) and expression of general and brown fat‐selective genes (Appendix Fig S4B and C). These data demonstrated that miR‐455 promoted brown adipogenic differentiation of primary adipogenic precursor cells.
We previously demonstrated that BMP7 prompted commitment of the multipotent C3H10T1/2 progenitor cells to a brown adipocyte 15. When subjected to standard adipogenic induction, miR‐455‐overexpressing C3H10T1/2 cells (Fig 2G) were able to differentiate into mature brown adipocytes expressing UCP1, PRDM16, and mitochondrial genes to a level comparable to that of BMP7 pretreatment (Fig 2H and I, miR‐455 + vehicle versus vector + vehicle and miR‐455 + vehicle versus vector + BMP7). BMP7 treatment, however, exhibited only trends of further enhanced expression of brown fat‐selective genes (Fig 2I, miR‐455 + vehicle versus miR‐455 + BMP7) with only aP2 expression reaching significance in miR‐455‐overexpressing cells, suggesting that BMP7 exerted a modestly additive effect on brown adipogenesis in multipotent progenitor cells which already overexpress miR‐455.
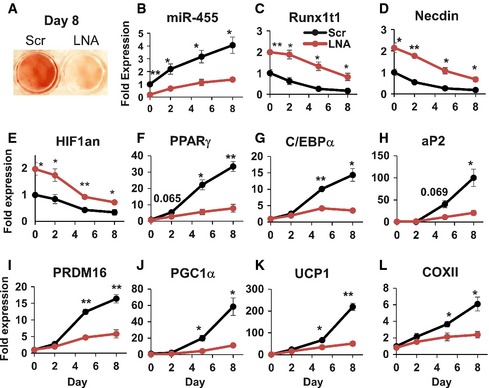
In addition, knockdown of miR‐455 in brown preadipocytes with locked nucleic acid (LNA)‐antimiR‐455 inhibitors significantly suppressed brown adipogenesis induced by standard cocktail (Fig 3 and Appendix Fig S4D) or BMP7 (Appendix Fig S4E–G), but had no effect on the expression of Leptin (a white fat marker) or MyoD (a myocyte marker) (Appendix Fig S4D), suggesting that loss of miR‐455 itself in committed brown adipocytes could not alter lineage commitment.
Figure 3. LNA‐inhibitor‐mediated knockdown of miR‐455 impaired brown adipocyte differentiation.
-
A–LBrown preadipocytes were transfected with scramble or LNA‐antimiR‐455 at 85% confluency. Two days after transfection, the cells were induced to differentiate by standard differentiation protocol (see Materials and Methods). Cells were harvested at the indicated time points. Oil Red O staining of the cells on day 8 is shown in (A). The expression levels of miR‐455 (B), its target genes (C–E) and adipogenic marker genes (F–L) were analyzed by qRT–PCR. Data were analyzed with Student's t‐test and are presented as mean ± SEM of a representative of three independent experiments each performed in quadruplicates (*P < 0.05 and **P < 0.01).
miR‐455 triggers commitment of multipotent progenitors to brown fat lineage in vivo
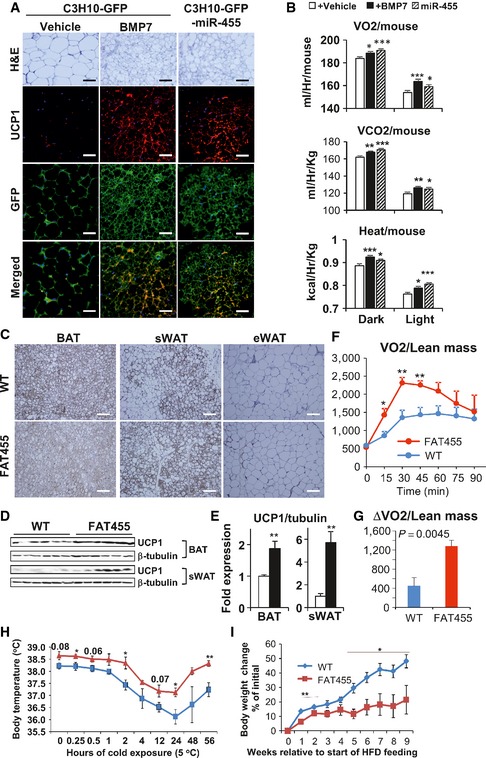
Previously, we demonstrated that implantation of the in vitro BMP7‐treated C3H10T1/2 progenitor cells into immune‐compromised mice resulted in development of brown adipose tissue 15. To determine whether the cells overexpressing miR‐455 could reconstitute brown fat in vivo, we implanted C3H10T1/2‐miR‐455 and C3H10T1/2‐GFP (control, treated with vehicle or BMP7) cells subcutaneously into athymic nude mice. Indeed, both vehicle‐treated C3H10T1/2‐miR‐455 cells and BMP7‐treated C3H10T1/2‐GFP control cells developed into multilocular UCP1‐positive brown adipocytes, whereas vehicle‐treated C3H10T1/2‐GFP cells developed into unilocular UCP1‐negative white adipocytes (Fig 4A). These results strongly support the in vitro observations that miR‐455 was able to induce brown adipogenic commitment and differentiation of multipotent progenitor cells. More importantly, when subjected to CLAMS analysis, mice receiving C3H10T1/2‐miR‐455 or C3H10T1/2‐GFP‐BMP7 implantation exhibited significantly higher oxygen consumption, CO2 production, and heat generation than the mice receiving control C3H10T1/2‐GFP‐vehicle cells (Fig 4B). These results clearly demonstrated that C3H10T1/2 cells overexpressing miR‐455 could reconstitute functional brown fat in vivo, inciting increased energy expenditure in recipient mice.
Figure 4. miR‐455 overexpression induced UCP1 expression in vivo .
-
A, BC3H10T1/2‐GFP and ‐lentimiR‐455 cells were injected into the thoracic area of male nude mice subcutaneously (n = 6/group). Five weeks after injection, the implanted cells were dissected for histology and analyzed by H&E staining and immunostaining (scale bar, 25 μm) (A); CLAMS analysis of nude mice receiving implant (B).
-
C–EUCP1 expression of FAT455 mice subjected to a 10‐day cold challenge (5°C) (n = 7/group). (C) UCP1 immunohistochemistry of adipose tissues (scale bar, 50 μm). Western blots (D) and the respective densitometry quantification normalized to tubulin (E).
-
FTime course of NE‐induced oxygen consumption in mice maintained at 5°C for 8 days (n = 6/group).
-
GMaximal NE‐induced thermogenic capacity expressed as ΔVO 2 (maximal VO 2 − basal VO 2).
-
HMice were initially maintained at room temperature and then transferred to cold incubator (5°C). Rectal body temperature was recorded at the indicated time points using thermoprobe.
-
IWT and FAT455 mice with similar initial body weight were fed with high‐fat diet (HFD) and placed under the condition of single cage pair feeding, where FAT455 mice were fed the same amount of food as WT littermates. Body weights were recorded over time.
miR‐455 regulates brown adipogenesis in vivo
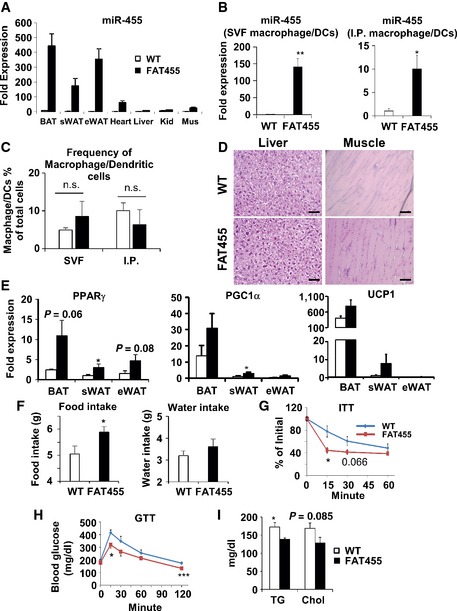
To study miR‐455 function in an adipose‐specific manner in vivo, we generated transgenic mice expressing miR‐455 under the control of the fatty acid binding protein 4 (FABP4, also known as aP2) promoter. The aP2 promoter was selected over the adiponectin promoter because the effect of miR‐455 appeared to begin during early adipocyte differentiation and the use of aP2 promoter allowed us to capture this initial stage 23. qRT–PCR confirmed that the aP2‐miR‐455 transgenic mice (referred to as FAT455 hereafter) achieved 60‐ to 350‐fold greater overexpression of miR‐455 than WT mice in all adipose tissues including interscapular (BAT), subcutaneous inguinal (sWAT), and epididymal (eWAT) (Fig EV3A). While aP2 promoter also drove expression of miR‐455 in heart, muscle, or liver, in addition to BAT and WAT, the levels of expression were much lower compared with those achieved in BAT and WAT. In addition, we did not observe any effect of miR‐455 overexpression in these tissues in terms of tissue mass and tissue morphology (Fig EV3D). To determine whether macrophages derived from the FAT455 transgenic mice overexpress miR‐455, we purified macrophage/dendritic cells from WAT‐SVF or intraperitoneal (i.p.) fluid of FAT455 mice. As expected, the levels of miR‐455 expression in macrophage/dendritic cells were elevated in FAT455 mice (Fig EV3B). However, this overexpression did not alter the number/frequency of macrophage and dendritic cells in the total SVF or intraperitoneal fluid (Fig EV3C), suggesting that miR‐455 overexpression did not affect the proliferation or differentiation of macrophage/dendritic cells.
Figure EV3. Characterization of FAT455 transgenic mice. FAT455 and WT mice aged 7–9 weeks were analyzed (n = 5–6/group).
-
AmiR‐455 expression in tissues of FAT455 transgenic mice analyzed by qRT–PCR.
-
B, CMacrophage/dendritic cells were isolated from SVF (white adipose tissue) and intraperitoneal (i.p.) fluid by FACS using anti‐F4/80 and CD11b antibodies. (B) miR‐455 expression quantified by qRT–PCR. (C) The frequency of sorted macrophage/DC cells within total parental SVF or i.p. cells.
-
DH&E staining of tissues from FAT455 mice or WT littermates, showing no visible effect of miR‐455 in liver and muscle. Scale bar, 50 μm.
-
EqRT–PCR of brown adipogenic marker gene expression in FAT455 and WT littermates kept chronically at room temperature.
-
FFood and water intake of FAT455 and WT littermates during a 36‐h period.
-
GIP‐ITT assay.
-
HIP‐GTT assay.
-
IBlood triglyceride (TG) and cholesterol (Chol) quantified by ELISA.
Data information: FAT455 and WT mice aged 7–9 weeks were analyzed (n = 5–6/group). Data were analyzed with Student's t‐test and are presented as mean ± SEM (*P < 0.05, **P < 0.01, and ***P < 0.001; n.s., non‐significant).
Interestingly, while the FAT455 mice only exhibited a trend of increased UCP1 expression in BAT and sWAT when kept at room temperature (Fig EV3E), they displayed significant increases in UCP1 expression in BAT and marked browning in sWAT, but not eWAT, upon cold challenge (Fig 4C–E), consistent with the in vitro miR‐455‐induced brown adipocyte differentiation of sWAT‐ScaPCs (Fig EV2). Importantly, the cold‐exposed FAT455 mice had significantly higher maximal thermogenic capacity compared to WT littermates in response to NE stimulation (Fig 4F and G, and Appendix Fig S5). Thus, increased expression of miR‐455 in adipose tissue enhances the propensity of fat depots for thermogenesis in response to cold. This notion was further supported by better cold resistance of FAT455 mice compared with WT littermates (Fig 4H).
More intriguingly, FAT455 mice showed an increase in food consumption and a trend of increase in water intake (Fig EV3F), likely due to compensation for the increased thermogenic energy expenditure. Therefore, we subjected the mice to pair feeding so that FAT455 mice were fed the same amount of food as WT littermates. Under pair‐fed condition, FAT455 mice displayed a significant reduction in weight gain upon high‐fat feeding compared to WT littermates (Fig 4I). As a consequence of enhanced thermogenesis of classical BAT and browning of sWAT, FAT455 mice had improved insulin sensitivity (Fig EV3G) and glucose tolerance (Fig EV3H), and better circulating lipid profile (Fig EV3I).
To determine the essential role of miR‐455 in inducing brown adipogenesis in vivo, we injected LNA‐antimiR‐455 inhibitor intraperitoneally into C57BL/6 mice to knock down miR‐455 in vivo (Appendix Fig S6A). Reducing the levels of miR‐455 in vivo significantly decreased both BAT and sWAT mass but has no effect on other tissues examined (Appendix Fig S6B). LNA‐antimiR‐455 inhibitor also suppressed the expression of UCP1, PGC1α, and PPARγ in BAT (Appendix Fig S6C) and inhibited C/EBPα expression in sWAT (Appendix Fig S6D) as compared to scramble LNA control. Histological examination showed no differences in cell size in these two adipose depots (Appendix Fig S6E). Thus, the reduced adipose tissue mass was likely caused by reduced adipocyte cell number, suggesting that LNA‐antimiR‐455 inhibitor specifically suppressed preadipocyte differentiation. Together, these data establish a critical role of miR‐455 in differentiation and function of both interscapular and recruitable BAT in vivo.
miR‐455 targets key adipogenic suppressors
Most microRNAs function by suppressing their target gene expression. To identify miR‐455 targets, we used the target prediction tools TargetScan (www.targetscan.org) and miRTarget2 (mirdb.org). These tools each projected about 200 miR‐455 targets, of which Runx1t1, Necdin, and HIF1an (hypoxia‐inducible factor 1, alpha subunit inhibitor) were among the top predicted targets. They each contain at least one highly conserved target sequence perfectly matching the 7‐mer seed region of miR‐455 (Appendix Table S3), suggesting an evolutionarily conserved function of these miR‐455/target pairs. Runx1t1 24 and Necdin 25 have been previously shown as adipogenic inhibitors. Interestingly, it was reported that HIF1an‐null mice had an elevated metabolic rate due to increased UCP1 and PGC1α expression in interscapular BAT 26. HIF1an, an asparaginyl (Asn) hydroxylase, is able to modulate the activities of key biological regulators through hydroxylation.
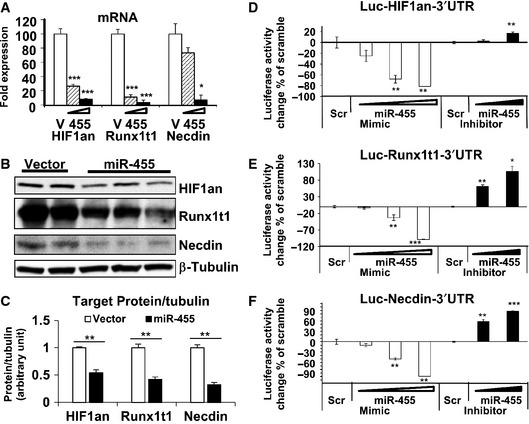
MicroRNAs inhibit their target gene expression by targeting their 3′ UTR, which induces protein translational suppression and/or mRNA degradation 27. To determine whether these three genes are direct miR‐455 targets, we quantified the expression of Runx1t1, Necdin, and HIF1an in brown preadipocytes overexpressing miR‐455 on mRNA and protein levels. Both mRNA (Fig 5A) and protein levels (Fig 5B and C) of the three genes were markedly suppressed by miR‐455 compared to control. Importantly, mRNA suppression by miR‐455 was achieved in a dose‐dependent manner (Fig 5A).
Figure 5. Molecular targets of miR‐455 in brown adipogenesis.
-
ATarget gene mRNAs were quantified by qRT–PCR in brown preadipocytes expressing different levels of miR‐455 (v, vector).
-
BProtein levels of the target genes were determined by Western blots in brown preadipocytes transduced with vector or miR‐455 lentiviruses.
-
CDensitometry quantification of Western blots in (B).
-
D–FReporter plasmids containing luciferase cDNA linked to 3′ UTR of target genes (HIF1an, Runx1t1, and Necdin) were transfected into brown preadipocytes along with different dosages of either scramble oligos (scr), miR‐455 mimics, or antimiR‐455 inhibitors and analyzed for luciferase activity.
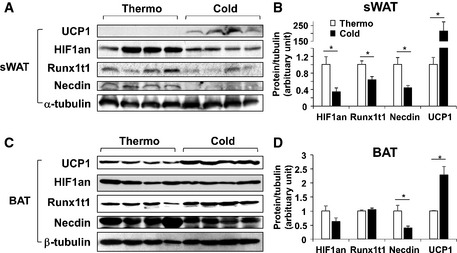
To determine whether miR‐455 regulates these three genes by targeting their 3′ UTR, we generated reporter constructs containing luciferase cDNA linked to 3′ UTR sequences of these target mRNAs. When the reporter constructs and miR‐455 mimics or inhibitors were co‐transfected into brown preadipocytes, miR‐455 mimics suppressed and miR‐455 inhibitor induced luciferase activity significantly and in a dose‐dependent manner, while scramble (Scr) did not have any effect (Fig 5D–F). Thus, miR‐455 suppressed its target gene expression by specifically binding to the 3′ UTR of the genes. These findings demonstrated that Runx1t1, Necdin, and HIF1an were genuine targets of miR‐455. The discovery of multiple targets of miR‐455 in brown adipogenic signaling is consistent with the idea of mirBridge 21 that the target sites of a microRNA could be enriched in multiple components of the same signaling pathway. Indeed, the expression of these three target genes was down‐regulated during brown adipocyte differentiation (Fig 3C–E), and also significantly suppressed by cold in sWAT (Fig EV4A and B), while cold significantly suppressed Necdin in BAT (Fig EV4C and D). This is consistent with the up‐regulation of miR‐455 during brown adipocyte differentiation (Figs 1C and D, and 3B) and by cold exposure in both BAT and sWAT (Fig 1E), patterns that highlight the function of miR‐455 for brown adipogenesis. Importantly, the expression of Runx1t1, Necdin, and HIF1an was significantly elevated when miR‐455 expression was inhibited by LNA‐antimiR‐455 (Fig 3C–E), reinforcing the notion that these three genes are direct targets of miR‐455. Interestingly, we also found that miR‐455 mediated at least part of the effect of NE on the suppression of Necdin protein expression (Appendix Fig S7).
Figure EV4. Cold exposure suppressed the miR‐455 target proteins in adipose tissues.
-
A–DC57BL/6 mice (4–7 mice/group) were maintained at thermoneutral (30°C) or cold (5°C) temperature for 7 days, and target gene expression was analyzed by Western blots (A, C) and quantified by densitometry (target protein levels normalized tubulin level) (B, D). Data were analyzed with Student's t‐test and are presented as mean ± SEM (n = 4/group, *P < 0.05).
miR‐455 activates the C/EBPβ and AMPK signaling pathways
Runx1t1 suppresses white adipogenesis by interacting with C/EBPβ and inhibiting its transcriptional activity 24. We first verified that overexpression of Runx1t1 completely blocked brown adipocyte differentiation (Appendix Fig S8A). C/EBPβ has been shown to transactivate C/EBPα, PPARγ, aP2, and PGC1α promoters 28, 29. Indeed, using chromatin immunoprecipitation and reporter assay, we demonstrated that miR‐455 significantly enhanced the binding of C/EBPβ to the CCAAT binding motif of C/EBPα, PPARγ ανδ aP2 promoters and to the CRE of PGC1α promoter (Appendix Fig S9A) and hence significantly enhanced the C/EBPβ transactivity (Appendix Fig S9B).
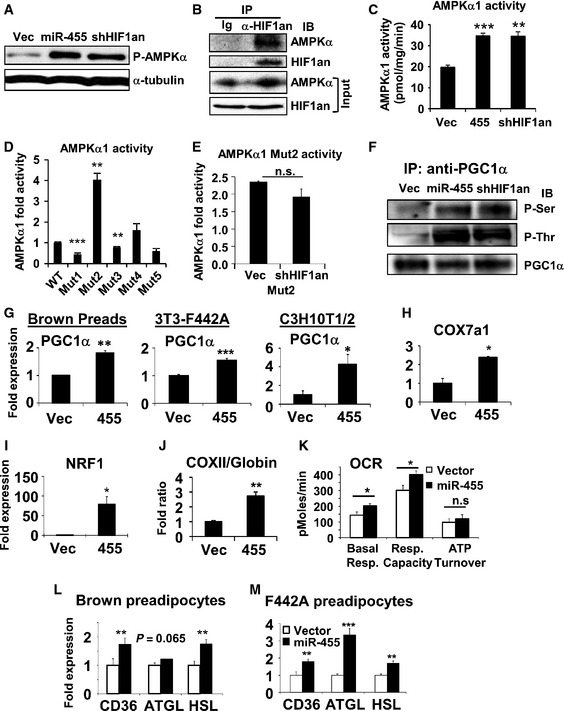
Previously, we reported that Necdin blocked brown adipogenesis by interacting with E2Fs and blunting its capability to activate PPARγ1 promoter 25. However, the mechanism by which HIF1an suppresses brown adipocyte differentiation and/or function is currently unknown. Interestingly, we found that overexpression of miR‐455 or shRNA knockdown of HIF1an induced phosphorylation of AMPKα and its downstream substrate ACC without affecting total amount of AMPKα (Figs 6A and EV5A). This was further verified in vivo in both BAT and sWAT isolated from FAT455 transgenic mice with more pronounced effect in sWAT (Fig EV5B). It has been shown that AMPK activity is increased during brown adipocyte differentiation, and siRNA knockdown of AMPK inhibits brown adipogenesis 30. Therefore, the observed activation of AMPKα could account for one of the mechanisms for miR‐455/HIF1an‐mediated brown adipogenesis.
Figure 6. miR‐455 activated AMPKα1 by suppressing HIF1an‐mediated hydroxylation of AMPKα1, leading to PGC1α induction.
-
A–FExperiments performed in brown preadipocytes transduced with the indicated lenti‐ or retroviruses. (A) Western blot analysis of AMPKα1(Thr172)‐phosphorylation. (B) Immunoprecipitation (IP) with control normal immunoglobulin (Ig) or anti‐HIF1an antibody, and probed with anti‐HIF1an and anti‐AMPKα antibodies. 10% of cell lysates loaded as input. (C) IP with anti‐AMPKα1 antibody first and then quantified for AMPKα1 activity. (D) IP with anti‐Flag agarose beads from Flag‐AMPKα1 WT or Asn>Ala mutants‐expressing brown preadipocytes, and assayed for AMPKα1 activity. (E) Flag‐AMPKα1 Mutant2‐expressing cells were transduced with empty vector or shRNA‐HIF1an lentiviruses, and then IP with anti‐Flag agarose beads. AMPK activity in precipitates was measured. (F) IP of PGC1α from cell lysates as in (A) using anti‐PGC1α antibody. Phospho‐serine and phospho‐threonine and total precipitated PGC1α were detected by Western blots.
-
GqRT–PCR analysis of PGC1α expression in the undifferentiated cells overexpressing miR‐455.
-
H–KMitochondrial gene expression (H‐I), DNA ratio of mito‐gene (COXII) versus nuclear gene (β‐globin) (J), and bioenergetic analysis by Seahorse (K) in undifferentiated C3H10T1/2 cells.
-
L, MExpression of fatty acid mobilization and lipolytic genes in brown and white preadipocytes overexpressing miR‐455 quantified by qRT–PCR.
Figure EV5. miR‐455 induced phosphorylation of AMPKalpha1 and PGC1α.
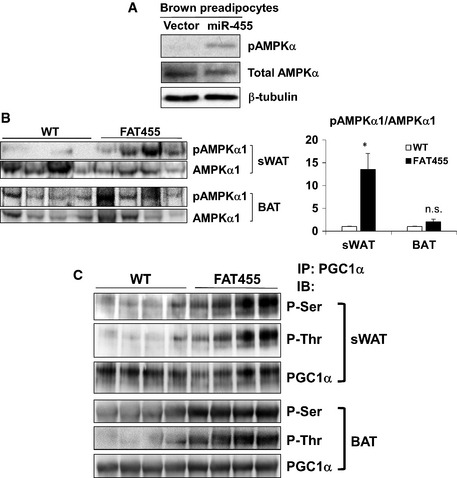
- miR‐455 induced AMPKα1 phosphorylation without affecting total AMPKα1. Western blot analysis of AMPKα in brown preadipocytes (day 0, prior to the induction of differentiation) transduced by vector or miR‐455 lentivirus.
- miR‐455 induced AMPKα1 phosphorylation in vivo. FAT455 and WT mice aged 5 weeks (n = 4) were exposed to cold (5°C) for 10 days and then sacrificed. sWAT and BAT were isolated. Western blot analysis was performed to examine AMPKα1 phosphorylation using phospho‐AMPKα1 (Thr172)‐specific antibody and AMPKα1 antibody, and densitometry quantification of the Western blots was performed using ImageQuant, presented as mean ± SEM. Student's t‐test was used for statistical analysis (*P < 0.05; n.s., non‐significant).
- miR‐455 enhanced PGC1α phosphorylation in vivo. PGC1α was immunoprecipitated from sWAT and FAT isolated from FAT455 and WT mice aged 5 weeks (n = 4) using anti‐PGC1α antibody and then probed with anti‐phospho‐serine and anti‐phospho‐threonine antibodies.
HIF1an is an Asn hydroxylase, which modulates multiple key biological regulators (such as HIF1α 31, IκB 32, Notch 33) through β‐hydroxylation of Asn residues. Thus, we hypothesized that HIF1an might suppress AMPK activity through hydroxylation. The conventional model for enzyme/substrate reaction is that the molecules physically interact with each other. Therefore, we performed immunoprecipitation assay to determine the interaction between HIF1an and AMPK. A specific anti‐HIF1an antibody efficiently co‐precipitated AMPKα in brown preadipocytes (Fig 6B), suggesting that HIF1an could physically interact with AMPKα to regulate AMPKα activity in preadipocytes. The AMPKα subunit is the catalytic subunit of AMPK and consists of two isoforms, AMPKα1 and AMPKα2, the former being the dominant isoform in BAT 34 and WAT 35, 36. To determine which AMPKα subunit interacts with HIF1an, we precipitated AMPKα proteins from preadipocytes using isoform‐specific AMPKα1 and AMPKα2 antibodies and measured AMPK activity. miR‐455 overexpression or shRNA‐mediated HIF1an knockdown significantly increased AMPKα1 activity (Fig 6C), but had no effect on AMPKα2 activity (data not shown). These data suggest that an interaction between HIF1an and AMPKα1 inhibited AMPKα1 activity.
To map the precise molecular location of AMPKα1 where HIF1an modulates its activity, we mutated five Asn residues to Ala (Appendix Fig S10A and B) that reside in regions important for AMPKα1 activity based on AMPKα1 structure 37, 38. Importantly, mutation of Asn173Ala (mutant 2), which resides within the activation loop of AMPKα1 and in proximity to the well‐defined Thr183 (conventionally named as Thr172 after initial identification in AMPKα2) phosphorylation site 37, 39, resulted in a fourfold increase of AMPKα1 activity (Fig 6D). Mutant1 (Asn59Ala) and mutant3 (Asn189Ala) resulted in a mild but significant decrease of AMPKα1 activity, indicating that these two Asn residues may play a positive role in regulating AMPKα1 activity. Furthermore, shRNA‐mediated knockdown of HIF1an did not increase AMPKα1 activity when Asn173 residue was mutated (mutant2) (Fig 6E) as it did to AMPKa1 WT (Fig 6C), demonstrating that Asn173Ala mutation abolished the suppression of HIF1an on AMPKα1. These data suggest that Asn173 is an inhibitory residual in AMPKα1 and hydroxylation of Asn173 by HIF1an may impose an interference that inhibits the activation of AMPKα1, thereby revealing a novel regulatory mechanism for AMPK, which could be mediated by HIF1an‐induced Asn hydroxylation.
miR‐455 induces brown adipogenic activators and mitochondria biogenesis via the HIF1an‐AMPK‐PGC1α regulatory cascade
AMPK activation leads to a broad range of metabolic consequences. AMPK can directly activate PGC1α through Ser538‐ and Thr177‐phosphorylation 40. Phosphorylation of PGC1α generates a priming signal for its deacetylation by Sirt1 41, which then fully auto‐activates its own promoter and increases transcription of PGC1α mRNA 42. Indeed, consistent with activation of AMPKα phosphorylation in brown preadipocytes (Fig 6A), miR‐455 overexpression or HIF1an knockdown induced Ser‐ and Thr‐phosphorylation of PGC1α in vitro (Fig 6F). Furthermore, FAT455 transgenic mice showed enhanced phos‐Ser and phos‐Thr levels of PGC1α in both sWAT and BAT (Fig EV5C), consistent with the in vitro observation. Since AMPK is so far the only enzyme that has been reported to induce Thr‐phosphorylation of PGC1α, these data suggest that AMPK might mediate the effects of miR‐455 and HIF1an to induce PGC1α phosphorylation.
In accordance with these findings, we found the expression of PGC1α mRNA was significantly induced in cells overexpressing miR‐455, including the committed brown and white preadipocytes as well as undifferentiated C3H10T1/2 cells (Fig 6G). This was accompanied by increased expression of several mitochondrial genes (Fig 6H and I). PGC1α is known to drive mitochondria biogenesis 43 and UCP1 expression 44, 45; thus, the observed up‐regulation of PGC1α could account for the miR‐455‐induced UCP1 expression and brown adipogenesis. C3H10T1/2 cells overexpressing miR‐455 displayed over twofold increase of mitochondrial DNA copy number (as indicated by the DNA ratio of the mitochondria gene COXII versus the nuclear gene β‐globin) (Fig 6J), and significant increases in both basal and maximum respiratory capacity of the cells (Fig 6K). In addition, miR‐455 overexpression in brown and white preadipocytes resulted in induced expression of genes involved in fatty acid mobilization (such as CD36) and lipolysis (such as ATGL and HSL) (Fig 6L and M). CD36 is responsible for fuel delivery to BAT and hence critical for BAT function 46. ATGL is critical for maintaining a mature BAT phenotype 47. Together, the increased expression of PGC1α and mitochondrial biogenesis as well as the up‐regulation of genes involved in fatty acid mobilization and lipolysis could contribute to miR‐455‐mediated brown adipogenesis.
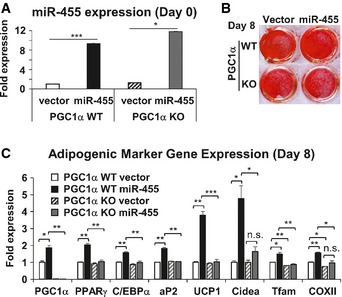
To determine whether miR‐455 induced brown adipogenesis via a PGC1α‐dependent pathway, we overexpressed miR‐455 in WT and PGC1α KO brown preadipocytes 48 (Fig 7A) and subjected them to standard brown adipocyte differentiation. At day 8, both WT and PGC1α null cells became lipid‐laden cells (Fig 7B), but miR‐455‐induced expression of brown fat marker genes such as UCP1, Cidea, and mitochondria genes was markedly diminished in PGC1α‐deficient cells (Fig 7C), suggesting that PGC1α is essential for miR‐455‐induced brown adipogenesis.
Figure 7. miR‐455‐induced brown adipogenesis is dependent on PGC1α.
-
A–CBrown preadipocytes established from PGC1α WT and KO mice were transduced with control lenti‐vector or lentimiR‐455 viruses, selected, pooled, and induced to differentiate by standard differentiation protocol (see Materials and Methods). On day 8, cells were harvested and analyzed. Shown are qRT–PCR analysis of miR‐455 expression (A), Oil Red O staining (B), and qRT–PCR analysis of adipogenic gene expression (C). Data were analyzed with Student's t‐test and are presented as mean ± SEM of a representative from three independent experiments each performed in triplicates (*P < 0.05, **P < 0.01, and ***P < 0.001; n.s., non‐significant).
To determine whether suppression of HIF1an is a necessary step for miR‐455‐induced PGC1α expression, we overexpressed a mutated human HIF1an transgene, which lacked its native 3′ UTR and was therefore miR‐455 insensitive, in miR‐455‐overexpressing brown preadipocytes. Indeed, overexpression of this mutant HIF1an nearly completely blocked miR‐455‐induced PGC1α expression (Appendix Fig S8B), demonstrating that suppression of HIF1an by miR‐455 is an indispensable step for miR‐455‐induced PGC1α expression.
Discussion
In this study, we have demonstrated that brown fat‐specific miR‐455 promotes brown adipocyte differentiation by targeting key brown adipogenic signaling molecules including Necdin, Runx1t1, and HIF1an (Fig 8). Necdin binds to the E2Fs/DP‐1 complex and blocks PPARγ transcription 25. Runx1t1 interacts with C/EBPβ and impedes its transactivity 24. Thus, by targeting and suppressing Necdin and Runx1t1, miR‐455 induces the expression of PPARγ and C/EBPβ, respectively. C/EBPβ activates the expression of PPARγ and PGC1α 29. PPARγ and PGC1α then recruit a transcription complex, which may contain PRDM16 and EBF2 49, EHMT1 50, and other transcriptional regulators to induce the expression of brown fat‐specific genes 44.
Figure 8. miR‐455‐regulated signaling network leading to brown adipogenesis.
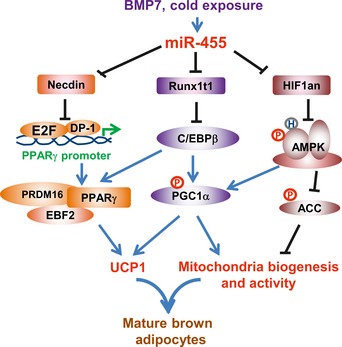
Although it has been reported that HIF1an whole‐body knockout mice displayed increased UCP1 expression in BAT and elevated energy expenditure, the underlying molecular mechanism is unknown 26. In this study, we reveal the molecular links between miR‐455, HIF1an, and AMPK in relation to brown adipogenesis. Importantly, we have discovered a novel interaction between HIF1an and AMPKα1, where HIF1an inhibits AMPKα1 activity through asparaginyl hydroxylation. AMPK is able to directly phosphorylate PGC1α 40 and generate the primary signal for deacetylation of PGC1α by SIRT1 41. This results in full activation of PGC1α promoter via a positive feedback transcriptional regulation 42. AMPK induces mitochondrial β‐oxidation via activating ACC/Malonyl‐CoA/CPT1 pathway in adipocytes 51, 52, 53, 54. AMPK can also directly activate ATGL through Ser406 phosphorylation 47, the key enzyme regulating lipolysis in adipocytes. The lipolytic products in turn function as the ligands to activate PPARα and PPARδ, which can transcriptionally activate PGC1α and UCP1 in brown adipocytes 55. These studies are consistent with our data showing that miR‐455 induces PGC1α expression and phosphorylation, mitochondrial biogenesis, and expression of fatty acid mobility and lipolytic genes. Currently, due to the lack of commercially available antibody specific to hydroxyl residues, the experiment of direct assessment of hydroxylation of AMPK is not possible. Nevertheless, we undertake a series of alternative approaches to access the functional correlation between HIF1an and AMPKα1. Our data demonstrate that AMPK activity could be regulated by miR‐455‐HIF1an via a hydroxylation‐mediated mechanism. Taken together, we have uncovered a novel microRNA‐regulated signaling network (Fig 8), whereby miR‐455‐activated AMPKα1 acts as a metabolic trigger to initiate mitochondria biogenesis, PGC1α induction, and brown adipogenesis, and concomitantly, suppression of Runx1t1 and Necdin by miR‐455 allows the cells to enter an adipogenic program.
Utilizing cell transplantation and adipose‐specific transgenic mouse models, we provide strong evidence to demonstrate that increasing brown fat mass and thermogenic function in these animal models due to miR‐455 overexpression results in increased energy expenditure and improved metabolic homeostasis. Since the suppression of adipogenic inhibitors by miR‐455 takes into effect during early stage of adipocyte differentiation, the selection of aP2 over adiponectin promoter allowed us to capture this initial stage of adipocyte differentiation 23. aP2 promoter also resulted in expression of miR‐455 in other tissues/cell types, such as the heart, liver, muscle, and macrophages; however, we did not observe any apparent effect in these tissues/cells. While we cannot completely exclude the contribution of non‐fat aP2‐expressing cells to the observed phenotypes, based on the findings presented, it is conceivable to attribute the beneficial metabolic phenotypes to the increased UCP1 in BAT and browning of sWAT in the FAT455 mice.
In our LNA‐antimiR‐455‐injection mouse model, depletion of miR‐455 in vivo by the injection of LNA‐antimiR‐455 inhibitor significantly reduces both BAT and sWAT mass, suppresses the expression of UCP1, PGC1α, and PPARγ in BAT, and C/EBPα in sWAT compared to scramble‐injection. However, at the systemic levels, we do not observe any significant effect on body weight, body temperature upon cold challenge, GTT, ITT, or other serum parameters (insulin, free fatty acid, and triglyceride) by LNA‐antimiR‐455 treatment. It is conceivable that systemic inhibition of miR‐455 using the LNA approach would result in a complex phenotype because miR‐455 targets several adipogenic regulators that impact both white and brown adipogenesis. Thus, targeted ablation of miR‐455 in a brown fat‐specific manner warrants a better therapeutic intervention for future study.
Interestingly, miR‐455, which we identified in current study, and miR‐193b/miR‐365, which were previously reported to promote brown adipogenesis 10, target the same adipogenic suppressor, Runx1t1. These parallel findings suggest that microRNAs regulating a specific biological process could co‐target the same key regulatory molecules of the processes 21. Whether this indicates a complementary or redundant function among these microRNAs remains to be determined. Taken together, we have identified a novel microRNA‐mediated signaling network regulating brown adipogenesis and thermogenic function. Our identification of miR‐455 as a genuine BAT marker in both mice and humans suggests miR‐455 mimics and/or inhibitors as potential therapeutics for treating obesity and other metabolic disorders.
Materials and Methods
Identification of microRNAs
C3H10T1/2 cells were grown to confluency and then treated with vehicle (water) or 3.3 nM BMP7 (Stryker) for 3 days. Total RNA was isolated, half of which was subjected to microRNA array (Ambion mirVana Cat#1564 combined with an array of a panel of selected microRNAs based on the literature, GEO accession number GSE71157), and the other half was subjected to standard mRNA array (Affymetrix GeneChip mouse 430A, GEO accession number GSE71101). Differentially expressed (DE) genes were identified using MAS 5.0 software (Affymetrix) with P‐values ≤ 0.05 as threshold (Dataset EV2) 56. DE genes from mRNA array were then subjected to analysis by mirBridge 21 to identify putative microRNAs regulating subsets of the DE genes. In the microRNA array, one set of BMP7‐ and vehicle‐treated samples was used, and the microRNAs with ≥ 1.5‐fold up‐regulation (BMP7/vehicle) or down‐regulation (vehicle/BMP7) were selected as the candidates (Dataset EV1). In mirBridge analysis, microRNAs with raw P‐value ≤ 0.05 were selected as the candidates (Dataset EV3). The microRNAs commonly selected in both microRNA array and mirBridge were further selected for tissue expression analysis. The expression of these microRNA candidates was then examined for their tissue specificity. Note that the mirBridge dataset (and hence its analysis result) contains miR‐455‐5p only, and we included both 455‐5p and 455‐3p for downstream expression analysis because they are expected to have similar expression patterns.
Plasmids, cloning, transfection, and transduction
miR‐455 lentiviral vector was generated by cloning 660 bp of mouse genomic DNA harboring pri‐miR‐455 sequence into pCDH‐GFP‐Puro vector (System Biosciences). Luciferase construct Luc‐HIF1an‐3′UTR was from Applied Biological Materials, and Luc‐Runx1t1‐3′UTR and Luc‐Necdin‐3′UTR were from GeneCopoeia. aP2‐miR‐455 construct was generated by linking 5.8 kb mouse aP2 promoter and 660 bp mouse genomic DNA harboring pri‐miR‐455 sequence. Lentiviral HIF1an‐shRNA vector and Runx1t1 expression vector were from Applied Biological Materials. Retroviral expression vector of human Flag‐AMPKα1 WT was from Addgene. AMPK mutations were generated by site‐directed mutagenesis based on Flag‐AMPK WT. For transfection, cells at 80% confluence were transfected with PolyJet (SignaGen Laboratories) following the manufacturer‐provided protocol. Lentiviruses were obtained by transfecting 293T cells with lentiviral expression vectors and packing vectors. Viral supernatant was filtered through 0.45‐μm filter before applying to cells. Transduction was done by incubating cells with virus supernatant in the presence of 4 μg/ml polybrene.
Cell culture
Brown preadipocytes were established as previously described 57. For the differentiation of brown preadipocytes, the cells were differentiated with standard differentiation protocol (DMEM containing 10% FBS, 0.5 mM isobutylmethylxanthine, 1 mM dexamethasone, 20 nM insulin, and 1 nM T3 for 2 days, followed by 5–10 days of incubation with DMEM containing 10% FBS, 20 nM insulin, and 1 nM T3) or were maintained in DMEM containing 10% FBS, 20 nM insulin, and 1 nM T3 for 17 days. For the differentiation of LNA‐antimiR‐455‐transfected brown preadipocytes or PGC1α KO and WT brown preadipocytes established from PGC1α KO mice and WT littermates 48, the cells were induced by standard differentiation protocol as above. For the differentiation of brown preadipocytes by BMP7, the cells were maintained in 3.3 nM BMP7 throughout the differentiation process. The differentiation of C3H10T1/2 cells (ATCC) was achieved by pretreating the cells with 3.3 nM BMP7 or vehicle for 3 days, followed by 2 days of induction with induction medium (DMEM containing 10% FBS, 0.5 mM isobutylmethylxanthine, 1 mM dexamethasone, 20 nM insulin, and 1 nM T3) and 6 days of differentiation with differentiation medium (DMEM containing 20 nM insulin and 1 nM T3). 3T3‐F442A cells were differentiated for 8 days with DMEM containing 10% FBS, 850 nM insulin, and 1 nM T3. On day 8, F442A cells were treated with 100 μM NE or vehicle for 4 h as indicated. sWAT‐SVFs from C57BL/6 mice were induced to differentiation by standard differentiation protocol with supplement of 1 μM rosiglitazone. On day 10, SVFs were treated with 100 μM NE or vehicle for 4 h before harvest for analysis. sWAT‐ScaPCs established from C57BL/6 mice as described previously 17 were immortalized and then induced to differentiation by standard differentiation protocol. On day 8, the cells were treated with 100 μM NE for 4 h before harvest.
Human adipose tissues
Human neck fat was isolated as described previously 58. WAT was defined as the subcutaneous fat, and BAT was defined as the sample of deep fat that had the highest expression of UCP1. The human study followed the institutional guidelines of and was approved by the Human Studies Institutional Review Boards of Beth Israel Deaconess Medical Center, Joslin Diabetes Center, and Massachusetts General Hospital. Written informed consent was obtained from all individuals who contributed adipose fat samples.
Isolation of macrophage/dendritic cells
White adipose depots were surgically removed and weighed, followed by mincing in DMEM containing collagenase (Worthington). Minced tissues were dissociated in a shaking water bath at 37°C for 1 h, followed by trituration and centrifugation to pellet the stromovascular fraction. Red blood cells were lysed, and the SVF was incubated with antibodies against F4/80 and CD11b prior to FACS sorting. Live/dead cells were indicated by calcein and PI stain, and from a gate on living cells, F4/80 and CD11b double‐positive cells were counted and sorted into TRIzol reagent for immediate RNA extraction. Intraperitoneal (i.p.) macrophages were obtained by aspirating i.p. fluid into DMEM, followed by the same antibody incubations and sorting paradigms as the SVF macrophages.
Luciferase assay
Brown preadipocytes were co‐transfected with Luc‐3′UTR constructs and different dosages of miR‐455 mimics or antimiR‐455 inhibitors (Exiqon A/S). Luciferase activities were measured using Secrete‐Pair Dual Luminescence Assay Kit (GeneCopoeia, for Luc‐Runx1t1‐3′UTR and Luc‐Necdin‐3′UTR) or Dual Luciferase Kit (Promega, for Luc‐HIF1an‐3′UTR) following the manufacturer's protocols.
RNA and protein analysis
RNA extraction, cDNA synthesis of genes, and quantitative real‐time PCR (qRT–PCR) were performed as previously described 15. For cDNA synthesis of microRNAs, total RNAs were first polyadenylated using Poly(A) polymerase (New England Biolab) according to the manufacturer's recommendation and then subjected to standard cDNA synthesis using an oligo(dT) adaptor primer. For qRT–PCR analysis, C t values < 31 were used for gene expression analysis. Primers for qRT–PCR are presented in Appendix Table S4. RNU6 (or human RNU1) and Arbp (38B4) (or human 18S) were used as internal controls for normalization for qRT–PCR of microRNAs and protein‐coding genes, respectively. All the qRT–PCR results are expressed as ratio in arbitrary units. Protein detection by Western blotting was performed as described before 15. For Western blots, the following antibodies were used: UCP1 (Santa Cruz, sc‐6528); HIF1an (Abcam, Cat#86176); Runx1t1 (Abcam, ab26161); Necdin (Millipore, Cat#AB9372); AMPKα (Cell Signaling, Cat#2532), Phospho‐AMPKα(Thr172) (Cell signaling, Cat#2531), and Phospho‐ACC (Cell Signaling, Cat#3661); α‐tubulin (Sigma, Cat#T6074) and β‐tubulin (Cell Signaling, #2146); and HRP‐coupled secondary antibodies (Cell Signaling). For ECL detection, the ECL system (GE) was used. Densitometry was performed using program ImageQuant (Molecular Dynamics).
Immunoprecipitation
Brown preadipocytes at confluence were harvested in IP buffer (50 mM Tris–HCl, pH 7,5, 150 mM NaCl, 1 mM EDTA, 1% NP‐40, 0.1% Na‐deoxycholate), vortexed, and spun down at 2,000 rpm for 10 min at 4°C. Supernatant protein samples were transferred to new Eppendorf tubes. For each IP, 300 μl protein sample and 30 μl Protein G beads (Amersham, prewashed in IP buffer) were incubated with rotation at 4°C for 2 h to preclear. Then, the IP mixtures were spun down. The supernatants were transferred to new Eppendorf tubes and incubated with 30 μl Protein G beads and 2 μg HIF1an antibody (Santa Cruz, sc‐271780) with rotation at 4°C for 16 h. The beads were then spun down and washed in IP buffer 4 times. After the last wash, 20 μl SDS‐protein sample buffer was added to each sample and boiled for 5 min. The samples then underwent Western blot analysis. For immunoprecipitation of PGC1α, limited amount of anti‐PGC1α antibody (Santa Cruz, sc‐13067) and excess amount of protein samples were incubated in order to precipitate equal amount of PGC1α. Phospho‐PGC1α and total precipitated PGC1α were detected by Western blots using anti‐phospho‐serine (Millipore, AB1603) and anti‐phospho‐threonine (Santa Cruz, sc‐5267) and anti‐PGC1α antibodies.
Immunofluorescence and immunohistochemistry
For immunofluorescence, paraffin‐embedded sections were incubated with antibodies against GFP (Abcam, ab13970) or UCP1 (Anaspec, Cat#53936), followed by incubation with anti‐chicken Alexa 488 and anti‐rabbit Alexa 595 (Invitrogen). For immunohistochemistry, UCP1 (Santa Cruz, sc‐6529) antibody and Vectastain ABC kit (Vector Lab) were utilized according to the manufacturer‐provided protocol.
Implantation
Implantation of C3H10T1/2 cells into nude mice was described previously 15. Briefly, C3H10T1/2‐GFP or ‐GFP‐miR‐455 cells established in vitro were grown in the presence and absence of 3.3 nM rhBMP7 for 3 days to reach confluence. Cells were washed, trypsinized, and resuspended in growth medium. A total of 1.5 × 10⁷ cells in 0.15 ml volume were injected into the thoracic/sternum region of 5‐week‐old BALB/c athymic mice (Charles River Laboratories, Inc.) using an 18‐gauge needle. Five weeks after implantation, VO2, VCO2, and heat were measured by CLAMS (comprehensive laboratory animal monitoring system) over a period of 32 h; 6 weeks after implantation, mice were sacrificed, and adipose tissues derived from implanted cells were excised and processed for histological analysis.
Transgenic mouse model
All animal procedures were approved by the Institutional Animal Care and Use Committee at Joslin Diabetes Center. C57BL/6 mice (Jackson Laboratory) were used for all animal experiments. aP2‐miR‐455 (FAT455) transgenic mice were created by pronuclear injection of a DNA construct consisting of 5.8 kb aP2 promoter linked to 661 bp of mouse genomic DNA that harbors the entire precursor miR‐455 sequence. Genotyping primers are presented in Appendix Table S4. Three FAT455 founders were obtained and genotyped, and miR‐455 expression level was verified.
Pair feeding
FAT455 transgenic mice and WT littermates with similar body weight at age 7 weeks were placed in singe cage. Each pair contains a FAT455 mouse and a WT littermate of equal or similar initial body weight. Sufficient food was provided to the cages of WT littermates, and food intake was recorded and calculated for each mouse as food (gram)/body weight (gram) every day. FAT455 mice were fed the same amount of food [food (gram)/body weight (gram)] as their paired WT littermates, and the food was added and refreshed to FAT455 mice every day during pair‐feeding period.
Measurement of maximal oxygen consumption by CLAMS
Genetically modified mice and the age‐matched WT littermates were maintained at 5°C for 8 days to activate brown adipose tissue prior to CLAMS recording. At the time of measurement, the mice were placed in anesthesia state by the injection of ketamine–xylazine combination (50 mg/kg ketamine and 10 mg/kg of xylazine) and then placed in metabolic cage. This will give a 2‐h anesthesia period for the mice. Basal values were recorded for 30 min, followed by intraperitoneal NE injections (1 mg norepinephrine bitartrate/kg; Sigma‐Aldrich) to maximally activate mitochondrial uncoupling. The averages of 3 basal measurements (VO2) were calculated as the basal values for further calculations. After NE injection (t0), the mice were further recorded for 90 min with a 15‐min interval between each recording. The maximal values (VO2) were calculated as the average of the three highest values after NE injection. The maximal thermogenic capacity was calculated by comparing the absolute difference between basal values and the maximum NE‐induced values (ΔVO2). Body composition was determined by dual‐energy X‐ray absorptiometry (DEXA). VCO2 and heat were determined and calculated in the same way as VO2. All the values were normalized as per mouse, per body weight (BW), and per lean mass.
LNA‐antimiR injection
Five‐week‐old C57BL/6 mice with equal body weight were injected intraperitoneally with LNA‐antimiR‐455 inhibitor or LNA scramble (Scr) (Exiqon A/S) at the dosage of 10 mg/kg body weight, one injection per week for a period of 11 weeks. The mice were then sacrificed, and tissues were dissected and analyzed as indicated.
AMPK assay
AMPK assay was measured as previously described 59. Briefly, AMPKα1 and AMPKα2 were immunoprecipitated from brown preadipocytes by AMPK isoform‐specific antibodies (gift from Dr. Laurie Goodyear) or anti‐Flag beads (Sigma, for Flag‐AMPKα1 mutants or WT‐transduced cells), and their activities were determined by measuring the rate of 32P integration into the AMARA substrate peptide using ATP‐[γ‐32P] during a phosphorylation assay.
Statistical analysis
Student's t‐test was used in all cellular and animal experiments and the results are presented as mean ± SEM. The Wilcoxon matched‐pairs signed‐ranks test was used for human sample analysis. Randomization was followed in all experiments except pair‐feeding experiment where mice with similar initial body weight were recruited. No blinding was used in this study.
Author contributions
HZ and Y‐HT conceived and designed the experiments and wrote the manuscript. HZ performed the majority of experiments. MG, TLH and KLT performed some of the gene expression, animal, immunofluorescence, and cell sorting analyses. DA, XY and MFH performed the AMPK assay. TJS and JW contributed to microRNA array analysis. MM helped with bioinformatic analysis. APW harvested human fat during routine anterior cervical surgery. RX and AMC contributed to human adipose tissue analysis. JST performed mirBridge analysis. KK contributed to general experimental materials. LJG contributed reagents and materials for AMPK activity assay.
Conflict of interest
The authors declare that they have no conflict of interest.
Supporting information
Appendix
Expanded View Figures PDF
Dataset EV1
Dataset EV2
Dataset EV3
Review Process File
Acknowledgements
We thank Dr. Yong‐Xu Wang for providing the brown preadipocyte cell line, Exiqon A/S for providing microRNA mimics, and Dr. Marc Uldry and Dr. Bruce Spiegelman for providing the PGC1α KO brown preadipocyte cell line. We thank Elizabeth Caniano for administrative assistance to the manuscript. We also thank Dr. Nils Billestrup and Dr. Jens Høiriis Nielsen for help with experimental materials. This work was supported in part by NIH grants R01 DK077097 (Y.‐H.T.), and Joslin Diabetes Center's Diabetes Research Center (DRC; P30 DK036836 from the NIDDK), a research grant from the American Diabetes Association (ADA 7‐12‐BS‐191 to Y.‐H.T.), research grants from the Novo Nordisk Foundation, Lundbeck Foundation and Augustinus Foundation (to H.Z.), NIH grant R01AR042238, and American Diabetes Association Mentor‐Based Award 7‐12‐MN (to L.J.G.) and partially supported by the Intramural Program of the NIAID/NIH (to J.S.T.). K.L.T was funded by NIH T32 DK007260‐33 and NIH F32 DK091996.
EMBO Reports (2015) 16: 1378–1393
References
- 1. Cannon B, Nedergaard J (2004) Brown adipose tissue: function and physiological significance. Physiol Rev 84: 277–359 [DOI] [PubMed] [Google Scholar]
- 2. Nedergaard J, Bengtsson T, Cannon B (2007) Unexpected evidence for active brown adipose tissue in adult humans. Am J Physiol Endocrinol Metab 293: E444–E452 [DOI] [PubMed] [Google Scholar]
- 3. Cypess AM, Lehman S, Williams G, Tal I, Rodman D, Goldfine AB, Kuo FC, Palmer EL, Tseng YH, Doria A et al (2009) Identification and importance of brown adipose tissue in adult humans. N Engl J Med 360: 1509–1517 [DOI] [PMC free article] [PubMed] [Google Scholar]
- 4. Virtanen KA, Lidell ME, Orava J, Heglind M, Westergren R, Niemi T, Taittonen M, Laine J, Savisto NJ, Enerback S et al (2009) Functional brown adipose tissue in healthy adults. N Engl J Med 360: 1518–1525 [DOI] [PubMed] [Google Scholar]
- 5. Celi FS (2009) Brown adipose tissue–when it pays to be inefficient. N Engl J Med 360: 1553–1556 [DOI] [PMC free article] [PubMed] [Google Scholar]
- 6. Marken Lichtenbelt WD, Vanhommerig JW, Smulders NM, Drossaerts JM, Kemerink GJ, Bouvy ND, Schrauwen P, Teule GJ (2009) Cold‐activated brown adipose tissue in healthy men. N Engl J Med 360: 1500–1508 [DOI] [PubMed] [Google Scholar]
- 7. Guerra C, Koza RA, Yamashita H, Walsh K, Kozak LP (1998) Emergence of brown adipocytes in white fat in mice is under genetic control. Effects on body weight and adiposity. J Clin Invest 102: 412–420 [DOI] [PMC free article] [PubMed] [Google Scholar]
- 8. Almeida MI, Reis RM, Calin GA (2011) MicroRNA history: discovery, recent applications, and next frontiers. Mutat Res 717: 1–8 [DOI] [PubMed] [Google Scholar]
- 9. Montano M (2011) MicroRNAs: miRRORS of health and disease. Transl Res 157: 157–162 [DOI] [PMC free article] [PubMed] [Google Scholar]
- 10. Sun L, Xie H, Mori MA, Alexander R, Yuan B, Hattangadi SM, Liu Q, Kahn CR, Lodish HF (2011) Mir193b‐365 is essential for brown fat differentiation. Nat Cell Biol 13: 958–965 [DOI] [PMC free article] [PubMed] [Google Scholar]
- 11. Mori M, Nakagami H, Rodriguez‐Araujo G, Nimura K, Kaneda Y (2012) Essential role for miR‐196a in brown adipogenesis of white fat progenitor cells. PLoS Biol 10: e1001314 [DOI] [PMC free article] [PubMed] [Google Scholar]
- 12. Chen Y, Siegel F, Kipschull S, Haas B, Frohlich H, Meister G, Pfeifer A (2013) miR‐155 regulates differentiation of brown and beige adipocytes via a bistable circuit. Nat Commun 4: 1769 [DOI] [PMC free article] [PubMed] [Google Scholar]
- 13. Trajkovski M, Ahmed K, Esau CC, Stoffel M (2012) MyomiR‐133 regulates brown fat differentiation through Prdm16. Nat Cell Biol 14: 1330–1335 [DOI] [PubMed] [Google Scholar]
- 14. Trajkovski M, Lodish H (2013) MicroRNA networks regulate development of brown adipocytes. Trends Endocrinol Metab 24: 442–450 [DOI] [PMC free article] [PubMed] [Google Scholar]
- 15. Tseng YH, Kokkotou E, Schulz TJ, Huang TL, Winnay JN, Taniguchi CM, Tran TT, Suzuki R, Espinoza DO, Yamamoto Y et al (2008) New role of bone morphogenetic protein 7 in brown adipogenesis and energy expenditure. Nature 454: 1000–1004 [DOI] [PMC free article] [PubMed] [Google Scholar]
- 16. Park JH, Kang HJ, Kang SI, Lee JE, Hur J, Ge K, Mueller E, Li H, Lee BC, Lee SB (2013) A multifunctional protein, EWS, is essential for early brown fat lineage determination. Dev Cell 26: 393–404 [DOI] [PMC free article] [PubMed] [Google Scholar]
- 17. Schulz TJ, Huang TL, Tran TT, Zhang H, Townsend KL, Shadrach JL, Cerletti M, McDougall LE, Giorgadze N, Tchkonia T et al (2011) Identification of inducible brown adipocyte progenitors residing in skeletal muscle and white fat. Proc Natl Acad Sci USA 108: 143–148 [DOI] [PMC free article] [PubMed] [Google Scholar]
- 18. Schulz TJ, Huang P, Huang TL, Xue R, McDougall LE, Townsend KL, Cypess AM, Mishina Y, Gussoni E, Tseng YH (2013) Brown‐fat paucity due to impaired BMP signalling induces compensatory browning of white fat. Nature 495: 379–383 [DOI] [PMC free article] [PubMed] [Google Scholar]
- 19. Raschke S, Elsen M, Gassenhuber H, Sommerfeld M, Schwahn U, Brockmann B, Jung R, Wisloff U, Tjonna AE, Raastad T et al (2013) Evidence against a beneficial effect of irisin in humans. PLoS ONE 8: e73680 [DOI] [PMC free article] [PubMed] [Google Scholar]
- 20. Hata A, Davis BN (2009) Control of microRNA biogenesis by TGFbeta signaling pathway‐A novel role of Smads in the nucleus. Cytokine Growth Factor Rev 20: 517–521 [DOI] [PMC free article] [PubMed] [Google Scholar]
- 21. Tsang JS, Ebert MS, van Oudenaarden A (2010) Genome‐wide dissection of microRNA functions and cotargeting networks using gene set signatures. Mol Cell 38: 140–153 [DOI] [PMC free article] [PubMed] [Google Scholar]
- 22. Walden TB, Timmons JA, Keller P, Nedergaard J, Cannon B (2009) Distinct expression of muscle‐specific microRNAs (myomirs) in brown adipocytes. J Cell Physiol 218: 444–449 [DOI] [PubMed] [Google Scholar]
- 23. Shan T, Liu W, Kuang S (2013) Fatty acid binding protein 4 expression marks a population of adipocyte progenitors in white and brown adipose tissues. FASEB J 27: 277–287 [DOI] [PMC free article] [PubMed] [Google Scholar]
- 24. Rochford JJ, Semple RK, Laudes M, Boyle KB, Christodoulides C, Mulligan C, Lelliott CJ, Schinner S, Hadaschik D, Mahadevan M et al (2004) ETO/MTG8 is an inhibitor of C/EBPbeta activity and a regulator of early adipogenesis. Mol Cell Biol 24: 9863–9872 [DOI] [PMC free article] [PubMed] [Google Scholar]
- 25. Tseng YH, Butte AJ, Kokkotou E, Yechoor VK, Taniguchi CM, Kriauciunas KM, Cypess AM, Niinobe M, Yoshikawa K, Patti ME et al (2005) Prediction of preadipocyte differentiation by gene expression reveals role of insulin receptor substrates and necdin. Nat Cell Biol 7: 601–611 [DOI] [PubMed] [Google Scholar]
- 26. Zhang N, Fu Z, Linke S, Chicher J, Gorman JJ, Visk D, Haddad GG, Poellinger L, Peet DJ, Powell F et al (2010) The asparaginyl hydroxylase factor inhibiting HIF‐1alpha is an essential regulator of metabolism. Cell Metab 11: 364–378 [DOI] [PMC free article] [PubMed] [Google Scholar]
- 27. Djuranovic S, Nahvi A, Green R (2011) A parsimonious model for gene regulation by miRNAs. Science 331: 550–553 [DOI] [PMC free article] [PubMed] [Google Scholar]
- 28. Tang QQ, Zhang JW, Daniel LM (2004) Sequential gene promoter interactions of C/EBPbeta, C/EBPalpha, and PPARgamma during adipogenesis. Biochem Biophys Res Commun 319: 235–239 [DOI] [PubMed] [Google Scholar]
- 29. Karamanlidis G, Karamitri A, Docherty K, Hazlerigg DG, Lomax MA (2007) C/EBPbeta reprograms white 3T3‐L1 preadipocytes to a Brown adipocyte pattern of gene expression. J Biol Chem 282: 24660–24669 [DOI] [PubMed] [Google Scholar]
- 30. Vila‐Bedmar R, Lorenzo M, Fernandez‐Veledo S (2010) Adenosine 5′‐monophosphate‐activated protein kinase‐mammalian target of rapamycin cross talk regulates brown adipocyte differentiation. Endocrinology 151: 980–992 [DOI] [PubMed] [Google Scholar]
- 31. Lando D, Peet DJ, Gorman JJ, Whelan DA, Whitelaw ML, Bruick RK (2002) FIH‐1 is an asparaginyl hydroxylase enzyme that regulates the transcriptional activity of hypoxia‐inducible factor. Genes Dev 16: 1466–1471 [DOI] [PMC free article] [PubMed] [Google Scholar]
- 32. Devries IL, Hampton‐Smith RJ, Mulvihill MM, Alverdi V, Peet DJ, Komives EA (2010) Consequences of IkappaB alpha hydroxylation by the factor inhibiting HIF (FIH). FEBS Lett 584: 4725–4730 [DOI] [PMC free article] [PubMed] [Google Scholar]
- 33. Zheng X, Linke S, Dias JM, Zheng X, Gradin K, Wallis TP, Hamilton BR, Gustafsson M, Ruas JL, Wilkins S et al (2008) Interaction with factor inhibiting HIF‐1 defines an additional mode of cross‐coupling between the Notch and hypoxia signaling pathways. Proc Natl Acad Sci USA 105: 3368–3373 [DOI] [PMC free article] [PubMed] [Google Scholar]
- 34. Mulligan JD, Gonzalez AA, Stewart AM, Carey HV, Saupe KW (2007) Upregulation of AMPK during cold exposure occurs via distinct mechanisms in brown and white adipose tissue of the mouse. J Physiol 580: 677–684 [DOI] [PMC free article] [PubMed] [Google Scholar]
- 35. Salt IP, Connell JM, Gould GW (2000) 5‐aminoimidazole‐4‐carboxamide ribonucleoside (AICAR) inhibits insulin‐stimulated glucose transport in 3T3‐L1 adipocytes. Diabetes 49: 1649–1656 [DOI] [PubMed] [Google Scholar]
- 36. Daval M, Diot‐Dupuy F, Bazin R, Hainault I, Viollet B, Vaulont S, Hajduch E, Ferre P, Foufelle F (2005) Anti‐lipolytic action of AMP‐activated protein kinase in rodent adipocytes. J Biol Chem 280: 25250–25257 [DOI] [PubMed] [Google Scholar]
- 37. Xiao B, Sanders MJ, Underwood E, Heath R, Mayer FV, Carmena D, Jing C, Walker PA, Eccleston JF, Haire LF et al (2011) Structure of mammalian AMPK and its regulation by ADP. Nature 472: 230–233 [DOI] [PMC free article] [PubMed] [Google Scholar]
- 38. Chen L, Wang J, Zhang YY, Yan SF, Neumann D, Schlattner U, Wang ZX, Wu JW (2012) AMP‐activated protein kinase undergoes nucleotide‐dependent conformational changes. Nat Struct Mol Biol 19: 716–718 [DOI] [PubMed] [Google Scholar]
- 39. Chen L, Jiao ZH, Zheng LS, Zhang YY, Xie ST, Wang ZX, Wu JW (2009) Structural insight into the autoinhibition mechanism of AMP‐activated protein kinase. Nature 459: 1146–1149 [DOI] [PubMed] [Google Scholar]
- 40. Jager S, Handschin C, St‐Pierre J, Spiegelman BM (2007) AMP‐activated protein kinase (AMPK) action in skeletal muscle via direct phosphorylation of PGC‐1alpha. Proc Natl Acad Sci USA 104: 12017–12022 [DOI] [PMC free article] [PubMed] [Google Scholar]
- 41. Canto C, Gerhart‐Hines Z, Feige JN, Lagouge M, Noriega L, Milne JC, Elliott PJ, Puigserver P, Auwerx J (2009) AMPK regulates energy expenditure by modulating NAD+ metabolism and SIRT1 activity. Nature 458: 1056–1060 [DOI] [PMC free article] [PubMed] [Google Scholar]
- 42. Handschin C, Rhee J, Lin J, Tarr PT, Spiegelman BM (2003) An autoregulatory loop controls peroxisome proliferator‐activated receptor gamma coactivator 1alpha expression in muscle. Proc Natl Acad Sci USA 100: 7111–7116 [DOI] [PMC free article] [PubMed] [Google Scholar]
- 43. Wu Z, Puigserver P, Andersson U, Zhang C, Adelmant G, Mootha V, Troy A, Cinti S, Lowell B, Scarpulla RC et al (1999) Mechanisms controlling mitochondrial biogenesis and respiration through the thermogenic coactivator PGC‐1. Cell 98: 115–124 [DOI] [PubMed] [Google Scholar]
- 44. Cao W, Daniel KW, Robidoux J, Puigserver P, Medvedev AV, Bai X, Floering LM, Spiegelman BM, Collins S (2004) p38 mitogen‐activated protein kinase is the central regulator of cyclic AMP‐dependent transcription of the brown fat uncoupling protein 1 gene. Mol Cell Biol 24: 3057–3067 [DOI] [PMC free article] [PubMed] [Google Scholar]
- 45. Puigserver P, Wu Z, Park CW, Graves R, Wright M, Spiegelman BM (1998) A cold‐inducible coactivator of nuclear receptors linked to adaptive thermogenesis. Cell 92: 829–839 [DOI] [PubMed] [Google Scholar]
- 46. Bartelt A, Bruns OT, Reimer R, Hohenberg H, Ittrich H, Peldschus K, Kaul MG, Tromsdorf UI, Weller H, Waurisch C et al (2011) Brown adipose tissue activity controls triglyceride clearance. Nat Med 17: 200–205 [DOI] [PubMed] [Google Scholar]
- 47. Ahmadian M, Abbott MJ, Tang T, Hudak CS, Kim Y, Bruss M, Hellerstein MK, Lee HY, Samuel VT, Shulman GI et al (2011) Desnutrin/ATGL is regulated by AMPK and is required for a brown adipose phenotype. Cell Metab 13: 739–748 [DOI] [PMC free article] [PubMed] [Google Scholar]
- 48. Uldry M, Yang W, St Pierre J, Lin J, Seale P, Spiegelman BM (2006) Complementary action of the PGC‐1 coactivators in mitochondrial biogenesis and brown fat differentiation. Cell Metab 3: 333–341 [DOI] [PubMed] [Google Scholar]
- 49. Rajakumari S, Wu J, Ishibashi J, Lim HW, Giang AH, Won KJ, Reed RR, Seale P (2013) EBF2 determines and maintains brown adipocyte identity. Cell Metab 17: 562–574 [DOI] [PMC free article] [PubMed] [Google Scholar]
- 50. Ohno H, Shinoda K, Ohyama K, Sharp LZ, Kajimura S (2013) EHMT1 controls brown adipose cell fate and thermogenesis through the PRDM16 complex. Nature 504: 163–167 [DOI] [PMC free article] [PubMed] [Google Scholar]
- 51. Gaidhu MP, Frontini A, Hung S, Pistor K, Cinti S, Ceddia RB (2011) Chronic AMP‐kinase activation with AICAR reduces adiposity by remodeling adipocyte metabolism and increasing leptin sensitivity. J Lipid Res 52: 1702–1711 [DOI] [PMC free article] [PubMed] [Google Scholar]
- 52. Gaidhu MP, Fediuc S, Anthony NM, So M, Mirpourian M, Perry RL, Ceddia RB (2009) Prolonged AICAR‐induced AMP‐kinase activation promotes energy dissipation in white adipocytes: novel mechanisms integrating HSL and ATGL. J Lipid Res 50: 704–715 [DOI] [PMC free article] [PubMed] [Google Scholar]
- 53. Luo B, Parker GJ, Cooksey RC, Soesanto Y, Evans M, Jones D, McClain DA (2007) Chronic hexosamine flux stimulates fatty acid oxidation by activating AMP‐activated protein kinase in adipocytes. J Biol Chem 282: 7172–7180 [DOI] [PubMed] [Google Scholar]
- 54. Orci L, Cook WS, Ravazzola M, Wang MY, Park BH, Montesano R, Unger RH (2004) Rapid transformation of white adipocytes into fat‐oxidizing machines. Proc Natl Acad Sci USA 101: 2058–2063 [DOI] [PMC free article] [PubMed] [Google Scholar]
- 55. Mottillo EP, Bloch AE, Leff T, Granneman JG (2012) Lipolytic products activate peroxisome proliferator‐activated receptor (PPAR) alpha and delta in brown adipocytes to match fatty acid oxidation with supply. J Biol Chem 287: 25038–25048 [DOI] [PMC free article] [PubMed] [Google Scholar]
- 56. Zhang H, Schulz TJ, Espinoza DO, Huang TL, Emanuelli B, Kristiansen K, Tseng YH (2010) Cross talk between insulin and bone morphogenetic protein signaling systems in brown adipogenesis. Mol Cell Biol 30: 4224–4233 [DOI] [PMC free article] [PubMed] [Google Scholar]
- 57. Pan D, Fujimoto M, Lopes A, Wang YX (2009) Twist‐1 is a PPARdelta‐inducible, negative‐feedback regulator of PGC‐1alpha in brown fat metabolism. Cell 137: 73–86 [DOI] [PMC free article] [PubMed] [Google Scholar]
- 58. Cypess AM, White AP, Vernochet C, Schulz TJ, Xue R, Sass CA, Huang TL, Roberts‐Toler C, Weiner LS, Sze C et al (2013) Anatomical localization, gene expression profiling and functional characterization of adult human neck brown fat. Nat Med 19: 635–639 [DOI] [PMC free article] [PubMed] [Google Scholar]
- 59. Fujii N, Hirshman MF, Kane EM, Ho RC, Peter LE, Seifert MM, Goodyear LJ (2005) AMP‐activated protein kinase alpha2 activity is not essential for contraction‐ and hyperosmolarity‐induced glucose transport in skeletal muscle. J Biol Chem 280: 39033–39041 [DOI] [PubMed] [Google Scholar]
Associated Data
This section collects any data citations, data availability statements, or supplementary materials included in this article.
Supplementary Materials
Appendix
Expanded View Figures PDF
Dataset EV1
Dataset EV2
Dataset EV3
Review Process File


