Abstract
Uncontrolled extracellular matrix (ECM) production by fibroblasts in response to injury contributes to fibrotic diseases, including idiopathic pulmonary fibrosis (IPF). Reactive oxygen species (ROS) generation is involved in the pathogenesis of IPF. Transforming growth factor‐β1 (TGF‐β1) stimulates the production of NADPH oxidase 4 (NOX4)‐dependent ROS, promoting lung fibrosis (LF). Dysregulation of microRNAs (miRNAs) has been shown to contribute to LF. To identify miRNAs involved in redox regulation relevant for IPF, we performed arrays in human lung fibroblasts exposed to ROS. miR‐9‐5p was selected as the best candidate and we demonstrate its inhibitory effect on TGF‐β receptor type II (TGFBR2) and NOX4 expression. Increased expression of miR‐9‐5p abrogates TGF‐β1‐dependent myofibroblast phenotypic transformation. In the mouse model of bleomycin‐induced LF, miR‐9‐5p dramatically reduces fibrogenesis and inhibition of miR‐9‐5p and prevents its anti‐fibrotic effect both in vitro and in vivo. In lung specimens from patients with IPF, high levels of miR‐9‐5p are found. In omentum‐derived mesothelial cells (MCs) from patients subjected to peritoneal dialysis (PD), miR‐9‐5p also inhibits mesothelial to myofibroblast transformation. We propose that TGF‐β1 induces miR‐9‐5p expression as a self‐limiting homeostatic response.
Keywords: fibrosis, miRNAs, myofibroblast, oxidative stress, TGF‐β signaling
Subject Categories: Molecular Biology of Disease, RNA Biology
Introduction
The problem of organ fibrosis constitutes a major biomedical challenge. Fibrosis can be defined as an excessive accumulation of ECM components leading to the irreversible replacement of cellular compartments by ECM, ultimately leading to stiffness, scarring and devitalized tissue 1. While the past 25 years have witnessed a very significant increment in our understanding of fibrogenesis from the molecular standpoint, it is evident that very little progress has been made toward the possibility of preventing, deferring, or curing organ fibrosis. The fact that major organs such as the liver, heart, kidney, or lung can be affected by fibrosis, in many cases with lethal outcomes, adds an important and social burden to these clinical conditions. Fibrosis of these organs underlies the development of diseases with significant prevalence and scarce therapeutic margin including liver cirrhosis, myocardial sclerosis, renal diabetic disease, or IPF 2. IPF is a chronic progressive and lethal fibrotic lung disease of unknown etiology that is currently untreatable. The majority of IPF patients die from respiratory failure within 2–5 years of diagnosis 3, 4. The annual incidence of IPF appears to be rising, the disease is more common in men and the prevalence rises significantly with age 5, 6.
IPF is one of the conditions where the established interaction between TGF‐β and disturbance of redox homeostasis is sustained by a well‐defined molecular mechanism 7. TGF‐β enhances the expression of NOX4 in numerous cell types, leading to increased oxidative stress, which in itself is capable of amplifying the powerful fibrogenic program induced by TGF‐β 8, 9, 10, thus leading to a vicious cycle and self‐perpetuating fibrotic response 11.
An important pathological scenario where the appearance of fibrosis has a devastating effect is the peritoneum of patients subjected to continuous PD. Peritoneal fibrosis (PF) leads to peritoneal membrane failure and ultrafiltration dysfunction 12, 13, 14. It has been shown that peritoneal mesothelial cells (PMCs) play a crucial role in the development and progression of PF through the acquisition of a myofibroblast‐like phenotype by mesothelial‐to‐mesenchymal transition (MMT) 15, 16.
miRNAs are short single‐stranded RNAs that regulate post‐trancriptional mRNA expression by binding to complementary mRNA sequences, resulting in translational repression and gene silencing 17, 18. These non‐coding RNAs play critical roles in various physiological processes such as tissue development and differentiation, cellular proliferation and tissue repair 19, 20. Since their discovery in humans 21, merely 15 years ago, a huge explosion of knowledge has given rise to the hope that miRNAs may represent therapeutic alternatives for many untreatable diseases 22, 23, 24, 25. In this regard, the field of organ fibrosis has been the object of intense investigation. miRNAs have been reported to form part of the fibrogenic loop in different organs 26. As one archetypical and therapeutically challenging condition, IPF is a clinical entity where increasing focus has been recently placed, leading to the description of miR‐21 as a mechanistic culprit in the activation of fibrogenesis 27, 28, 29. Several miRNAs have been reported to respond to perturbations in the redox state 30 or to fibrogenic stimuli 26. However, we are not aware of the existence of miRNAs combining the double feature of being regulated by both oxidative stress and pro‐fibrotic cues involved in LF. In the present study, we sought to identify potential members of this subset that could in addition serve as new targets to be potentially exploited as therapeutic avenues for IPF and other interstitial lung diseases.
Here, we report the identification of miR‐9‐5p, a miRNA previously unrelated to the phenomenon of fibrosis, targeting two key mRNAs involved in fibrogenesis: TGFBR2 and NOX4. In addition, we demonstrate that miR‐9‐5p operates in an anti‐fibrogenic mode in cellulo and in the bleomycin‐induced animal model of LF by negatively regulating the TGF‐β signaling pathway. Moreover, we also show that lungs from patients with IPF and PMCs derived from patients subjected to PD both presented increased levels of miR‐9‐5p, thus supporting its role in human organ fibrosis.
Results
Hydrogen peroxide modulates miRNA expression in human lung fibroblasts
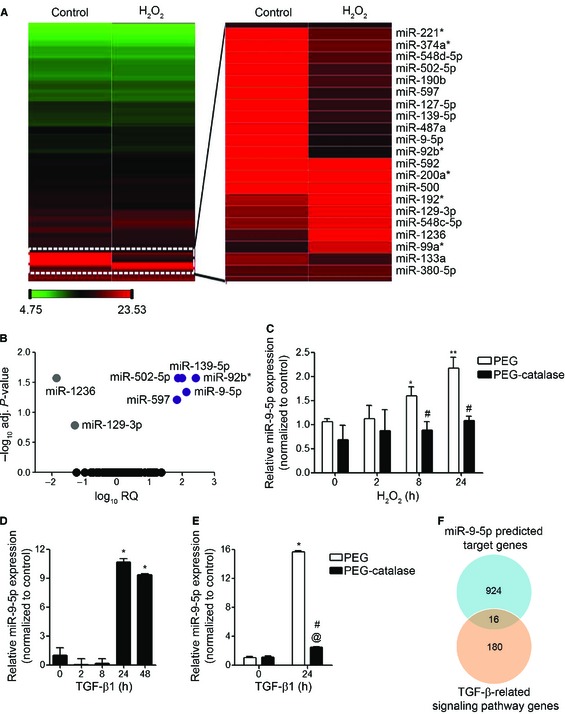
In order to determine the effect of oxidative stress on miRNA expression, human fetal lung fibroblasts (HFL‐1) were treated with 100 μM hydrogen peroxide (H2O2) for 8 h. RNA was isolated and the miRNA expression profile was analyzed by Taqman arrays. Heat map revealed clearly distinct expression patterns in some miRNAs when comparing H2O2‐treated with untreated control samples (Fig 1A). A higher magnification view of the zone showing the more differentially expressed miRNAs is depicted on the right. The volcano plot analysis spotted a group of seven differentially expressed miRNAs, five up‐ and two down‐regulated miRNAs, in treated samples compared to untreated ones (Fig 1B and Table EV1). The quantitatively important change observed in miR‐9‐5p and the absence of information on this miRNA in the context of organ fibrosis encouraged us to focus on miR‐9‐5p as a potential candidate susceptible of regulating redox‐mediated fibrogenesis. Quantitative reverse transcription–polymerase chain reaction (qRT–PCR) was performed to confirm the change of miR‐9‐5p expression following treatment with H2O2 that had been identified by miRNA expression profiling (Fig 1C, white bars). Pre‐incubation of HFL‐1 cells with PEG‐catalase, a specific H2O2 scavenger, significantly abrogated H2O2‐mediated increase in both ROS production (Fig EV1A) and miR‐9‐5p expression (Fig 1C, black bars), indicating that miR‐9‐5p is up‐regulated in oxidative stress conditions. TGF‐β1, one of the master regulators of fibrogenesis 31, 32, 33, also induced miR‐9‐5p expression in HFL‐1 cells more than 10‐fold after 24‐h treatment (Fig 1D), supporting a potential role for miR‐9‐5p in TGF‐β signaling‐related events. To evaluate the temporary course of miR‐9‐5p induction by TGF‐β1, the primary transcripts of miR‐9 (pri‐miR‐9) were analyzed by qRT–PCR after TGF‐β1 stimulation. TGF‐β1 induced the expression of both pri‐miR‐9‐1 and pri‐miR‐9‐3 (Fig EV1B), suggesting a possible regulation at the level of miRNA transcription. TGF‐β1 increased ROS production in different cell types, including human lung fibroblasts (Fig EV1C). These TGF‐β1‐induced ROS were found to be required for TGF‐β1‐induced myofibroblast differentiation, ECM production, contractility and more importantly in the establishment and progression of human LF 8, 10. In order to analyze if the induction of miR‐9‐5p expression by TGF‐β1 was dependent on the TGF‐β1‐produced ROS, lung fibroblasts were pre‐incubated with PEG‐catalase before TGF‐β1 treatment. Catalase significantly decreased both ROS levels and miR‐9‐5p expression induced by TGF‐β1 (Figs 1E and EV1D), suggesting that the TGF‐β1‐induced miR‐9‐5p expression was at least partially mediated by ROS. In silico analysis of specific target genes for miR‐9‐5p using three independent prediction tools (Targetscan, miRWalk and miRanda) determined 940 common target genes (Appendix Fig S1A) that are listed in Table EV2. Analysis using the DAVID database revealed a number of pathways highly enriched in miR‐9‐5p target genes. One of them was the “TGF‐β signaling pathway” (P = 4.1 × 10⁻²) (Appendix Fig S1B), which is the major pathological signaling pathway related to LF 2, 34. By intersecting the miR‐9‐5p predicted targets with the genes involved in the TGF‐β signaling pathway (Table EV3), 16 genes were identified (Fig 1F and Table EV4). Noticeably, two of them, NOX4 and TGFBR2, had already been implicated in the pathogenesis of LF 8, 10, 35. Hence, we focused our analysis on these two genes.
Figure 1. miRNA expression data in human lung fibroblasts following stimulation with H2O2 or TGF‐β1.
-
AHeat map showing relative miRNA expression between untreated (control) and H2O2‐treated HFL‐1 cells. The scale bar at the bottom left ranges from green to red (low to high expression) and numbers represent ΔC t values. A blow‐up of differentially expressed miRNAs is depicted on the right side. Data are representative of results from two experiments performed independently.
-
BVolcano plot analysis of H2O2‐modulated miRNAs. Log10 relative quantification (RQ) and negative (−) log10 adjusted (adj.) P‐values are plotted on the x‐ and y‐axis, respectively. Each miRNA is represented by a colored dot, gray are down‐regulated, purple are up‐regulated and black are non‐regulated (adj. P‐value ≥ 0.05) miRNAs.
-
C–EqRT–PCR analysis of miR‐9‐5p expression in HFL‐1 cells pre‐incubated for 2 h either with polyethyleneglycol (PEG) or with 100 units/ml PEG‐catalase and treated with 100 μM H2O2 for the indicated times (n = 3) (C), in cells treated with 5 ng/ml TGF‐β1 for the indicated times (n = 3–8) (D) and in HFL‐1 cells pre‐incubated as described in (C) and treated with 5 ng/ml TGF‐β1 for 24 h (n = 4) (E). Bar graphs show mean ± SEM; two‐tailed Mann–Whitney U‐test (C, E) and Kruskal‐Wallis non‐parametric ANOVA (D); *P < 0.05, **P ˂ 0.01 compared to control cells, # P < 0.05 compared to the same time point of control cells and @ P < 0.05 compared to PEG‐catalase‐treated cells at time 0.
-
FVenn diagram showing the intersection of miR‐9‐5p targets and TGF‐β‐related genes.
Figure EV1. Effect of PEG‐catalase on H2O2‐ and TGF‐β1‐induced ROS production and effect of TGF‐β1 on the expression of miR‐9‐5p precursors and on ROS production in HFL‐1 cells.
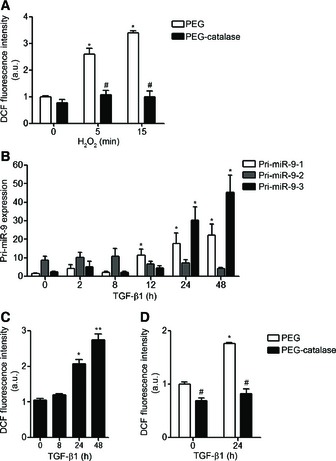
- Lung fibroblasts were treated with 100 μM H2O2 for the indicated times after pre‐incubation for 2 h either with polyethylene glycol (PEG) or with 100 U/ml PEG‐catalase (n = 3–5). Intracellular ROS production was measured using 2′,7′‐dichlorofluorescein diacetate (DCFH‐DA) reagent and analyzed by FACS.
- qRT–PCR analysis of miR‐9‐5p primary transcripts (pri‐miR‐9) levels in HFL‐1 cells stimulated with 5 ng/ml TGF‐β1 for the indicated times (n = 4–7).
- Intracellular ROS production in HFL‐1 cells treated with 5 ng/ml TGF‐β1 for the indicated times was measured as described in (A) (n = 3–5).
- Intracellular production of ROS in HFL‐1 cells pre‐treated as described above and treated with 5 ng/ml TGF‐β1 for 24 h was measured as described in (A) (n = 3–5).
Data information: Bar graphs show mean ± SEM; two‐tailed Mann–Whitney U‐test and Kruskal–Wallis non‐parametric ANOVA (B); *P < 0.05, **P < 0.01 compared to control cells and # P < 0.05 compared to control cells at the same time point. a.u., arbitrary units.
TGFBR2 and NOX4 expression are regulated by miR‐9‐5p
The TargetScan prediction software identified 2 and 3 putative binding sites (BSs) for miR‐9‐5p in the 3′ untranslated regions (3′ UTRs) of the TGFBR2 and NOX4 mRNA, respectively (Appendix Fig S2A and B). This prediction was functionally validated by over‐expressing miR‐9‐5p in pulmonary fibroblasts (Appendix Fig S3), which resulted in a decrease of TGFBR2 mRNA and protein levels (Fig 2A and B) and also reduced the mRNA and protein expression of NOX4 after induction by TGF‐β1 (Fig 2E and F). To determine whether miR‐9‐5p directly regulates TGFBR2 and NOX4 expression by binding to their 3′ UTR, putative WT and mutated 3′ UTR were cloned into the luciferase reporter vector pSiCheck‐2 36 (Fig 2C and G). Transfection with pre‐miR‐5p significantly decreased the luciferase activity of the reporter vector containing both WT 3′ UTRs while this reduction was abrogated in the presence of miRNA inhibitor‐9 (Fig 2D and H). The decrease in the luciferase activity was completely abolished after point mutations (PM) in both miR‐9‐5p BSs in the 3′ UTR of TGFBR2 (Fig 2D). The reduction was observed neither in the presence of PM1 + PM2 nor in the presence of PM1 + PM2 + PM3 NOX4 3′ UTR constructs (Fig 2H). These observations indicated that BS2 and both BS1 and BS2 were critical for the regulation of TGFBR2 and NOX4 3′ UTRs, respectively. These data are consistent with a direct regulation of TGFBR2 and NOX4 by miR‐9‐5p.
Figure 2. miR‐9‐5p regulates TGFBR2 and NOX4 expression in human lung fibroblasts.
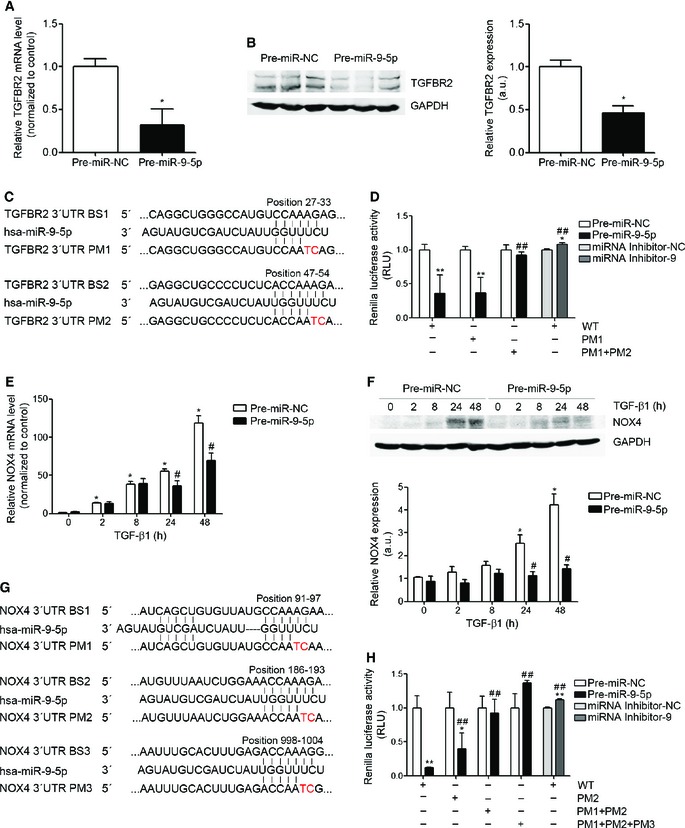
- qRT–PCR analysis of TGFBR2 expression in HFL‐1 cells transfected with 40 nM pre‐miR‐NC (control) or pre‐miR‐9‐5p for 48 h (n = 5).
- Western blot analysis (left) and quantification (n = 6) (right) of TGFBR2 protein levels in HFL‐1 cells transfected as indicated in (A).
- Sequence of miR‐9‐5p and their base pairing (bars) with the BSs in the 3′ UTR of human TGFBR2 mRNA. PMs are symbolized by red letters.
- Luciferase activity in HFL‐1 cells co‐transfected with psiCHECK2 containing WT or mutated 3′ UTR sequences of human TGFBR2 and 40 nM of pre‐miRs or miRNA inhibitors (n = 3).
- qRT–PCR analysis of NOX4 expression in HFL‐1 cells transfected as described in (A) and treated with 5 ng/ml TGF‐β1 for the indicated times (n = 4).
- Western blot analysis (above) and quantification (below) of NOX4 expression in HFL‐1 cells treated as described in (E) (n = 4).
- Localization of the three miR‐9‐5p predicted BSs in the 3′ UTR of human NOX4 gene represented as described in (C).
- Luciferase activity as described in (D) with the WT or mutated 3′ UTR sequences of human NOX4 gene (n = 3).
miR‐9‐5p regulates TGF‐β pro‐fibrogenic signaling in human lung fibroblasts
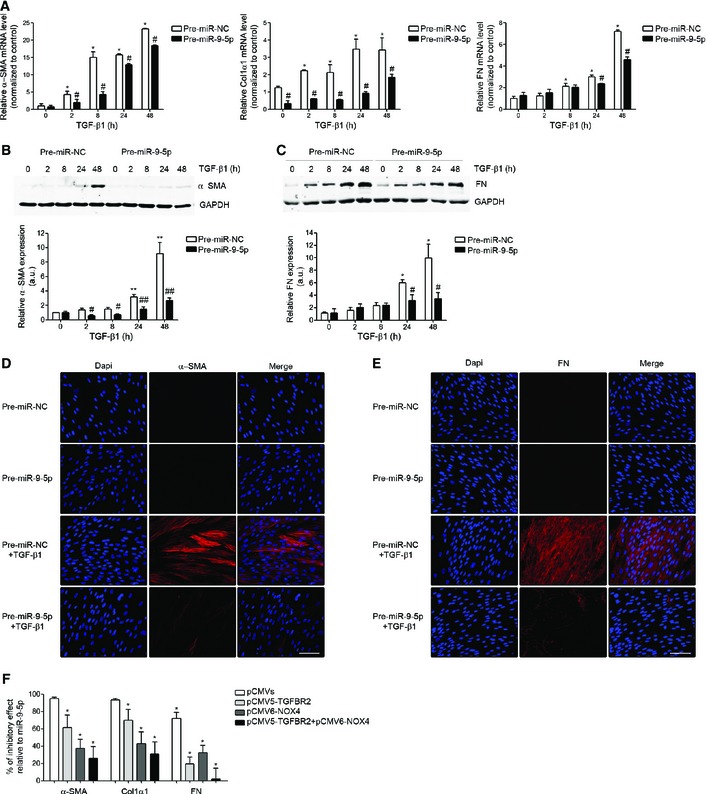
Pulmonary fibroblasts are the key effectors in the development of LF 2, 37. TGF‐β induces the transformation of fibroblasts into myofibroblasts 38, 39. Myofibroblasts are one of the major sources of ECM proteins, especially collagen type I alpha 1 (Col1α1) and fibronectin (FN), and are commonly characterized by the presence of α‐smooth muscle actin (α‐SMA) 37. Uncontrolled activation, proliferation, differentiation and survival of ECM‐producing myofibroblasts can perpetuate the pulmonary fibrotic response 7, 39. To determine if miR‐9‐5p was involved in the pro‐fibrogenic transformation of pulmonary fibroblasts by TGF‐β1, HFL‐1 cells were transfected with pre‐miR‐9‐5p and treated with TGF‐β1 for different times. Increasing miR‐9‐5p levels significantly decreased the TGF‐β1‐induced transcription of α‐SMA, Col1α1 and FN (Fig 3A). Similarly, over‐expression of miR‐9‐5p strongly reduced α‐SMA and FN protein abundance (Fig 3B–E). Conversely, the knock‐down of miR‐9‐5p induced an increase in the TGF‐β1‐dependent transcription of Col1α1 and FN (Fig EV2A) and in the α‐SMA and FN protein levels (Fig EV2B–E). To verify if TGFBR2 and NOX4 were the relevant targets in this context, HFL‐1 cells were transfected with plasmids expressing TGFBR2 and NOX4 in order to “rescue” the inhibitory effect potentially exerted by miR‐9‐5p on the corresponding endogenous transcripts. The reduction in the expression of α‐SMA, Col1α1 and FN observed in the presence of miR‐9‐5p was significantly attenuated after over‐expression of TGFBR2 or NOX4 (Fig 3F). The percentage of inhibitory effect related to miR‐9‐5p tended to be lower after transfection with plasmids containing cDNAs for both proteins compared to their individual over‐expression (Fig 3F), suggesting that both genes are crucial in the miR‐9‐5p‐mediated anti‐fibrotic effects. Whereas increased levels of miR‐9‐5p had no effect on cell proliferation, cell viability, or apoptosis (Appendix Fig S4A–C), they reduced the migration (Fig 4A) and invasion of ECM (Fig 4B) in response to TGF‐β1, essential features of the fibrotic phenotype 34, 40. These data suggested that miR‐9‐5p can delay the TGF‐β1‐dependent transformation of lung fibroblasts into myofibroblasts by regulating the TGF‐β signaling pathway. Consistently, increasing miR‐9‐5p levels attenuated Smad3/4 activation (Fig 4C), Smad2 phosphorylation (Fig 4D) and Smad2/3 nuclear translocation (Fig 4E) in response to TGF‐β1 stimulation. The decrease in the phosphorylation of Smad2 observed in the presence of miR‐9‐5p was significantly abrogated after over‐expression of TGFBR2 (Fig 4F), suggesting that the inhibitory effect of miR‐9‐5p on the TGF‐β signaling pathway was, at least in part, mediated by TGFBR2.
Figure 3. miR‐9‐5p inhibits TGF‐β1‐induced transformation of human lung fibroblasts into myofibroblasts.
-
AqRT–PCR analysis of α‐SMA (n = 4), Col1α (n = 3) and FN (n = 3) expression levels in HFL‐1 cells transfected with 40 nM pre‐miR‐NC (control) or pre‐miR‐9‐5p and treated with 5 ng/ml TGF‐β1 for the indicated times.
-
B, CProtein levels (above) of α‐SMA (n = 4) (B) and FN (n = 3) (C) in HFL‐1 cells described in (A). Quantification of protein expression is shown below. a.u., arbitrary units.
-
D, EFluorescence microscopy images of HFL‐1 cells stained with specific antibodies against α‐SMA (D, middle panels) and FN (E, middle panels) after transfection as described in (A) and TGF‐β1 treatment for 48 h (n = 3). Nuclei were stained with DAPI (blue). Scale bars: 100 μm.
-
FBar graph represents percentage (%) of inhibitory effect of miR‐9‐5p on α‐SMA, Col1α1 and FN expression after over‐expression of TGFBR2, NOX4 or both. HFL‐1 cells were transfected with 3 μg pCMV5‐TGFBR2, 3 μg pCMV6‐NOX4 or 3 μg of each plasmid and 40 nM pre‐miR‐9‐5p and treated with 5 ng/ml TGF‐β1 for 24 h (n = 4). Control cells were transfected with 3 μg pCMV5 and 3 μg pCMV6.
Figure EV2. Inhibition of miR‐9‐5p amplifies TGF‐β1‐induced transformation of human lung fibroblasts into myofibroblasts.
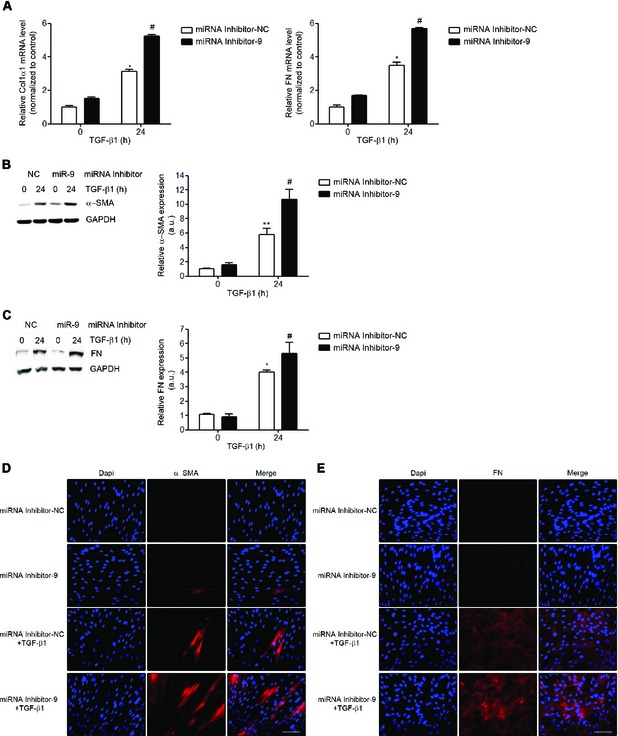
-
AqRT–PCR analysis of Col1α and FN (n = 4) expression levels in HFL‐1 cells transfected with 40 nM miRNA inhibitor NC (control) or miRNA inhibitor‐9‐5p and treated with 5 ng/ml TGF‐β1 for 24 h.
-
B, CProtein levels (left) of α‐SMA (n = 5) (B) and FN (n = 4) (C) in HFL‐1 cells described in (A). Quantification of protein expression (right). a.u., arbitrary units.
-
D, EFluorescence microscopy images of HFL‐1 cells stained with specific antibodies against α‐SMA (D, middle panels) and FN (E, middle panels) after transfection as described in (A) and TGF‐β1 treatment for 24 h (n = 3). Nuclei were stained with DAPI (blue). Scale bars: 100 μm.
Data information: All bar graphs show mean ± SEM; two‐tailed Mann–Whitney U‐test; *P < 0.05 , **P < 0.01 compared to control cells and # P < 0.05 compared to its corresponding negative control time point.
Figure 4. miR‐9‐5p inhibits the TGF‐β1‐induced fibrogenic pathway in human lung fibroblasts.
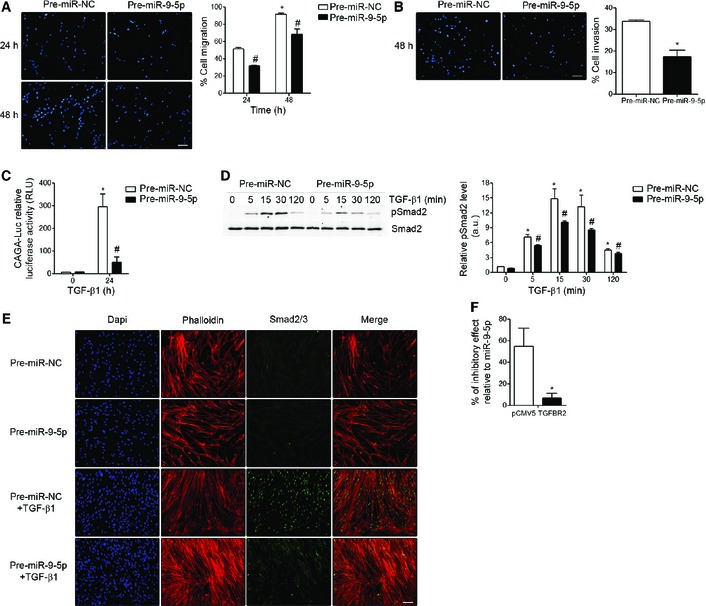
- Fluorescence images (left) and quantification (n = 3) (right) of migration in HFL‐1 cells transfected with either 40 nM pre‐miR‐NC (control) or pre‐miR‐9‐5p in response to TGF‐β1 for the indicated times. Nuclei were stained with DAPI (blue). Scale bar: 100 μm.
- Fluorescence images (left) and quantification (n = 3) (right) of collagen matrix invasion in HFL‐1 cells transfected with either 40 nM pre‐miR‐NC or pre‐miR‐9‐5p in response to TGF‐β1 for 48 h. Nuclei were stained with DAPI (blue). Scale bar: 100 μm.
- Luciferase activity of the reporter construct in HFL‐1 cells co‐transfected with 40 nM pre‐miR‐NC or pre‐miR‐9‐5p and treated with 5 ng/ml TGF‐β1 for 24 h (n = 3).
- Western blot analysis (left) and quantification (n = 4) (right) of pSmad2 protein levels in HFL‐1 cells transfected as described in (A) and treated with 5 ng/ml TGF‐β1 for the indicated times. a.u., arbitrary units.
- Fluorescence microscopy images of HFL‐1 cells stained with specific antibodies against Smad2/3 (green) after indicated treatments (n = 3). Nuclei were stained with DAPI (blue) and F‐actin was stained with phalloidin (red). Scale bar: 100 μm.
- Bar graph represents percentage (%) of inhibitory effect of miR‐9‐5p on Smad2 phosphorylation after over‐expression of TGFBR2 in HFL‐1 cells transfected with 3 μg pCMV5‐TGFBR2 (TGFBR2) and 40 nM pre‐miR‐9‐5p and treated with 5 ng/ml TGF‐β1 for 15 min (densitometric analysis from four separate experiments). Control cells were transfected with 3 μg pCMV5.
miR‐9‐5p is dysregulated in a mouse model of lung fibrosis and in IPF patients
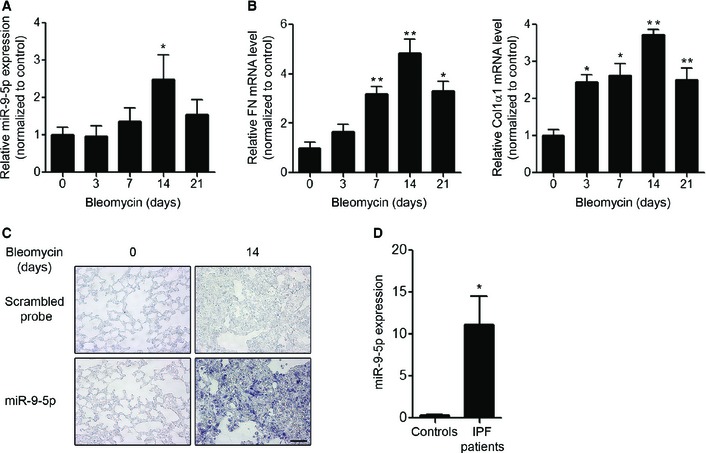
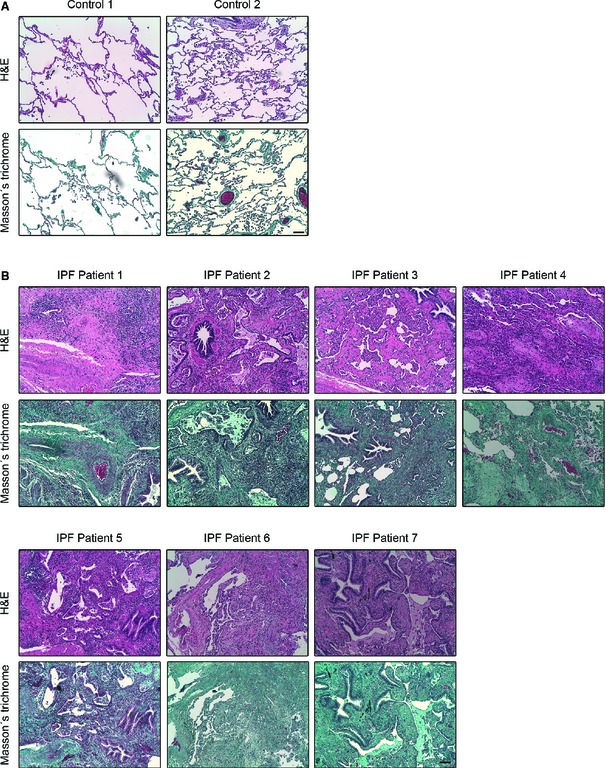
To determine the expression level of miR‐9‐5p in lungs of bleomycin‐treated mice, bleomycin was administrated orotracheally and its effect analyzed after different time periods. Analysis by qRT–PCR showed that miR‐9‐5p was significantly up‐regulated after 7 days of bleomycin administration, reaching the highest levels on day 14 and returning to basal levels after 21 days of treatment (Fig 5A). A similar temporal expression pattern was observed in the ECM proteins, FN and Col1α1 (Fig 5B). In situ hybridization (ISH) showed a dramatic increase of miR‐9‐5p in the fibrotic areas after bleomycin‐induced LF with no detectable signal in untreated control mice (Fig 5C, lower panels). In contrast, there was only a minimal background staining using scrambled probes, supporting the specificity of miR‐9‐5p staining (Fig 5C, upper panels). Of notice, lungs from patients with IPF also showed an increased expression of miR‐9‐5p (Fig 5D). The extent of fibrosis in mouse and human lung samples was confirmed by hematoxylin and eosin (H&E) and Masson's trichrome stainings (Figs EV3 and EV4). Taken together, these data suggest that miR‐9‐5p may be involved in the pathogenesis of LF by regulating the transformation of fibroblasts into myofibroblasts.
Figure 5. miR‐9‐5p is up‐regulated in lungs from both bleomycin‐treated mice and IPF patients.
-
A, BqRT–PCR analysis of miR‐9‐5p (A), FN and Col1α1 (B) expression in lungs of mice after orotracheal bleomycin administration (1.5 U/kg body weight in 40 μl saline) for the indicated times (n = 6 mice per group). *P ˂ 0.05, **P ˂ 0.01 compared to day 0.
-
CMicrophotographs of ISH showing miR‐9‐5p expression (purple, lower panels) in mouse lung samples at days 0 and 14 after bleomycin instillation (n = 3 mice per group). ISH with scrambled probes are shown in the upper images. Scale bar: 50 μm.
-
DqRT–PCR analysis of miR‐9‐5p expression levels in three histologically normal lungs (controls) and in seven lungs from IPF patients. *P ˂ 0.05 compared to control lungs.
Figure EV3. Histopathological changes of lung tissue in mice treated with bleomycin.

Microphotographs of H&E (upper panels) and Masson's trichrome (bottom panels) staining of lung tissue sections from saline‐treated control (day 0) as well as from orotracheally bleomycin‐treated mice (1.5 U/kg body weight in 40 μl saline serum) for the indicated times (n = 3 mice per group). H&E showed intact alveoli and normal interstitium in lungs of control mice and gradually increased areas of alveolar and interstitial fibrosis (black arrows), lung alveoli destruction and interstitium thickening in lungs of bleomycin‐treated mice. Intense blue Masson's staining indicates regions with collagen deposition. Scale bar: 100 μm.
Figure EV4. Histological characterization of human lung tissue of IPF patients.
-
A, BMicrophotographs of H&E (upper panel in each case) and Masson's trichrome (bottom panel in each case) staining in paraffin‐embedded lung tissue sections from two histologically normal lungs (controls) (A) and seven IPF patients (B). As it can be observed in (A) control lung tissue is characterized by a thin pulmonary alveolar epithelium. Neither fibroblast nor ECM deposits are present in the interstitium. In IPF patients (B), an extensive pulmonary fibrosis was observed in all the specimens analyzed. Alveolar interstitium is fully occupied by fibroblasts, inflammatory infiltrates and markedly visible ECM deposits (blue in Masson's staining for collagen). Alveolar epithelium is barely observed due to fibrosis development. All images are shown at equal magnification. Scale bar: 100 μm.
miR‐9‐5p prevents experimental lung fibrosis
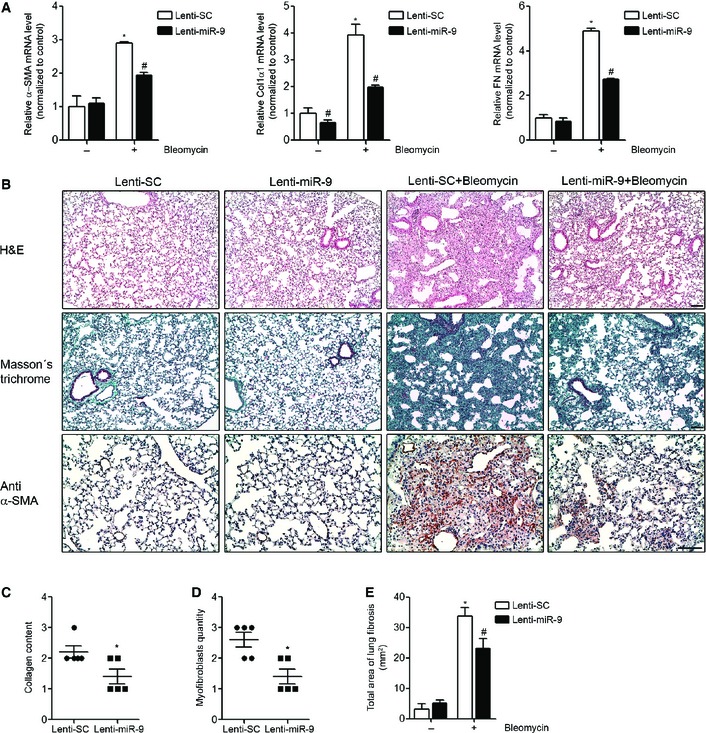
To determine the potential role of miR‐9‐5p in the development of experimental lung fibrosis, lentiviral vectors expressing a scramble negative control construct (lenti‐SC) or miR‐9‐5p (lenti‐miR‐9) were orotracheally instilled in mice 4 days before bleomycin administration. The efficient delivery of lentivirus to the lung was monitored by detecting the expression of the fluorescence marker GFP by microscopy (Fig EV5A). Orotracheal lenti‐miR‐9 instillation increased the expression levels of miR‐9‐5p up to 12‐fold compared to control mice (Fig EV5B). Lenti‐miR‐9 administration reduced the mRNA elevated expression of α‐SMA and ECM proteins, such as Col1α1 and FN, elicited by bleomycin administration (Fig 6A). The lenti‐SC had no effects on bleomycin‐induced LF (Fig EV5C). Pulmonary fibrosis, as assessed at days 0 and 14 after bleomycin administration, was determined in mice treated with lenti‐SC or lenti‐miR‐9. H&E staining showed a dramatic attenuation of bleomycin‐induced LF in mice pre‐treated with lenti‐miR‐9 (Fig 6B, upper panels). Masson's trichrome staining confirmed this finding (Fig 6B, middle panels). Similarly, pre‐treatment with lenti‐miR‐9 prevented the accumulation of myofibroblasts in bleomycin‐treated lungs, as demonstrated by immunohistochemistry staining with α‐SMA antibody (Fig 6B, lower panels). A semi‐quantitative evaluation demonstrated that lungs of lenti‐miR‐9 pre‐treated mice displayed lower levels of collagen content (depicted by Masson's trichrome staining) (Fig 6C) and less myofibroblasts (positive α‐SMA cells) (Fig 6D) compared to lungs of lenti‐SC pre‐treated mice. In keeping, the total fibrotic area, evaluated by quantifying Masson′s trichrome staining, was significantly lower in lungs of mice receiving the lenti‐miR‐9 compared to controls (Fig 6E). These results indicate that miR‐9‐5p not only decreases experimental pulmonary fibrosis but also that it plays a significant preventive role in the induction of myofibroblast differentiation. Increasing miR‐9‐5p levels by lentiviral infection reduced TGFBR2 and bleomycin‐induced NOX4 mRNA expression (Fig 7A and B), in consistence with in cellulo observations. Immunohistochemistry staining of TGFBR2 in lungs of mice pre‐treated with lenti‐miR‐9 exhibited lower levels of TGFBR2 after bleomycin administration, confirming the negative regulation of TGFBR2 by miR‐9‐5p also in vivo (Fig 7C, upper panels). Because miR‐9‐5p regulated TGF‐β1 signaling events in human lung fibroblasts in cellulo, we wanted to prove if the same regulation also occurred in vivo. As expected, there was an attenuation in the phosphorylation of Smad2 induced by bleomycin in lungs of mice pre‐treated with lenti‐miR‐9 (Fig 7C, lower panels), thus supporting that miR‐9‐5p interferes with a crucial process in TGF‐β signaling inherent to the fibrotic response 31, 41.
Figure EV5. Determination of miR‐9‐5p delivery and quantification of miR‐9‐5p expression level after lentiviral vector infection.
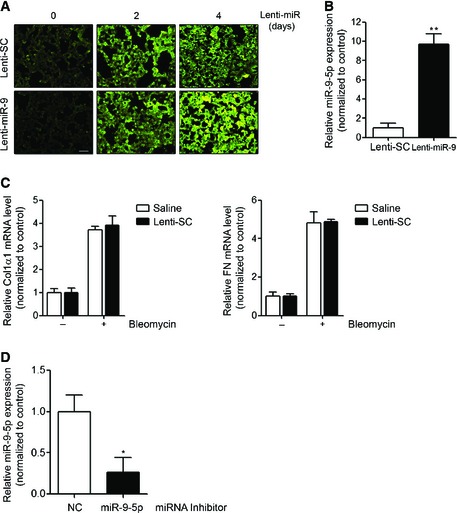
- GFP‐expressing fluorescence images of frozen lung sections from mice orotracheally instilled with lenti‐SC (control) or lenti‐miR‐9 vector (1 × 10⁶ i.f.u./mouse) for the indicated days (n = 3 mice in each group). Scale bar: 100 μm.
- qRT–PCR analysis of miR‐9‐5p expression in lungs from mice after 4 days of lentiviral infection (n = 6 mice per group).
- qRT–PCR analysis of Col1α1 and FN in lungs from mice administered saline or lenti‐SC 4 days before orotracheal bleomycin instillation (1.5 U/kg body weight in 40 μl saline serum) and sacrificed 14 days after treatment (n = 3 mice per group).
- qRT–PCR analysis of miR‐9‐5p expression in lungs from mice administered miRNA inhibitor NC (control) or miRNA inhibitor‐9‐5p (7 mg/kg body weight in 40 μl saline). The miRNA inhibitor was instilled at days −4 and −2 before sacrifice (n = 4 mice per group).
Data information: All bar graphs show mean ± SEM; two‐tailed Mann–Whitney U‐test; *P < 0.05, **P < 0.01 compared to its corresponding negative control condition; no significant differences between saline and lenti‐SC‐treated mice were found.
Figure 6. miR‐9‐5p prevents pulmonary fibrosis in mice.
-
AqRT–PCR analysis of α‐SMA, Col1α1 and FN expression in lungs from mice administered 1 × 10⁶ i.f.u. of lenti‐SC (control) or lenti‐miR‐9 for 4 days followed by orotracheal bleomycin administration (1.5 U/kg body weight in 40 μl saline) or saline for 14 days (n = 4 mice per group).
-
BMicrophotographs of H&E (upper panels) and Masson's trichrome staining (middle panels) and α‐SMA expression (lower panels) from lung sections of mice treated as described in (A) (n = 4 mice per group). Scale bars: 100 μm.
-
C, DSemiquantitative determination (grade 0 to 3) of the collagen content (C) and the quantity of myofibroblasts (D) in lung tissue samples from mice treated as described in (A) (n = 5 mice per group). Each mouse is represented by a symbol, dots represent lenti‐SC and squares represent lenti‐miR‐9‐treated mice, respectively.
-
ETotal area of lung fibrosis (mm2) in lung sections from mice treated as described in (A) (n = 4 mice per group).
Figure 7. miR‐9‐5p regulates TGFBR2 and NOX4 expression and inhibits Smad2 phosphorylation in mouse lungs.
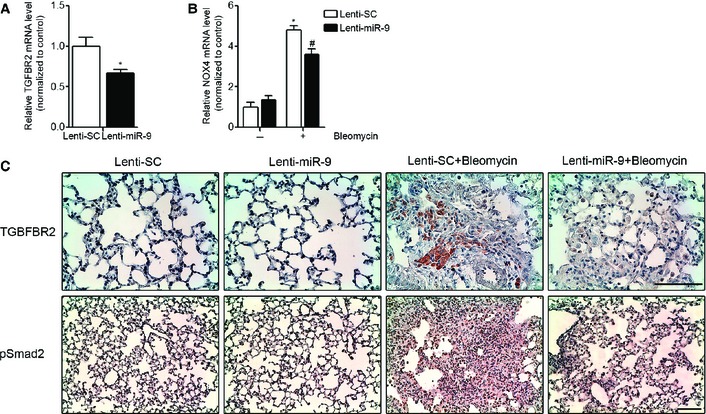
- qRT–PCR analysis of TGFBR2 expression in lungs from mice administered lenti‐SC (control) or lenti‐miR‐9 (1 × 10⁶ i.f.u.) (n = 4 mice per group).
- qRT–PCR analysis of NOX4 expression in lungs from mice given lenti‐SC (control) or lenti‐miR‐9 (1 × 10⁶ i.f.u. per mouse) for 4 days followed by orotracheal bleomycin administration (1.5 U/kg body weight in 40 μl saline) or saline for 14 days (n = 4 mice per group).
- Microphotographs of TGFBR2 and pSmad2 expression in mouse lung samples described in (B) (n = 4 mice per group). Scale bars: 100 μm.
Reduction of miR‐9‐5p expression enhances experimental lung fibrosis
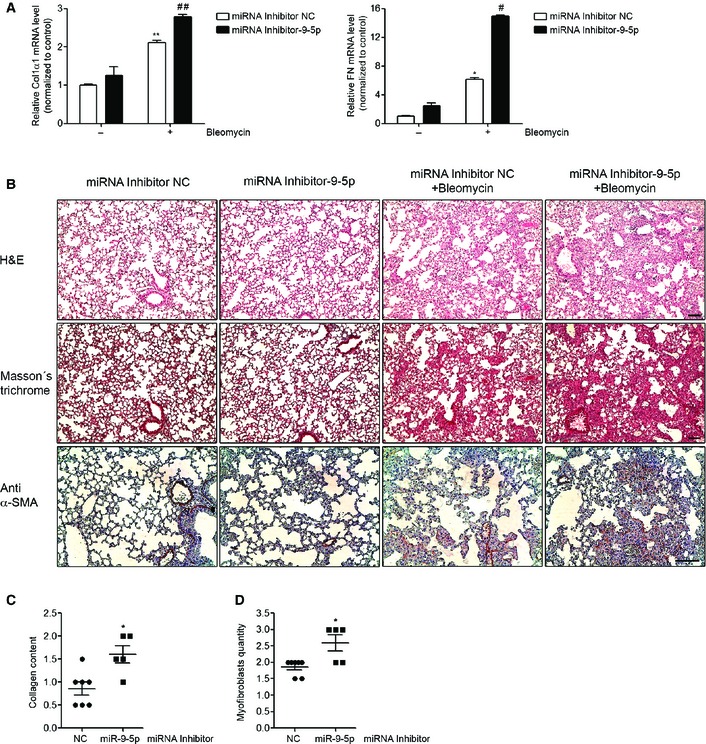
To further confirm the anti‐fibrotic role of miR‐9‐5p, mirVana miRNA inhibitor‐9‐5p was used to modulate miR‐9‐5p expression in vivo. A decrease of more than 60% in the expression of miR‐9‐5p was observed after orotracheal miRNA inhibitor‐9‐5p instillation compared to control mice (Fig EV5D). miRNA inhibitor‐9‐5p administration significantly increased the bleomycin‐induced mRNA expression of Col1α1 and FN (Fig 8A). Pulmonary fibrosis was determined in mice treated with miRNA inhibitor NC or miRNA inhibitor‐9‐5p 4 and 2 days before bleomycin administration. H&E staining showed an exacerbation of bleomycin‐induced LF in mice with reduced miR‐9‐5p expression (Fig 8B, upper panels). Masson's trichrome staining confirmed this finding (Fig 8B, middle panels). Similarly, pre‐treatment with miRNA inhibitor‐9‐5p enhanced the accumulation of myofibroblasts (α‐SMA positive cells) in bleomycin‐treated lungs (Fig 8B, lower panels). Lungs of miRNA inhibitor‐9‐5p pre‐treated mice displayed higher levels of collagen content (Fig 8C) and less myofibroblasts (Fig 8D) compared to lungs of miRNA inhibitor NC pre‐treated mice. The amplification of the fibrotic response when miR‐9‐5p expression was diminished supports the preventive role of miR‐9‐5p in LF.
Figure 8. miR‐9‐5p inhibition exacerbates pulmonary fibrosis in mice.
-
AqRT–PCR analysis of Col1α1 and FN expression in lungs from mice administered miRNA inhibitor NC (control) or miRNA inhibitor‐9‐5p (7 mg/kg body weight in 40 μl saline) 4 and 2 days before orotracheal instillation of bleomycin (1.5 U/kg body weight in 40 μl saline) or saline for 10 days (n = 3–6 mice per group).
-
BMicrophotographs of H&E (upper panels) and Masson's trichrome staining (middle panels) and α‐SMA expression (lower panels) from lung sections of mice treated as described in (A) (n = 3–7 mice per group). Scale bars: 100 μm.
-
C, DSemiquantitative determination (grade 0 to 3) of the collagen content (C) and the quantity of myofibroblasts (D) in lung tissue samples from mice treated as described in (A) (n = 5–7 mice per group). Each mouse is represented by a symbol, dots represent miRNA inhibitor NC and squares represent miRNA inhibitor‐9‐5p‐treated mice, respectively.
miR‐9‐5p is up‐regulated in peritoneal dialysis patients and prevents mesothelial to mesenchymal transition in peritoneal mesothelial cells
PMCs that undergo an MMT are characterized by changes in cell morphology, a disruption of tight junctions and a loss of cell polarity acquiring stronger migratory and invasive capacities, which allow these cells to invade the submesothelial stroma, where they contribute to PF and angiogenesis and ultimately lead to peritoneal membrane failure 15, 42, 43. TGF‐β1 is the main regulator of MMT in PMCs 44. Given the potential regulatory role of miR‐9‐5p in LF, we sought to study if this action could be extended to PF. Human MCs isolated from effluents in the dialysis fluid of patients under‐going continuous PD were classified in epithelioid (epith) and non‐epithelioid (non‐epith) MCs according to their morphological features (Appendix Fig S5A) and mRNA expression levels of E‐cadherin (CDH1), Col1α1 and FN (Appendix Fig S5B). Non‐epith MCs showed increased expression levels of miR‐9‐5p compared to epith MCs (Fig 9A). Additionally, MCs isolated from effluents exhibited increased expression of miR‐9‐5p compared with MCs derived from omentum (Fig 9A). miR‐9‐5p was also up‐regulated in omentum‐derived MCs after TGF‐β1 treatment (Fig 9B). Furthermore, over‐expression of miR‐9‐5p in omentum‐derived MCs abrogated TGF‐β1‐induced expression of α‐SMA, Col1α1 and FN (Fig 9C), similar to lung fibroblasts. Consistently, up‐regulation of miR‐9‐5p decreased α‐SMA protein levels in omentum‐derived MCs (Fig 9D) and reduced their invasive capacity into the ECM in response to TGF‐β1 (Fig 9E), an essential feature of their contribution to PF. Increasing miR‐9‐5p levels reduced TGFBR2 and TGF‐β1‐induced NOX4 mRNA expression (Fig 9F and G), in consistence with our previous observations.
Figure 9. miR‐9‐5p is up‐regulated in non‐epith effluent‐derived MCs from PD patients, attenuates TGF‐β1‐induced fibrogenesis and regulates TGFBR2 and NOX4 expression in omentum‐derived MCs.
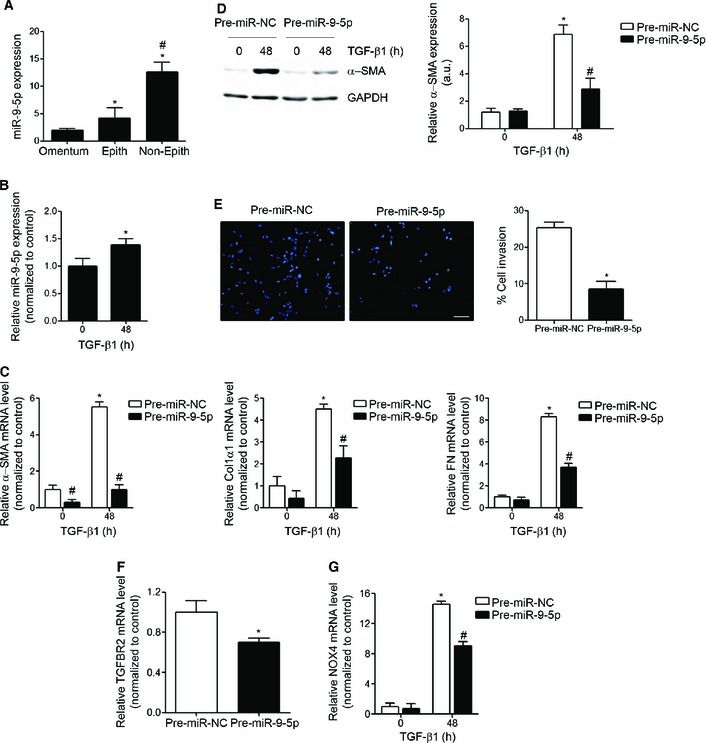
- qRT–PCR analysis of miR‐9‐5p expression in omentum‐derived MCs (n = 3) epith (n = 5) and non‐epith (n = 4) effluent‐derived MCs. *P ˂ 0.05 compared to omentum‐derived MCs and # P ˂ 0.05 compared to epith effluent‐derived MCs.
- qRT–PCR analysis of miR‐9‐5p expression in omentum‐derived MCs treated with 5 ng/ml TGF‐β1 for 48 h (n = 3). *P ˂ 0.05 compared to untreated cells.
- qRT–PCR analysis of α‐SMA, Col1α1 and FN in omentum‐derived MCs transfected with 40 nM pre‐miR‐NC (control) or pre‐miR‐9‐5p and treated with 5 ng/ml TGF‐β1 for 48 h (n = 3). *P < 0.05 compared to negative control‐transfected cells and # P < 0.05 compared to the corresponding negative control time point.
- Western blot analysis (left) and quantification (right) of α‐SMA protein levels in cells treated as described in (C) (n = 3). a.u., arbitrary units. *P < 0.05 compared to negative control‐transfected cells and # P < 0.05 compared to the corresponding negative control time point.
- Fluorescence images (left) and quantification (right) of collagen matrix invasion in omentum‐derived MCs transfected with either 40 nM pre‐miR‐NC or pre‐miR‐9‐5p in response to TGF‐β1 for 24 h (n = 3). Nuclei were stained with DAPI (blue). Scale bar: 100 μm.
- qRT–PCR analysis of TGFBR2 expression in omentum‐derived MCs transfected with 40 nM of pre‐miR‐NC (control) or pre‐miR‐9‐5p for 48 h (n = 3).
- qRT–PCR analysis of NOX4 expression in omentum‐derived MCs treated as described in (C) (n = 3).
Discussion
In this study, miR‐9‐5p has been identified as a novel miRNA included in two distinct, but closely related, sets of microRNAs that have been recently defined, the redoximiRs, redox sensitive microRNAs 30, and the fibromiRs, miRNAs that show an aberrant expression during the development of fibrosis 26. Our results support a model in which increased ROS, a common pathological feature of human fibrosis 45 on one side, and TGF‐β1 actions, including TGF‐β1 ROS production, on the other induce an increase in the levels of miR‐9‐5p (Fig 10). Over‐expression of miR‐9‐5p in lung fibroblasts prevented myofibroblast differentiation, activation, migration and invasion while blocking the TGF‐β1‐dependent effects through the inhibition of the Smad‐dependent pathway. Smad3/4 activation, Smad2 phosphorylation and Smad2/3 nuclear translocation are conspicuously delayed in lung fibroblasts with increased levels of miR‐9‐5p. Exogenously enhanced expression of TGFBR2 attenuated the inhibitory effect of miR‐9‐5p on TGF‐β1‐induced Smad2 phosphorylation, indicating that TGFBR2 was important for miR‐9‐5p inhibition of the TGF‐β‐mediated fibrogenesis signaling pathway. Synthesis and deposition of ECM were also prevented by over‐expressing miR‐9‐5p. This protective role for LF was confirmed in mice with enhanced expression of miR‐9‐5p. By contrast, loss‐of‐function approaches where miR‐9‐5p was inhibited resulted in an enhanced fibrogenic phenotype, both in cells and whole animal studies. Finally, the increased abundance of miR‐9‐5p in IPF specimens and in cells from PD patients is highly suggestive of a possible implication of this miRNA in the setting of human fibrosis.
Figure 10. Regulation of fibrogenesis by miR‐9‐5p.
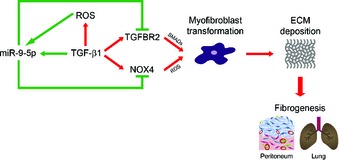
ROS and TGF‐β1 induce miR‐9‐5p expression. Over‐expression of miR‐9‐5p in lung fibroblasts and omentum‐derived MCs blocks TGFBR2 and NOX4 expression, thus preventing myofibroblast differentiation, ECM deposition and organ fibrogenesis.
TGF‐β itself can alter the expression of numerous miRNAs. It has been reported that the signal transducers of the TGF‐β signaling cascade, SMADs, not only regulate gene expression at the level of transcription but also control Drosha‐mediated miRNA processing 46, 47. Our results support the idea that TGF‐β1 increased miR‐9‐5p expression levels in lung fibroblasts by inducing pri‐miR‐9 transcription. In humans, miR‐9 can be generated by the processing of three different miR‐9 primary transcripts encoded by distinct genes located in different chromosomes (1, 5 and 15). Inspection of the genomic sequence of miR‐9 genes by using the BLAST (Basic Local Alignment Search Tool) algorithm 48 modified with ad hoc Python scripts identified the presence of at least two Smad‐binding elements (SBEs) 33, 49 in the putative promoter region of miR‐9‐1 and at least another two for miR‐9‐3, indicating that both genes are potentially regulated by TGF‐β1. This observation turned miR‐9 into a novel TGF‐β1‐target gene. However, the regulation of miR‐9‐5p processing by SMADs cannot be excluded and needs to be further investigated. Our results also indicate that TGF‐β1 increases miR‐9‐5p expression levels by a ROS‐dependent mechanism.
Our data support the existence of an auto‐regulatory feedback loop between TGF‐β1 and miR‐9‐5p. We propose that TGF‐β1 triggers simultaneous pro‐ and anti‐fibrotic signals, and hence, miR‐9‐5p would contribute to limit fibrogenesis by counteracting the cascade of pro‐fibrotic stimuli elicited by TGF‐β1, including ROS, in the context of an homeostatic response. It is reasonable to assume that levels of miR‐9‐5p induced by TGF‐β1 or bleomycin are low compared to those reached after exogenous miR‐9‐5p administration. As a consequence, the balance toward fibrosis would prevail, further leading to failure in the prevention of myofibroblast transformation and full establishment of a fibrotic phenotype. Participation in feedback loops is a common pathogenic mechanism of fibromiRs 26. In most cases, changes in fibromiR expression inhibit negative fibrogenic or induce pro‐fibrogenic mechanisms and cause a positive feed‐forward loop that perpetuates the activation of a fibrogenic pathway, thus sustaining the pro‐fibrotic phenotype 29. In the context of LF, this fact is particularly well illustrated by miR‐21, which is up‐regulated in the lungs of bleomycin‐treated mice and IPF patients and promotes TGF‐β‐induced fibrogenic activation of pulmonary fibroblasts by targeting Smad7 28. By contrast, the expression of several members of the miR‐29 family has been shown to be reduced in lungs of bleomycin‐treated animals and IPF patients and it has been involved in inhibiting ECM protein synthesis, thus suggesting an anti‐fibrotic function 50, 51. In keeping, let‐7d has been found to be decreased in IPF lungs and this reduction has been related to the dramatic phenotypic changes occurring in the alveolar epithelia of these patients 51. Although less common, fibromiRs can participate in negative feedback loops to promote fibrosis 52.
TGFBR2 is a transmembrane serine/threonine kinase receptor necessary for TGF‐β1 signal transduction 53 and has been implicated in lung development and pulmonary disease 35. TGF‐β1 induces NOX4 mRNA and protein expression in lung fibroblasts and NOX‐4‐dependent H2O2 generation is required for myofibroblast differentiation, synthesis of ECM proteins and contractility mediated by TGF‐β1. NOX4 has been further invoked as an important player in the development of LF 10, 54. TGFBR2 and NOX4 are proposed to represent direct targets of miR‐9‐5p not only by in silico analysis and further molecular validation but also by data demonstrating reduced action of the miRNA in the presence of exogenously enhanced expression of these proteins. Our results are consistent with the notion that miR‐9‐5p causes degradation of TGFBR2 and TGF‐β1‐induced NOX4 mRNAs and also interferes with TGFBR2 and TGF‐β1‐induced NOX4 protein translation. The ability of miR‐9‐5p to reduce the levels of both target genes in lung fibroblasts constitutes one of the plausible mechanisms to explain the anti‐fibrotic action of miR‐9‐5p. However, it is possible that other targets of miR‐9‐5p within the signaling pathways related to TGF‐β and/or ECM synthesis also contribute to this outcome. Indeed, we demonstrated that over‐expression of miR‐9‐5p results in the repression of additional genes belonging to the TGF‐β pathway. For example, the Col1α1 gene has two poorly conserved BSs for miR‐9‐5p, as the TargetScan database predicts, but whether or not it is a direct target of this miRNA remains to be proven. Additionally, the effects in the expression reduction of other predicted miR‐9‐5p targets will need to be tested in future studies, especially those related to the TGF‐β1 signaling pathway, like TGFBR1, Smad4 or integrins because of their essential role in lung fibrosis development 2, 7, 55, 56, 57. Concomitantly, other miR‐9‐5p‐predicted target genes implicated in additional signaling activated during LF, such as the WNT/β‐catenin pathway 58, or related to the inflammatory immune response 2, 7 should be explored. Finally, some studies have suggested an alternative miRNA mechanism for silencing gene expression by binding to promoter regions in human cells 59, 60. microPIR software (microRNA‐Promoter Interaction Resource, http://www4a.biotec.or.th/micropir/) 61 predicted the existence of miR‐9‐5p BSs in the promoters of TGF‐β‐related genes, Smads, TGFBRs, NOX4 and TGF‐β, and also in key fibrotic markers, α‐SMA, or Col1α1 (data not shown). This suggests that miR‐9‐5p could also carry out its anti‐fibrotic role by affecting the expression of some of these genes, although this hypothesis needs to be confirmed.
The involvement of dysregulated TGF‐β signaling is a well‐established pathogenetic mechanism in IPF 7. Our data strongly suggest that miR‐9‐5p controls this process in an attempt to reduce the excessive pro‐fibrotic signals promoted by TGF‐β. However, although mice with miR‐9‐5p over‐expression exhibited attenuation of LF, detailed histological analysis suggested that it failed to entirely abrogate the fibrotic phenotype. In spite of a miR‐9‐5p‐induced decrement in the expression of TGFBR2 and NOX4 and reduced levels of Smad2 phosphorylation, indicating down‐regulation of the TGF‐β pathway, slightly increased matrix deposition and moderately enhanced α‐SMA and ECM gene expression were still observed in lungs from animals after bleomycin instillation. Potential explanations for this limited action include the existence of TGF‐β‐independent pro‐fibrogenic stimuli perduring in resident fibroblasts, alternative TGF‐β signaling mediated by receptors other than TGFBR2 and/or signaling through molecules different from Smads. In addition, matrix generation by non‐resident fibroblasts was not ruled out.
In the lung, as in other organs, the origin of myofibroblasts is still unclear and a matter of controversy 37. Some authors have proposed that they can emerge from mesoderm‐derived pleural MCs in a process known as MMT 62, 63. We have extended the action of miR‐9‐5p precisely to this scenario and results obtained in PMCs confirmed that miR‐9‐5p also plays a significant preventive role in the TGF‐β1‐mediated transformation of MCs into fibrogenic myofibroblasts. Increasing miR‐9‐5p levels significantly reduced the invasive capacity of MCs, this representing one mechanism preventing the accumulation of MC‐derived myofibroblasts in the submesothelial compact zone of the peritoneum, therefore protecting it from the initiation of the fibrotic process. Noteworthy, miR‐9‐5p over‐expression also decreased TGFBR2 and TGF‐β1‐induced NOX4 levels. This may represent a potential mechanism contributing to the anti‐fibrotic role of miR‐9‐5p in PMCs. The increased expression of miR‐9‐5p observed in human non‐epith compared to epith MCs reinforces the protective role for miR‐9‐5p in the development of PF. The capacity of miR‐9‐5p to inhibit the pro‐fibrogenic transformation induced by TGF‐β1, not only in pulmonary fibroblasts but also in PMCs and the increased miR‐9‐5p expression in IPF patients and in omentum‐derived MCs of PD patients also confer miR‐9‐5p the potential of playing a more general counter‐regulatory role in human organ fibrosis, which should be addressed in other pathological contexts.
Importantly, recent studies have emerged demonstrating that miRNAs are also externalized from cells and transported into body fluids, thereby shuttling genetic information from a donor to a recipient cell 64, 65, 66. Although the secretory mechanism remains essentially unknown, circulating miRNAs represent not only potential non‐invasive biomarkers for many diseases but also tools to monitor their onset and progress as well their therapeutic response 65, 67. miRNAs secreted by immune cells, stem cells, adipocytes and blood cells have recently been identified 64. It has been shown that cancer cells release microvesicles that contain miR‐9 68. The secretion of miR‐9‐5p in a fibrotic context could pave the way to establish it as a novel serum biomarker for the diagnosis and prognosis in organ fibrosis. Currently, we believe that our results purport miR‐9‐5p as a potential therapeutic tool for human organ fibrosis.
Materials and Methods
Cell culture and treatments
The human fetal lung fibroblast cell line HFL‐1 (CCL‐153) was obtained from American Type Culture Collection (ATCC, VA). Cells were grown in F12K medium (ATCC) containing 10% (vol/vol) FBS (HyClone Laboratories, Logan, UT) and 1% (vol/vol) penicillin/streptomycin (Gibco, Rockville, MD) at 37°C in 5% CO2. For treatments, cells were serum starved overnight and then incubated with 100 μM hydrogen peroxide (H2O2) (Sigma‐Aldrich, St. Louis, MO), 5 ng/ml recombinant human transforming growth factor beta 1 (TGF‐β1) (R&D Systems, Minneapolis, MN), 2′,7′‐dichlorofluorescein diacetate (DCFH‐DA, Invitrogen, Carlsbad, CA), polyethyleneglycol (PEG) (Sigma‐Aldrich), and 100 units/ml PEG‐catalase (Sigma‐Aldrich) for the indicated times. Human mesothelial cells (MCs) were isolated from omentum samples of patients undergoing unrelated abdominal surgery or from effluents of PD patients as previously described 69. MCs were cultured in Earle's M199 medium (Sigma‐Aldrich) supplemented with 20% FBS, 2% Hepes 1 M (Sigma‐Aldrich), 50 U/ml penicillin/50 μg/ml streptomycin and 2% Biogro‐2 (Biological Industries, Beit Haemek, Israel). The purity of MCs cultures was determined by the expression of intercellular adhesion molecule (ICAM)‐1, calretinin and cytokeratins. MCs cultures were negative for von‐Willebrand factor and CD45, ruling out any contamination by endothelial cells or macrophages 69, 70. To induce MMT in vitro, omentum‐derived MCs were treated for 48 h with 5 ng/ml of TGF‐β1 (R&D Systems). MCs isolated from PD patients were classified into two groups: epithelioid (epith) (n = 5) and non‐epithelioid (non‐epith) (n = 4) MCs 12, 71, 72.
Transfection of miRNA precursors and inhibitors
Cells at 60% confluence were transfected with 40 nM of either pre‐miR™ miRNA precursor of miR‐9‐5p (pre‐miR‐9‐5p) (AM17100, Ambion, Carlsbad, CA) or miR‐9 inhibitor (miRNA Inhibitor‐9) (4464088, Ambion) using Lipofectamine 2000 (Invitrogen). In all experiments an equal concentration of a non‐targeting sequence Pre‐miR™ miRNA Precursor Negative Control #1 (pre‐miR‐NC) (AM17110, Ambion) or miRNA Inhibitor Negative Control #1 (miRNA Inhibitor NC) (4464079, Ambion) was used.
Transfection of plasmids
HFL‐1 cells were used for transient cDNA expression. Transfections (3 μg of plasmid) were performed by electroporation using the Electro Cell Manipulator 600 (BTX, San Diego, CA). The pCMV5 empty vector and the pCMV5‐TGFBR2 expression vector were kindly provided by Dr. Carmelo Bernabéu (Centro de Investigaciones Biológicas, CSIC, Madrid, Spain). An expression vector containing the human NOX4 open reading frame (pCMV5‐NOX4) was purchased from Origene (Rockville, MD). The pCMV6‐AC‐GFP empty vector was also purchased from Origene (Rockville, MD). The efficiency of transfection was ~20–30%. The over‐expression of TGFBR2 and NOX4 was confirmed by qRT–PCR (primer sequences used for mRNA quantification are shown in Table EV5).
RNA extraction
Total RNA was isolated from cells and lung tissue using the miRNeasy Mini Kit (QIAGEN, Valencia, CA). For RNA extraction in paraffin‐embedded human samples, miRNeasy FFPE Kit (QIAGEN) was used. RNA quantity and quality were determined at 260 nm by a Nanodrop spectrophotometer.
microRNA profiling
Taqman miRNA low‐density arrays (TLDAs) (Applied Biosystems, Foster City, CA) were selected as the platform for microRNA profiling. This platform consists of a two‐card set (Cards A and B) for a total of 754 unique assays specific for human miRNAs present in the Sanger miRBase v14 (http://microrna.sanger.ac.uk). After RNA extraction, miRNA present in 500 ng of total RNA was subjected to reverse transcription using the Megaplex RT Primer Human Pool A and B and the Taqman microRNA reverse transcription kit (Applied Biosystems) according to the manufacturer's instructions. The resultant cDNAs were analyzed using Human Card Set v3. Reactions were incubated in an Applied Biosystems 7900HT Fast Real‐Time PCR system in 384‐well TLDAs using the manufacturer's recommended protocol.
Statistical analysis of TLDAs data
The ABI TaqMan SDS v2.2 software was utilized to obtain raw threshold cycle (C t) value for each miRNA. Only miRNAs with a C t ≤ 36 were included in the analyses. The C t data were analyzed with the StatMiner 4.2.8 software (Integromics; Madrid, Spain). Mammalian small nuclear RNAU6 (snRNAU6) was used as endogenous control gene for normalizing gene expression levels after application of the geNorm 73 and NormFinder 74 algorithms. The delta C t (ΔC t) value was calculated by normalizing C t values to the endogenous housekeeping snRNAU6. The heat map was generated by the real‐time PCR data presented as ΔC t. Heat map scale bars indicate ΔC t values and red and green colors depict low and high expression levels, respectively. miRNAs showing similar ΔC t values were grouped by hierarchical clustering. The delta delta C t (ΔΔC t) value was calculated by subtracting the ΔC t of the reference sample (control cells) from the ΔC t of each H2O2‐treated sample. Relative quantification (RQ) or fold change of each miRNA was generated using the method 75. Differentially expressed miRNAs were identified by the parametric Limma test 76. To take the multiple hypotheses testing into account, P‐values were adjusted (adj.) using the Benjamini–Hochberg false discovery rate (FDR) correction 77. Results were graphed in a volcano plot and miRNAs with Benjamini–Hochberg adj. P‐values < 0.05 (Table EV1) were highlighted.
Quantification of miRNA expression
Quantification of miR‐9‐5p expression was performed using the miRCURY Locked Nucleic Acid (LNA) Universal RT microRNA PCR (Exiqon, Denmark). Following reverse transcription (RT), the cDNA template was amplified using microRNA‐specific LNA primers for mature miR‐9‐5p (204513, Exiqon, Denmark). qRT–PCR was performed in a 96‐well Bio‐Rad CFX96 RealTime PCR System with a C1000 Thermal Cycler using iQ™ SYBR Green Supermix (Bio‐Rad, Hercules, CA). A C t value for triplicate wells was obtained from each amplification curve using the CFX Manager Bio‐rad software (Bio‐Rad). C t values were normalized to the endogenous control snRNAU6. Relative miRNA expression was determined using the method 75.
Quantification of pri‐miRNAs expression
Quantitative expression studies of primary miR‐9 (pri‐miR‐9) transcripts were performed using TaqMan Pri‐miRNA Assays (Applied Biosystem). cDNA was obtained using the High Capacity RNA‐to‐cDNA Kit (Applied Biosystem) and amplified using specific primers for pri‐miR‐9‐1, pri‐miR‐9‐2, or pri‐miR‐9‐3 (Hs03303201_pri, Hs03303202_pri, and Hs03293595_pri, Applied Biosystem) in separate reactions. qRT–PCR was performed in an Applied Biosystems 7900HT Fast RT–PCR system. The expression level of each pri‐miR was calculated according to the method 75, using the GAPDH gene as an internal control. All reactions were performed in triplicate.
Analysis of mRNA expression
RT was carried out with 500 ng of total RNA using the iScript™ cDNA Synthesis kit (Bio‐Rad). qRT–PCR was carried out with the iQ™SYBR Green Supermix (Bio‐Rad), using a 96‐well Bio‐Rad CFX96 RT–PCR System with a C1000 Thermal Cycler (Bio‐Rad). A C t value was obtained from each amplification curve using CFX96 analysis software provided by the manufacturer. Relative mRNA expression was determined using the method 75. GAPDH gene was used for normalization purposes. The primer sequences used for mRNA quantification are shown in Table EV5.
microRNA target prediction bioinformatics tools and functional clustering analyses
The online microRNA databases and target prediction tools TargetScan (http://www.targetscan.org), miRanda (http://www.microrna.org) and miRwalk (http://www.umm.uni-heidelberg.de/apps/zmf/mirwalk/) were used to identify potential miR‐9‐5p targets (Table EV2). These were selected for Functional Annotation Clustering in the bioinformatics Database for Annotation, Visualization and Integrated Discovery (DAVID) v6.7 (http://david.abcc.ncifcrf.gov/) 78 using the Kyoto Encyclopedia of Genes and Genomes (KEGG) pathway databases. Enrichment score was reported as the minus log transformation of the geometric mean of P‐values (modified Fisher's exact test). The P‐value was corrected for multiple hypothesis testing with the Benjamini–Hochberg FDR algorithm 77. Terms with a corrected P < 0.05 were considered significant. This same list was used for comparison with genes related to the “TGF‐β signaling pathway” (Tables EV3 and EV4).
Luciferase assays and site‐specific mutagenesis
To characterize the candidate sites, cDNA fragments corresponding to the three prime untranslated regions (3′ UTRs) of human TGFBR2 and NOX4 were amplified by RT–PCR from genomic DNA of HFL‐1 cells. For site‐specific mutagenesis, the regions in the 3′ UTRs complementary to the seed sequence of miR‐9‐5p were mutated using the Multisite‐QuikChange directed mutagenesis kit (Stratagene, La Jolla, CA) and primers used are shown in Table EV6. Point mutations (PM) are a two‐base change in the seed sequence for miR‐9‐5‐p. For luciferase assays, WT or mutant 3′ UTRs were cloned into the psiCHECK‐2 vector (Promega, Madison, WI). Inserts were sequenced to confirm appropriate structure. The activity of Renilla luciferase was normalized by the internal firefly luciferase activity. HFL‐1 cells were transiently co‐transfected with 125 ng psiCHECK‐2/TGFBR2 or psiCHECK‐2/NOX4 reporter plasmids and 40 nM pre‐miRs by triplicate. Luciferase assays were performed 24 h later using the Dual‐Luciferase reporter system (Promega, Madison, WI). The Renilla and firefly luciferase signals were detected using a Glomax multidetection system (Promega, Madison). Smad‐specific luciferase reporter (CAGA‐luc) was a generous gift from Dr. Aris Moustakas (Biomedical Center Uppsala, Sweden) 33. Transient transfection experiments were performed with HFL‐1 cells and promoter activity was estimated by luminometry as described previously using pRL‐CMV plasmid (a Renilla luciferase under the control of the CMV promoter) for normalization purposes 79.
Analysis of intracellular ROS by flow cytometry
HFL‐1 cells were incubated with 10 μM DCFH‐DA for 15 min at 37°C in humidified air with 5% CO2 at 37°C. After incubation, the single cell fluorescence of 10,000 cells for each sample was measured using a BD FACSCanto™ II High Throughput Sampler flow cytometer (Becton Dickinson Bioscience, Franklin Lakes, NJ). All the data analyses were performed using Flow Jo v6.4.1 software (Treestar, Ashland, OR).
Western blot analysis and antibodies
Briefly, cells were washed with PBS, homogenized and lysed in 150 μl RIPA buffer containing 150 mM NaCl, 0.1% SDS, 1% sodium deoxycholate, 1% NP‐40 and 25 mM Tris–HCl pH 7.6, in the presence of protease (Complete, Roche Diagnostics, Mannheim, Germany) and phosphatase inhibitors (Sigma‐Aldrich). Cells were harvested by scraping and the samples were clarified by centrifugation at 10,000 g for 15 min at 4°C. Protein concentrations were determined by the BCA Protein Assay Kit (Thermo Scientific, Rockford, IL). Equal amounts of protein (10–50 μg) from the total extract were separated on 8–10% SDS–polyacrylamide gels and transferred onto nitrocellulose blotting membranes (GE Healthcare, Germany) at 12 V for 20 min in a semi‐dry Trans‐Blot Turbo system (Bio‐Rad). Membranes were blocked by incubation for 1 h with 5% non‐fat milk in PBS containing 0.5% Tween‐20 and blotted with specific antibodies to TGFβ‐RII (C16) (1:1,000, sc‐220, Santa Cruz Biotechnology), NOX4 (1:1,000, NB110‐58851, Novus Biologicals, Littleton, CO), α‐actin (1A4) (1:2,000, sc‐32251, Santa Cruz Biotechnology), fibronectin (1:1,000, F7387) and phosphorylated Smad2 pSmad2 (Ser465/Ser467) (1:1,000, 3101, Cell Signaling, Danvers, MA). After incubation with IRDye 800 goat anti‐rabbit and IRDye 600 goat anti‐mouse (1:15,000, LI‐COR Biosciences, Lincoln, NE) secondary antibodies, membranes were imaged in triplicates with the Odyssey Infrared Imaging System (LI‐COR Biosciences). Band sizing was performed using the ImageJ 1.42 software (http://rsb.info.nih.gov/ij) and relative protein expression was determined by normalizing to GAPDH (1:5,000, MAB374, Millipore, Bedford, MA). Phospho‐Smad2 activity was calculated by normalizing to total Smad2 (D43B4) (1:1,000, 5339, Cell Signaling). Protein fold changes were normalized to values of control cells.
Cell proliferation, cell viability and apoptosis assays
For cell counting, 20 × 103 lung fibroblasts per well were seeded into 24‐well plates. HFL‐1 cells were transfected with 40 nM pre‐miRs. Viable and non‐viable cells were counted and the average cell number from triplicate measurements was determined. After seeding 3 × 10³ transfected cells per well in 96‐well plates, cell viability was determined with the XTT assay, using the Cell Proliferation Kit II (Roche Diagnostics). Apoptotic cells were detected by FACS using the PE Annexin V Apoptosis Detection Kit I (BD Biosciences Pharmingen, San Diego, CA). Cells were analyzed in a BD FACSCanto™ II High Throughput Sampler flow cytometer (Becton Dickinson Bioscience). Apoptotic cell death was measured as PE Anexin V‐positive/7‐AAD‐negative cells.
Cell migration and invasion assays
Cellular migration and invasion assays were performed in 24‐trans‐well permeable supports with 8.0 μm pore size (Corning, MA). In brief, cells were transfected with 40 nM pre‐miR‐s as described above. After 48 h, cells were detached with trypsin‐EDTA (Gibco) and 3 × 10⁴ cells for migration and 5 × 10⁴ cells per well for invasion assays were suspended in serum‐free F12K medium (ATCC) and added to the upper chamber. Bottom wells were filled with serum‐free F12K medium containing 5 ng/ml TGF‐β1 (R&D Systems) as chemoattractant. For invasion assays inserts were pre‐coated with 50 μl of 300 μg/ml rat‐tail collagen I (BD Biosciences) at 37°C overnight. Cells were allowed to migrate or invade for 24 and 48 h at 37°C in 5% CO2. After incubation non‐moving cells on the top of the membrane were removed with a cotton swab. Membranes containing cells were fixed with 4% paraformaldehyde (PFA) for 10 min and washed with PBS. Nuclear staining was performed with DAPI (Sigma‐Aldrich) for 10 min. Membranes were mounted on slides using mowiol (Calbiochem, Nottingham, U.K.). Cell fluorescence was visualized in a Nikon Eclipse T2000U microscope. To determine the total number of cells per insert, migratory and invasive cells were counted in four random fields per slide under light microscopy with a 10× objective lens. This count was divided by the area of the viewing field and multiplied by the entire area of the insert. The percentage of migrating/invading cells was calculated by dividing this result by the total of cells seeded.
Immunofluorescence
HFL‐1 cells were seeded onto 24‐well plates containing 10‐mm‐diameter glass coverslips. They were transfected with 40 nM pre‐miRs. After 24‐h starvation cells were incubated with 5 ng/ml TGF‐β1 (R&D Systems) for the indicated times. After treatments cells were fixed with 4% PFA for 10 min and permeabilized with 0.25% Triton X‐100 in PBS for 5 min at room temperature. Cells were washed with PBS, blocked with 1% BSA in PBS for 1 h and incubated overnight at 4°C with anti‐α‐actin (1A4) (1:2,000, sc‐32251, Santa Cruz Biotechnology), anti‐fibronectin (1:1,000, F7387, Sigma‐Aldrich) and anti‐Smad2/3 (1:1,000, 610843, BD Biosciences). Nuclear staining was performed with DAPI (Sigma‐Aldrich). F‐actin was stained with tetramethylrhodamine isothiocyanate‐conjugated phalloidin (1:1,000, Sigma‐Aldrich). The cover slips were mounted on slides using mowiol (Calbiochem). Cell fluorescence was visualized by a Nikon Eclipse T2000U microscope.
Immunohistochemical analysis of mouse lung tissue
Lung tissue sections were deparaffinized and heated to expose the hidden antigens using Real Target Retrieval Solution containing citrate buffer, pH 6.0 (Dako, Glostrup, Denmark). Samples were pre‐treated with Real Peroxidase‐Blocking Solution (Dako) to block endogenous peroxidase. The primary antibodies employed were as follows: α‐actin (1A4) (1:600, sc‐32251, Santa Cruz Biotechnology), TGFβ‐RII (C16) (1:500, sc‐220, Santa Cruz Biotechnology) and phospho‐Smad2 (Ser465/Ser467) (1:600, 3101, Cell Signaling). Non‐specific binding of secondary antibodies was blocked by pre‐treating slides with goat serum. A biotinylated goat anti‐rabbit IgG was applied to detect rabbit primary antibodies and complexes were visualized using the R.T.U Vectastain Elite ABC Kit (Vector Laboratories, Burlingame, CA). Mouse primary antibodies were visualized applying the Vector M.O.M. Immunodetection Kit (Vector Laboratories, Burlingame, CA). Tissue sections were revealed using DAB (Dako) as chromogen and finally counterstained with hematoxylin. Slides were mounted with mowiol (Calbiochem). Images were taken using a Leica DMD108 microscopy (Leica Microsystems CMS GmbH, Wetzlar, Germany).
miRNA in situ hybridization (ISH)
For detection of miR‐9‐5p in mouse lung samples a specific 5′ and 3′‐DIG labeled miRCURY locked nucleic acid™ (LNA) oligonucleotide (Exiqon, Denmark) was used (miR‐9‐5p detection probe sequence: 5′‐TCATACAGCTAGATAACCAAAGA‐3′). The 5′ and 3′‐DIG labeled scramble miRNA (Exiqon) was used as a negative control (scramble probe sequence: 5′‐GTGTAACACGTCTATACGCCCA‐3′). ISH was performed according to Exiqon's protocol. Sections were developed with nitro‐blue tetrazolium chloride (NBT)/5‐bromo‐4‐chloro‐3‐indolyl‐phosphate (BCIP) color substrates (Roche Diagnostics). Slides were mounted with mowiol (Calbiochem). Positive blue cytoplasmic staining was observed with a Nikon Eclipse T2000U microscope.
Lentiviral vector construct
The lentivector‐based miRNA precursor constructs expressing the miR‐9‐5p (lenti‐miR‐9) (MMIR‐9‐1‐PA‐1) and the scramble negative control (lenti‐SC) (MMIR‐000‐PA‐1) were purchased from SBI System Biosciences (Mountain View, California). Pseudoviral particles were prepared using the pPACK‐F1 Lentivector packaging system (SBI System Biosciences) and HEK 293T producer cell line. The titration of pseudoviral particles generated with the lentiviral vectors was determined by calculating the percentage of positive GFP expression cells by flow cytometry in a BD FACSCanto™ II High Throughput Sampler flow cytometer (Becton Dickinson Bioscience) 72 h after infection. The lentivirus titers were calculated as described 80 and expressed in infection units (ifu)/ml.
Experimental pulmonary fibrosis model and in vivo delivery of lentiviral vectors and miRNA inhibitors
C57BL/6 mice were purchased from Charles River Laboratory (Wilmington, MA). LF was induced in 6–8‐week‐old C57BL/6 mice by application of bleomycin (Sigma‐Aldrich) as described 28 with some modifications. Mice were anesthetized with intraperitoneal injection of ketamine (100 mg/kg) plus xylazine (10 mg/kg). The tongues of anesthetized mice were gently pulled forward with forceps and bleomycin (1.5 U/kg body weight in 40 μl saline serum) was delivered into the oropharyngeal cavity. To determine the effect of miR‐9‐5p over‐expression in the bleomycin‐mice model of LF, 1 × 10⁶ ifu/ml of lentivirus were diluted in 40 μl saline serum and delivered into the mice oropharyngeal cavity 4 days before bleomycin instillation. Delivery of lentiviral vectors was tested by detection of GFP expression in the lungs. To evaluate the persistence of lentiviral transduction in our model miR‐9‐5p expression level was determined by qRT–PCR as described above. To modulate the expression of miR‐9‐5p in vivo 7 mg/kg body weight in 40 μl saline serum per mouse of miR‐9‐5p Inhibitor (miRNA Inhibitor miR‐9‐5p, MH10022, mirVana custom Inhibitor, Ambion) was delivered into the oropharyngeal cavity 4 and 2 days before bleomycin instillation. Sequestering of miR‐9‐5p was determined by analysis of miR‐9‐5p expression by qRT–PCR as described above. As controls WT animals were provided with the same volume of saline serum, lenti‐SC, or miRNA Inhibitor Negative Control (miRNA Inhibitor NC, 4464079, mirVana Inhibitor, Ambion). Mice were sacrificed at the indicated time points and the PBS‐perfused lungs were harvested for analysis. The extent of LF was assessed by hematoxylin and eosin (H&E) and Masson's trichrome stainings in mice paraffin‐embedded lung samples. Images were taken using a Leica DMD108 microscopy (Leica Microsystems). mRNA expression levels were determined by qRT–PCR. Total fibrotic areas per lung (mm2) were quantified using the Digital Microimaging Device software (Leica Microsystems). Histopathologic evaluation was performed in a blinded fashion by two independent pathologists using a progressive score (from grade 0 to 3). Fibrosis scoring included evaluation of ECM deposits and presence of fibroblasts. Animals were handled in agreement with the Guide for the Care and Use of Laboratory Animals contained in Directive 2010/63/EU of the European Parliament. Approval was granted by the local ethics review board of Centro de Biología Molecular “Severo Ochoa” in Madrid.
Human IPF patients' lung samples
Human lung tissue samples were obtained from surgical biopsies of patients from Hospital “Ramon y Cajal” in Madrid, after written approval and according to the Spanish and European legislation. Seven lung tissue samples with the diagnosis of IPF and three samples from histologically normal lungs (controls) from the Patho‐logy Department collection were selected. Samples were analyzed by H&E and Masson's trichrome stainings. Images were taken with a DMD108 microscopy (Leica Microsystems). RNA extraction and miR‐9‐5p expression level analysis were performed as described above. The protocol was approved by the ethics committee of the Hospital “Ramon y Cajal” in Madrid.
Statistical analysis
Data with only one grouping variable were analyzed with Kruskal–Wallis non‐parametric ANOVA with post‐test multiple comparisons using Dunn's procedure or by nonparametric two‐tailed Mann–Whitney U‐test. Differences between only two groups were analyzed statistically with nonparametric two‐tailed Mann–Whitney U‐test. Data were analyzed with use of version 5.01 of the GraphPad Prism package (La Jolla, CA). A value of P < 0.05 was considered to be statistically significant (*/#/@: P < 0.05, **/##: P < 0.01). Data are reported as mean ± SEM.
Author contributions
SL conceived and directed research; SL and MFF designed the experiments; MFF performed and analyzed the majority of experiments; OB helped with the bleomycin‐induced LF mouse model; PS and MR performed histological analysis; CED prepared the luciferase reporter constructs; EBR provided technical assistance for mouse experiments; HP and MLGB supervised and conducted patient sample collection and analyses; RR performed the miRNA arrays and helped with the bioinformatics analysis; MLC provided valuable reagents and advice; MLGB provided helpful advice and discussion; all authors discussed the results; and SL and MFF wrote the manuscript.
Conflict of interest
An European patent based on this work was filed in June 2014 (Application No./Patent No.: 14382239.3‐1401) by Consejo Superior de Investigaciones Científicas (CSIC) (Madrid, Spain) and GENDIAG Laboratories (Barcelona, Spain).
Supporting information
Appendix
Expanded View Figures PDF
Table EV1
Table EV2
Table EV3
Table EV4
Table EV5
Table EV6
Review Process File
Source Data for Figure 3B
Acknowledgements
We thank Laura Fernández Martín, Jaime Fernández Barrera, Javier Casares and Miguel Ángel Alonso from the CBMSO (Madrid, Spain) for their technical assistance in the plasmid transfection by electroporation, María Jesús Martín Bermejo, Francisco Javier Nieto and Paola Bovolenta from the CBMSO (Madrid, Spain) for their technical assistance in the lentivirus production and ISH protocols and the genomic and flow cytometry units at the CBMSO (Madrid, Spain) for excellent technical support. This work was supported by grants from the Ministerio de Economía y Competitividad (MINECO) SAF 2012‐31338 (SL), SAF 2013‐47611 (MLC) and CSD 2007‐00020 (SL), Instituto de Salud Carlos III REDinREN RD12/0021/0009 (SL and LGB) and FIS PS12/00094 (LGB), Comunidad de Madrid “Fibroteam” S2010/BMD‐2321 (SL and MLC) and Fundación Renal “Iñigo Alvarez de Toledo” (SL), all from Spain. Supported by European Cooperation in Science and Research COST actions BM‐1203 (EU‐ROS) and BM‐1005 (ENOGAS) (SL). The CBMSO receives institutional support from Fundación “Ramón Areces”. Marta Fierro was supported by a postdoctoral grant of the Juan de la Cierva Program; Óscar Busnadiego and Cristina Espinosa have been fellows of the FPI program, all from MINECO, Spain.
EMBO Reports (2015) 16: 1358–1377
References
- 1. Wynn TA (2008) Cellular and molecular mechanisms of fibrosis. J Pathol 214: 199–210 [DOI] [PMC free article] [PubMed] [Google Scholar]
- 2. Wynn TA, Ramalingam TR (2012) Mechanisms of fibrosis: therapeutic translation for fibrotic disease. Nat Med 18: 1028–1040 [DOI] [PMC free article] [PubMed] [Google Scholar]
- 3. Meltzer EB, Noble PW (2008) Idiopathic pulmonary fibrosis. Orphanet J Rare Dis 3: 8 [DOI] [PMC free article] [PubMed] [Google Scholar]
- 4. Noble PW (2006) Idiopathic pulmonary fibrosis: natural history and prognosis. Clin Chest Med 27: S11–S16, v [DOI] [PubMed] [Google Scholar]
- 5. Nalysnyk L, Cid‐Ruzafa J, Rotella P, Esser D (2012) Incidence and prevalence of idiopathic pulmonary fibrosis: review of the literature. Eur Respir Rev 21: 355–361 [DOI] [PMC free article] [PubMed] [Google Scholar]
- 6. Noble PW, Barkauskas CE, Jiang D (2012) Pulmonary fibrosis: patterns and perpetrators. J Clin Invest 122: 2756–2762 [DOI] [PMC free article] [PubMed] [Google Scholar]
- 7. Wynn TA (2011) Integrating mechanisms of pulmonary fibrosis. J Exp Med 208: 1339–1350 [DOI] [PMC free article] [PubMed] [Google Scholar]
- 8. Amara N, Goven D, Prost F, Muloway R, Crestani B, Boczkowski J (2010) NOX4/NADPH oxidase expression is increased in pulmonary fibroblasts from patients with idiopathic pulmonary fibrosis and mediates TGFbeta1‐induced fibroblast differentiation into myofibroblasts. Thorax 65: 733–738 [DOI] [PMC free article] [PubMed] [Google Scholar]
- 9. Cucoranu I, Clempus R, Dikalova A, Phelan PJ, Ariyan S, Dikalov S, Sorescu D (2005) NAD(P)H oxidase 4 mediates transforming growth factor‐beta1‐induced differentiation of cardiac fibroblasts into myofibroblasts. Circ Res 97: 900–907 [DOI] [PubMed] [Google Scholar]
- 10. Hecker L, Vittal R, Jones T, Jagirdar R, Luckhardt TR, Horowitz JC, Pennathur S, Martinez FJ, Thannickal VJ (2009) NADPH oxidase‐4 mediates myofibroblast activation and fibrogenic responses to lung injury. Nat Med 15: 1077–1081 [DOI] [PMC free article] [PubMed] [Google Scholar]
- 11. Martin‐Garrido A, Brown DI, Lyle AN, Dikalova A, Seidel‐Rogol B, Lassegue B, San Martin A, Griendling KK (2011) NADPH oxidase 4 mediates TGF‐beta‐induced smooth muscle alpha‐actin via p38MAPK and serum response factor. Free Radic Biol Med 50: 354–362 [DOI] [PMC free article] [PubMed] [Google Scholar]
- 12. Aroeira LS, Aguilera A, Sanchez‐Tomero JA, Bajo MA, del Peso G, Jimenez‐Heffernan JA, Selgas R, Lopez‐Cabrera M (2007) Epithelial to mesenchymal transition and peritoneal membrane failure in peritoneal dialysis patients: pathologic significance and potential therapeutic interventions. J Am Soc Nephrol 18: 2004–2013 [DOI] [PubMed] [Google Scholar]
- 13. Krediet RT, Lindholm B, Rippe B (2000) Pathophysiology of peritoneal membrane failure. Perit Dial Int 20(Suppl 4): S22–S42 [PubMed] [Google Scholar]
- 14. Margetts PJ, Bonniaud P (2003) Basic mechanisms and clinical implications of peritoneal fibrosis. Perit Dial Int 23: 530–541 [PubMed] [Google Scholar]
- 15. Yanez‐Mo M, Lara‐Pezzi E, Selgas R, Ramirez‐Huesca M, Dominguez‐Jimenez C, Jimenez‐Heffernan JA, Aguilera A, Sanchez‐Tomero JA, Bajo MA, Alvarez V et al (2003) Peritoneal dialysis and epithelial‐to‐mesenchymal transition of mesothelial cells. N Engl J Med 348: 403–413 [DOI] [PubMed] [Google Scholar]
- 16. Yang AH, Chen JY, Lin JK (2003) Myofibroblastic conversion of mesothelial cells. Kidney Int 63: 1530–1539 [DOI] [PubMed] [Google Scholar]
- 17. Ambros V (2004) The functions of animal microRNAs. Nature 431: 350–355 [DOI] [PubMed] [Google Scholar]
- 18. Bartel DP (2004) MicroRNAs: genomics, biogenesis, mechanism, and function. Cell 116: 281–297 [DOI] [PubMed] [Google Scholar]
- 19. Hwang HW, Mendell JT (2006) MicroRNAs in cell proliferation, cell death, and tumorigenesis. Br J Cancer 94: 776–780 [DOI] [PMC free article] [PubMed] [Google Scholar]
- 20. Lau NC, Lim LP, Weinstein EG, Bartel DP (2001) An abundant class of tiny RNAs with probable regulatory roles in Caenorhabditis elegans . Science 294: 858–862 [DOI] [PubMed] [Google Scholar]
- 21. Pasquinelli AE, Reinhart BJ, Slack F, Martindale MQ, Kuroda MI, Maller B, Hayward DC, Ball EE, Degnan B, Muller P et al (2000) Conservation of the sequence and temporal expression of let‐7 heterochronic regulatory RNA. Nature 408: 86–89 [DOI] [PubMed] [Google Scholar]
- 22. Galasso M, Sana ME, Volinia S (2010) Non‐coding RNAs: a key to future personalized molecular therapy? Genome Med 2: 12 [DOI] [PMC free article] [PubMed] [Google Scholar]
- 23. Wu X, Piper‐Hunter MG, Crawford M, Nuovo GJ, Marsh CB, Otterson GA, Nana‐Sinkam SP (2009) MicroRNAs in the pathogenesis of Lung Cancer. J Thorac Oncol 4: 1028–1034 [DOI] [PMC free article] [PubMed] [Google Scholar]
- 24. Yang BF, Lu YJ, Wang ZG (2009) MicroRNAs and apoptosis: implications in the molecular therapy of human disease. Clin Exp Pharmacol Physiol 36: 951–960 [DOI] [PubMed] [Google Scholar]
- 25. Zorio E, Medina P, Rueda J, Millan JM, Arnau MA, Beneyto M, Marin F, Gimeno JR, Osca J, Salvador A et al (2009) Insights into the role of microRNAs in cardiac diseases: from biological signalling to therapeutic targets. Cardiovasc Hematol Agents Med Chem 7: 82–90 [DOI] [PubMed] [Google Scholar]
- 26. Pottier N, Cauffiez C, Perrais M, Barbry P, Mari B (2014) FibromiRs: translating molecular discoveries into new anti‐fibrotic drugs. Trends Pharmacol Sci 35: 119–126 [DOI] [PubMed] [Google Scholar]
- 27. Kumarswamy R, Volkmann I, Thum T (2011) Regulation and function of miRNA‐21 in health and disease. RNA Biol 8: 706–713 [DOI] [PMC free article] [PubMed] [Google Scholar]
- 28. Liu G, Friggeri A, Yang Y, Milosevic J, Ding Q, Thannickal VJ, Kaminski N, Abraham E (2010) miR‐21 mediates fibrogenic activation of pulmonary fibroblasts and lung fibrosis. J Exp Med 207: 1589–1597 [DOI] [PMC free article] [PubMed] [Google Scholar]
- 29. Pandit KV, Milosevic J, Kaminski N (2011) MicroRNAs in idiopathic pulmonary fibrosis. Transl Res 157: 191–199 [DOI] [PubMed] [Google Scholar]
- 30. Cheng X, Ku CH, Siow RC (2013) Regulation of the Nrf2 antioxidant pathway by microRNAs: new players in micromanaging redox homeostasis. Free Radic Biol Med 64: 4–11 [DOI] [PubMed] [Google Scholar]
- 31. Leask A, Abraham DJ (2004) TGF‐beta signaling and the fibrotic response. FASEB J 18: 816–827 [DOI] [PubMed] [Google Scholar]
- 32. Vaughan MB, Howard EW, Tomasek JJ (2000) Transforming growth factor‐beta1 promotes the morphological and functional differentiation of the myofibroblast. Exp Cell Res 257: 180–189 [DOI] [PubMed] [Google Scholar]
- 33. Dennler S, Itoh S, Vivien D, ten Dijke P, Huet S, Gauthier JM (1998) Direct binding of Smad3 and Smad4 to critical TGF beta‐inducible elements in the promoter of human plasminogen activator inhibitor‐type 1 gene. EMBO J 17: 3091–3100 [DOI] [PMC free article] [PubMed] [Google Scholar]
- 34. Thannickal VJ, Toews GB, White ES, Lynch JP III, Martinez FJ (2004) Mechanisms of pulmonary fibrosis. Annu Rev Med 55: 395–417 [DOI] [PubMed] [Google Scholar]
- 35. Li M, Krishnaveni MS, Li C, Zhou B, Xing Y, Banfalvi A, Li A, Lombardi V, Akbari O, Borok Z et al (2011a) Epithelium‐specific deletion of TGF‐beta receptor type II protects mice from bleomycin‐induced pulmonary fibrosis. J Clin Invest 121: 277–287 [DOI] [PMC free article] [PubMed] [Google Scholar]
- 36. Ying SY, Chang DC, Miller JD, Lin SL (2006) MicroRNA protocols. Perspectives. Methods Mol Biol 342: 351–358 [DOI] [PubMed] [Google Scholar]
- 37. Hinz B, Phan SH, Thannickal VJ, Prunotto M, Desmouliere A, Varga J, De Wever O, Mareel M, Gabbiani G (2012) Recent developments in myofibroblast biology: paradigms for connective tissue remodeling. Am J Pathol 180: 1340–1355 [DOI] [PMC free article] [PubMed] [Google Scholar]
- 38. Barkauskas CE, Noble PW (2014) Cellular mechanisms of tissue fibrosis. 7. New insights into the cellular mechanisms of pulmonary fibrosis. Am J Physiol Cell Physiol 306: C987–C996 [DOI] [PMC free article] [PubMed] [Google Scholar]
- 39. Zeisberg M, Kalluri R (2013) Cellular mechanisms of tissue fibrosis. 1. Common and organ‐specific mechanisms associated with tissue fibrosis. Am J Physiol Cell Physiol 304: C216–C225 [DOI] [PMC free article] [PubMed] [Google Scholar]
- 40. Li Y, Jiang D, Liang J, Meltzer EB, Gray A, Miura R, Wogensen L, Yamaguchi Y, Noble PW (2011b) Severe lung fibrosis requires an invasive fibroblast phenotype regulated by hyaluronan and CD44. J Exp Med 208: 1459–1471 [DOI] [PMC free article] [PubMed] [Google Scholar]
- 41. Verrecchia F, Mauviel A (2007) Transforming growth factor‐beta and fibrosis. World J Gastroenterol 13: 3056–3062 [DOI] [PMC free article] [PubMed] [Google Scholar]
- 42. Aroeira LS, Aguilera A, Selgas R, Ramirez‐Huesca M, Perez‐Lozano ML, Cirugeda A, Bajo MA, del Peso G, Sanchez‐Tomero JA, Jimenez‐Heffernan JA et al (2005) Mesenchymal conversion of mesothelial cells as a mechanism responsible for high solute transport rate in peritoneal dialysis: role of vascular endothelial growth factor. Am J Kidney Dis 46: 938–948 [DOI] [PubMed] [Google Scholar]
- 43. Jimenez‐Heffernan JA, Aguilera A, Aroeira LS, Lara‐Pezzi E, Bajo MA, del Peso G, Ramirez M, Gamallo C, Sanchez‐Tomero JA, Alvarez V et al (2004) Immunohistochemical characterization of fibroblast subpopulations in normal peritoneal tissue and in peritoneal dialysis‐induced fibrosis. Virchows Arch 444: 247–256 [DOI] [PubMed] [Google Scholar]
- 44. Margetts PJ, Kolb M, Galt T, Hoff CM, Shockley TR, Gauldie J (2001) Gene transfer of transforming growth factor‐beta1 to the rat peritoneum: effects on membrane function. J Am Soc Nephrol 12: 2029–2039 [DOI] [PubMed] [Google Scholar]
- 45. Kinnula VL, Fattman CL, Tan RJ, Oury TD (2005) Oxidative stress in pulmonary fibrosis: a possible role for redox modulatory therapy. Am J Respir Crit Care Med 172: 417–422 [DOI] [PMC free article] [PubMed] [Google Scholar]
- 46. Davis BN, Hilyard AC, Lagna G, Hata A (2008) SMAD proteins control DROSHA‐mediated microRNA maturation. Nature 454: 56–61 [DOI] [PMC free article] [PubMed] [Google Scholar]
- 47. Davis BN, Hilyard AC, Nguyen PH, Lagna G, Hata A (2010) Smad proteins bind a conserved RNA sequence to promote microRNA maturation by Drosha. Mol Cell 39: 373–384 [DOI] [PMC free article] [PubMed] [Google Scholar]
- 48. Altschul SF, Gish W, Miller W, Myers EW, Lipman DJ (1990) Basic local alignment search tool. J Mol Biol 215: 403–410 [DOI] [PubMed] [Google Scholar]
- 49. Massague J, Seoane J, Wotton D (2005) Smad transcription factors. Genes Dev 19: 2783–2810 [DOI] [PubMed] [Google Scholar]
- 50. Cushing L, Kuang PP, Qian J, Shao F, Wu J, Little F, Thannickal VJ, Cardoso WV, Lu J (2011) miR‐29 is a major regulator of genes associated with pulmonary fibrosis. Am J Respir Cell Mol Biol 45: 287–294 [DOI] [PMC free article] [PubMed] [Google Scholar]
- 51. Pandit KV, Corcoran D, Yousef H, Yarlagadda M, Tzouvelekis A, Gibson KF, Konishi K, Yousem SA, Singh M, Handley D et al (2010) Inhibition and role of let‐7d in idiopathic pulmonary fibrosis. Am J Respir Crit Care Med 182: 220–229 [DOI] [PMC free article] [PubMed] [Google Scholar]
- 52. Fattman CL (2008) Apoptosis in pulmonary fibrosis: too much or not enough? Antioxid Redox Signal 10: 379–385 [DOI] [PubMed] [Google Scholar]
- 53. Shi Y, Massague J (2003) Mechanisms of TGF‐beta signaling from cell membrane to the nucleus. Cell 113: 685–700 [DOI] [PubMed] [Google Scholar]
- 54. Hecker L, Logsdon NJ, Kurundkar D, Kurundkar A, Bernard K, Hock T, Meldrum E, Sanders YY, Thannickal VJ (2014) Reversal of persistent fibrosis in aging by targeting Nox4‐Nrf2 redox imbalance. Sci Transl Med 6: 231ra247 [DOI] [PMC free article] [PubMed] [Google Scholar]
- 55. Henderson NC, Arnold TD, Katamura Y, Giacomini MM, Rodriguez JD, McCarty JH, Pellicoro A, Raschperger E, Betsholtz C, Ruminski PG et al (2013) Targeting of alphav integrin identifies a core molecular pathway that regulates fibrosis in several organs. Nat Med 19: 1617–1624 [DOI] [PMC free article] [PubMed] [Google Scholar]
- 56. Henderson NC, Sheppard D (2013) Integrin‐mediated regulation of TGFbeta in fibrosis. Biochim Biophys Acta 1832: 891–896 [DOI] [PMC free article] [PubMed] [Google Scholar]
- 57. Peng R, Sridhar S, Tyagi G, Phillips JE, Garrido R, Harris P, Burns L, Renteria L, Woods J, Chen L et al (2013) Bleomycin induces molecular changes directly relevant to idiopathic pulmonary fibrosis: a model for “active” disease. PLoS ONE 8: e59348 [DOI] [PMC free article] [PubMed] [Google Scholar]
- 58. Konigshoff M, Kramer M, Balsara N, Wilhelm J, Amarie OV, Jahn A, Rose F, Fink L, Seeger W, Schaefer L et al (2009) WNT1‐inducible signaling protein‐1 mediates pulmonary fibrosis in mice and is upregulated in humans with idiopathic pulmonary fibrosis. J Clin Invest 119: 772–787 [DOI] [PMC free article] [PubMed] [Google Scholar]
- 59. Kim DH, Saetrom P, Snove O Jr, Rossi JJ (2008) MicroRNA‐directed transcriptional gene silencing in mammalian cells. Proc Natl Acad Sci USA 105: 16230–16235 [DOI] [PMC free article] [PubMed] [Google Scholar]
- 60. Younger ST, Corey DR (2011) Transcriptional gene silencing in mammalian cells by miRNA mimics that target gene promoters. Nucleic Acids Res 39: 5682–5691 [DOI] [PMC free article] [PubMed] [Google Scholar]
- 61. Piriyapongsa J, Bootchai C, Ngamphiw C, Tongsima S (2012) microPIR: an integrated database of microRNA target sites within human promoter sequences. PLoS ONE 7: e33888 [DOI] [PMC free article] [PubMed] [Google Scholar]
- 62. Mubarak KK, Montes‐Worboys A, Regev D, Nasreen N, Mohammed KA, Faruqi I, Hensel E, Baz MA, Akindipe OA, Fernandez‐Bussy S et al (2012) Parenchymal trafficking of pleural mesothelial cells in idiopathic pulmonary fibrosis. Eur Respir J 39: 133–140 [DOI] [PubMed] [Google Scholar]
- 63. Nasreen N, Mohammed KA, Mubarak KK, Baz MA, Akindipe OA, Fernandez‐Bussy S, Antony VB (2009) Pleural mesothelial cell transformation into myofibroblasts and haptotactic migration in response to TGF‐beta1 in vitro . Am J Physiol Lung Cell Mol Physiol 297: L115–L124 [DOI] [PMC free article] [PubMed] [Google Scholar]
- 64. Chen X, Liang H, Zhang J, Zen K, Zhang CY (2012) Secreted microRNAs: a new form of intercellular communication. Trends Cell Biol 22: 125–132 [DOI] [PubMed] [Google Scholar]
- 65. Cortez MA, Bueso‐Ramos C, Ferdin J, Lopez‐Berestein G, Sood AK, Calin GA (2011) MicroRNAs in body fluids–the mix of hormones and biomarkers. Nat Rev Clin Oncol 8: 467–477 [DOI] [PMC free article] [PubMed] [Google Scholar]
- 66. Creemers EE, Tijsen AJ, Pinto YM (2012) Circulating microRNAs: novel biomarkers and extracellular communicators in cardiovascular disease? Circ Res 110: 483–495 [DOI] [PubMed] [Google Scholar]
- 67. Tijsen AJ, Pinto YM, Creemers EE (2012) Circulating microRNAs as diagnostic biomarkers for cardiovascular diseases. Am J Physiol Heart Circ Physiol 303: H1085–H1095 [DOI] [PubMed] [Google Scholar]
- 68. Zhuang G, Wu X, Jiang Z, Kasman I, Yao J, Guan Y, Oeh J, Modrusan Z, Bais C, Sampath D et al (2012) Tumour‐secreted miR‐9 promotes endothelial cell migration and angiogenesis by activating the JAK‐STAT pathway. EMBO J 31: 3513–3523 [DOI] [PMC free article] [PubMed] [Google Scholar]
- 69. Lopez‐Cabrera M, Aguilera A, Aroeira LS, Ramirez‐Huesca M, Perez‐Lozano ML, Jimenez‐Heffernan JA, Bajo MA, del Peso G, Sanchez‐Tomero JA, Selgas R (2006) Ex vivo analysis of dialysis effluent‐derived mesothelial cells as an approach to unveiling the mechanism of peritoneal membrane failure. Perit Dial Int 26: 26–34 [PubMed] [Google Scholar]
- 70. Strippoli R, Benedicto I, Foronda M, Perez‐Lozano ML, Sanchez‐Perales S, Lopez‐Cabrera M, Del Pozo MA (2010) p38 maintains E‐cadherin expression by modulating TAK1‐NF‐kappa B during epithelial‐to‐mesenchymal transition. J Cell Sci 123: 4321–4331 [DOI] [PubMed] [Google Scholar]
- 71. Perez‐Lozano ML, Sandoval P, Rynne‐Vidal A, Aguilera A, Jimenez‐Heffernan JA, Albar‐Vizcaino P, Majano PL, Sanchez‐Tomero JA, Selgas R, Lopez‐Cabrera M (2013) Functional relevance of the switch of VEGF receptors/co‐receptors during peritoneal dialysis‐induced mesothelial to mesenchymal transition. PLoS ONE 8: e60776 [DOI] [PMC free article] [PubMed] [Google Scholar]
- 72. Sandoval P, Loureiro J, Gonzalez‐Mateo G, Perez‐Lozano ML, Maldonado‐Rodriguez A, Sanchez‐Tomero JA, Mendoza L, Santamaria B, Ortiz A, Ruiz‐Ortega M et al (2010) PPAR‐gamma agonist rosiglitazone protects peritoneal membrane from dialysis fluid‐induced damage. Lab Invest 90: 1517–1532 [DOI] [PubMed] [Google Scholar]
- 73. Vandesompele J, De Preter K, Pattyn F, Poppe B, Van Roy N, De Paepe A, Speleman F (2002) Accurate normalization of real‐time quantitative RT‐PCR data by geometric averaging of multiple internal control genes. Genome Biol 3: RESEARCH0034 [DOI] [PMC free article] [PubMed] [Google Scholar]
- 74. Andersen CL, Jensen JL, Orntoft TF (2004) Normalization of real‐time quantitative reverse transcription‐PCR data: a model‐based variance estimation approach to identify genes suited for normalization, applied to bladder and colon cancer data sets. Cancer Res 64: 5245–5250 [DOI] [PubMed] [Google Scholar]
- 75. Livak KJ, Schmittgen TD (2001) Analysis of relative gene expression data using real‐time quantitative PCR and the 2(‐Delta Delta C(T)) Method. Methods 25: 402–408 [DOI] [PubMed] [Google Scholar]
- 76. Smyth GK (2004) Linear models and empirical bayes methods for assessing differential expression in microarray experiments. Stat Appl Genet Mol Biol 3: Article 3 [DOI] [PubMed] [Google Scholar]
- 77. Hochberg YBAY (1995) Controlling the false discovery rate: a practical and powerful approach to multiple testing. J Roy Stat Soc 57: 12 [Google Scholar]
- 78. Dennis G Jr, Sherman BT, Hosack DA, Yang J, Gao W, Lane HC, Lempicki RA (2003) DAVID: database for annotation, visualization, and integrated discovery. Genome Biol 4: P3 [PubMed] [Google Scholar]
- 79. Rodriguez‐Pascual F, Redondo‐Horcajo M, Lamas S (2003) Functional cooperation between Smad proteins and activator protein‐1 regulates transforming growth factor‐beta‐mediated induction of endothelin‐1 expression. Circ Res 92: 1288–1295 [DOI] [PubMed] [Google Scholar]
- 80. Ding B, Kilpatrick DL (2013) Lentiviral vector production, titration, and transduction of primary neurons. Methods Mol Biol 1018: 119–131 [DOI] [PubMed] [Google Scholar]
Associated Data
This section collects any data citations, data availability statements, or supplementary materials included in this article.
Supplementary Materials
Appendix
Expanded View Figures PDF
Table EV1
Table EV2
Table EV3
Table EV4
Table EV5
Table EV6
Review Process File
Source Data for Figure 3B


