

SUMMARY
Most cell surface receptors for cytokines and growth factors signal as dimers, but it is unclear if remodeling receptor dimer topology is a viable strategy to ‘tune’ signaling output. We utilized diabodies (DA) as surrogate ligands in a prototypical dimeric receptor-ligand system, the cytokine Erythropoietin and its receptor (EpoR), to dimerize EpoR ectodomains in non-native architectures. Diabody-induced signaling amplitude varied from full to minimal agonism, and structures of the DA/EpoR complexes differed in EpoR dimer orientation and proximity. Diabodies also elicited biased, or differential activation of signaling pathways and gene expression profiles compared to EPO. Non-signaling diabodies inhibited proliferation of erythroid precursors from patients with a myeloproliferative neoplasm due to a constitutively active JAK2V617F mutation. Thus, intracellular oncogenic mutations causing ligand-independent receptor activation can be counteracted by extracellular ligands that re-orient receptors into inactive dimer topologies. This approach has broad applications for tuning signaling output for many dimeric receptor systems.
eTOC Blurb
Synthetic ligands called diabodies can change the amplitude and nature of signal activation, or counteract oncogenic ligand-independent intracellular signaling, by reorienting the geometry of receptor dimerization.
INTRODUCTION
Receptor dimerization is a universal mechanism to initiate signal transduction, and is utilized by many growth factors such as cytokines, and ligands for tyrosine kinase receptors (RTK), among others (Klemm et al., 1998; Stroud and Wells, 2004; Ullrich and Schlessinger, 1990; Wang et al., 2009; Wells and de Vos, 1993). Cytokines are a large class of secreted glycoproteins that contribute to regulating the fate and function of most cell types (Bazan, 1990; Liao et al., 2011; Wang et al., 2009). Cytokines bind to the extracellular domains (ECD) of their cell surface receptors, forming signaling complexes with receptor homo- or hetero-dimers. In some cases these receptors are pre-associated on the cell surface in an inactive state, and the role of cytokines is to re-orient the receptor dimers into an active state (Brooks et al., 2014; Constantinescu et al., 2001; Gent et al., 2002; Livnah et al., 1999). Cytokines such as Erythropoietin (EPO) and Growth Hormone (GH) homodimerize their receptors (Constantinescu et al., 1999; Wells and de Vos, 1993), while other cytokines, such as Interleukin-2, heterodimerize a shared receptor (common gamma chain) with a cytokine-specific subunit to initiate signaling (Liao et al., 2011; Wang et al., 2009). Cytokine receptor dimerization principally results in activation of intracellular, non-covalently associated Janus Kinases (JAKs) which then activate the STAT pathway to modulate gene expression and ultimately determine cell fate (Ihle et al., 1995; O’Shea and Paul, 2010).
Structures of cytokine-receptor extracellular domain (ECD) complexes from different systems have revealed a diverse range of molecular architectures and receptor dimer topologies that are compatible with signaling (Boulanger et al., 2003; de Vos et al., 1992; Hansen et al., 2008; LaPorte et al., 2008; Livnah et al., 1996; Ring et al., 2012; Syed et al., 1998; Thomas et al., 2011; Walter et al., 1995; Wang et al., 2005). This topological diversity is also apparent for dimeric RTK ECD complexes with their agonist ligands (Kavran et al., 2014; Lemmon and Schlessinger, 2010). Furthermore, monoclonal antibodies, as well as other engineered agents that dimerize receptor extracellular domains, including those of dimeric RTKs, can have disparate impacts on signaling, but the topological relationships of these non-native dimers to those induced by the endogenous ligands are unknown (Boersma et al., 2011; Jost et al., 2013; Li et al., 2013; Muller-Newen et al., 2000; Nakano et al., 2009; Zhang et al., 2012; Zhang et al., 2013). Prior studies have shown that cytokine receptor signaling efficiency can be influenced by extracellular domain mutations or structural perturbations (Barclay et al., 2010; Liu et al., 2009; Millot et al., 2004; Rowlinson et al., 2008;Seubert et al., 2003; Staerk et al., 2011). However, the apparent permissiveness in dimer architecture compatible with signaling raises the question: to what degree can modulation of receptor-ligand geometries fine-tune receptor activation? (Ballinger and Wells, 1998; Wilson and Jolliffe, 1999). A direct structural correlation of a single receptor-ligand complex in different dimerization topologies to differential signaling output would be highly informative in addressing this question.
On one hand, prior studies showing that cytokine-induced intracellular signaling could be activated through chimeric receptors containing alternative ECD’s demonstrated that dimerization geometries compatible with signaling were permissive to some degree (Heller et al., 2012; Ohashi et al., 1994; Pattyn et al., 1999; Socolovsky et al., 1998). On the other hand, a series of studies comparing activation of EpoR by its natural ligand EPO versus synthetic peptides concluded that very small changes in dimer orientation could modulate signal strength (Livnah et al., 1998; Livnah et al., 1996; Syed et al., 1998). However these studies left open the question of whether the observed signaling efficiency differences were due to alternative dimer topologies or simply reflected ligand affinity. In one example, it was reported that an EPO agonist peptide (EMP-1) could be converted into a non-activating, or ‘antagonist’ peptide (EMP-33) simply through a chemical modification (Bromination) of the EMP-1 peptide. Crystal structures of both peptide ligands bound to the extracellular domains of EpoR revealed dimeric complexes (Livnah et al., 1998; Livnah et al., 1996), however it was noted that the non-signaling EMP-33/EpoR ectodomain dimer angle differed by an approximate 15° rotation versus the agonist EMP-1/EpoR dimeric complex ((Livnah et al., 1998) and Fig. S1A). The lack of signal initiation by the EMP-33 peptide was attributed to this small change in the EpoR ECD dimer angle.
RESULTS
EPO receptor dimerization and signal activation induced by EMP peptides
Given the diverse range of dimer topologies evident in agonistic cytokine-receptor complexes (Wang et al., 2009), that in many cases exceed 15° angular differences, we revisited the striking observation seen with the EPO peptide ligands. We explored the biological activity of these peptides using EpoR reporter cells we developed that gave us the ability to test EpoR signaling by receptor phosphorylation, but importantly, also using a beta-galactosidase complementation system that is a sensitive reporter of EPO-induced EpoR oligomerization in physiologic conditions at 37 °C, which directly informs on early signaling and internalization (Wehrman et al., 2007). First, we synthesized the EMP-1 and EMP-33 peptides and found that EMP-1 binds EpoR with a KD of 1μM, while EMP-33 binds EpoR with a KD of more than 50 μM (Fig. S1B and S1C). The low affinity of EMP-33 prompted us to ask whether its lack of receptor activation is due to low occupancy of the receptor on the cell. We measured the actions of both peptides at inducing signaling and receptor dimerization on cells at a wide range of concentrations. At 10 μM of peptide, only EMP-1 induced dimerization and phosphorylation of EpoR at levels comparable to those achieved by EPO stimulation (Fig. 1A and 1B). At higher concentrations of peptide (100 μM), approaching that used for co-crystallization of both the agonistic and non-signaling dimeric EpoR/peptide complexes, EMP-33 induced a similar degree of receptor dimerization and phosphorylation of EpoR as EMP-1 and EPO itself (Fig. 1A and 1B). Thus, when EMP-33 is applied at concentrations that dimerize EpoR on cells, the dimer geometry of the EMP-33/EpoR complex is competent to initiate signaling. The different signaling potencies exhibited by the EPO mimetic peptides appears to be primarily due to their relative EpoR binding affinities.
Fig. 1. EpoR dimerization and signaling potencies induced by EMPs and diabodies.
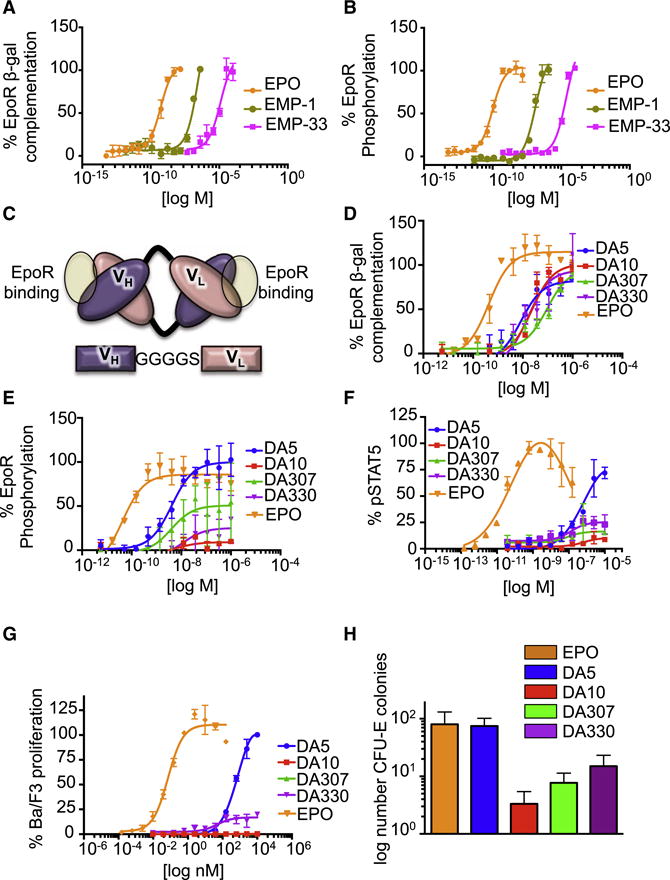
(A,B) Levels of EpoR dimerization (A) and phosphorylation (B) promoted by EMPs at the indicated doses. Data (mean +/− SD) are from four independent replicates (C) Schematic view of a bivalent diabody molecule. VH is connected to the VL domain by a short Gly-linker. EpoR binding sites in the diabody are highlighted with a yellow circle. (D,E) Levels of EpoR dimerization (D) and phosphorylation (E) promoted by diabodies at the indicated doses. Data (mean +/− SD) are from four independent replicates (F) Percentage of pSTAT5 activation induced by the indicated doses of EPO or the four diabodies in Ba/F3 EpoR cells. Data (mean +/− SD) are from two independent experiments. (G) Ba/F3 proliferation in response to EPO or the four diabodies. Data (mean +/− SD) are from two independent replicates (H) Number of CFU-E colonies derived from mouse bone marrow induced by EPO and the four diabodies. Data (mean +/− SD) are from three different experiments. See also Figure S1, Figure S2 and Figure S3.
EpoR Diabodies induce different degrees of agonism activity
We turned our attention to developing surrogate cytokine ligands that could induce much larger topological differences in the EpoR dimer and enable a systematic study relating dimer architecture to signaling and function. We reasoned that diabodies, which are essentially ‘back-to-back’ antibody VH/VL Fv’s could dimerize and possibly induce signaling of the EpoR, albeit at significantly larger inter-dimer distances than induced by EPO. Additionally, diabodies might be rigid enough to allow crystallization of their complexes with EpoR so that we can directly visualize the dimeric topologies. By comparison, whole antibodies have been shown to activate cytokine receptor signaling in many systems, presumably by dimerization (Muller-Newen et al., 2000; Zhang et al., 2012; Zhang et al., 2013). However, the flexibility of intact antibodies has precluded a structural analysis of intact dimeric agonist complexes that can be related to the biological activities.
We synthesized genes of four previously reported anti-EpoR antibodies (Lim et al., 2010), and reformatted their VH and VL domains into diabodies (Fig. 1C). The four diabodies bound EpoR with approximately similar affinities (Fig. S2) and multimerized EpoR with similar efficiency (as measured by EC50), albeit less efficiently than EPO (Fig. 1D). However, they induced EpoR phosphorylation with very different relative efficacies, ranging from full agonism (DA5) to very weak partial agonism (DA10) (Fig. 1E). The four diabodies also exhibited different extents of STAT5 phosphorylation (Fig. 1F), STAT5 transcriptional activity (Fig S3A), Ba/F3 cell proliferation (Fig. 1G) and CFU (Colony forming unit)-E colony formation (Fig. 1H). These dramatic differences in diabody-induced signaling and functional activities persist at saturating ligand concentrations, so are not attributable to significantly different relative affinities for EpoR, or to a stronger EpoR internalization induced by the weak agonist diabodies (DA10, DA307 and DA330), since the internalization closely correlated with their signaling efficacies (Fig. S3B).
EpoR Diabodies induce differential signal activation
STAT5 is the most prominent STAT protein activated by EPO (Constantinescu et al., 1999). However additional signaling pathways, including other STATs (STAT1 and STAT3), the MAPK pathway and the PI3K pathway, are also activated by this cytokine and fine-tune its responses (Constantinescu et al., 1999). “Biased” signal activation is a phenomenon that has been described for G-protein coupled receptor ligands, where one GPCR can differentially activate signaling pathways (e.g. beta-arrestin versus G-protein) depending on the ligand (Drake et al., 2008). Thus, we asked whether similar differential signal activation could be observed in a dimeric single-pass transmembrane receptor such as the EPO-EpoR system. We studied the activation of 78 different signaling molecules (Table S1) by phospho-Flow cytometry in the EPO-responsive cell line UT7-EpoR. EPO and the diabodies induced the activation of 33 signaling proteins, including members of the STAT family (STAT1, STAT3 and STAT5), MAP kinase family (MEK, p38) and PI3K family (Akt, RSK1, RPS6) (Fig. 2A). We also observed the upregulation of known EPO-induced transcription factors such as Myc, cFos, IRF1 and Elk (Fig. 2A). In agreement with our previous results, the signaling potencies exhibited by the three diabodies ranged from full agonism for DA5, to partial agonism for DA330 and non-agonism for DA10 (Fig. 2A). Interestingly, the diabodies did not activate all 33 signaling molecules to the same extent (Fig. 2B). When the signal activation levels induced by the three diabodies after 15 min stimulation were normalized to those induced by EPO we observed that, while EPO and DA5 induced similar levels of activation in the majority of the signaling pathways analyzed, DA5 activated some of them to a lower extent than EPO (Fig. 2B). Among those, STAT1 and STAT3 activation were the most affected, with DA5 inducing 30 % of the STAT1 and 40 % of the STAT3 activation levels induced by EPO (Fig. 2B). Interestingly, STAT3 S727 phosphorylation, which requires MAPK activation (Decker and Kovarik, 2000), was equally induced by EPO and DA5, consistent with the two ligands activating the MAPK pathway to the same extent (Fig. 2A and 2B). Dose/response studies in UT7-EpoR cells confirmed these observations and showed that DA5 activates STAT1 to a much lower extent than EPO, while still promoting comparable levels of STAT5 activation (Fig. 2C), confirming that biased signaling can be induced through the dimeric EpoR with surrogate ligands.
Fig. 2. “Biased” signaling activation induced by the diabodies.
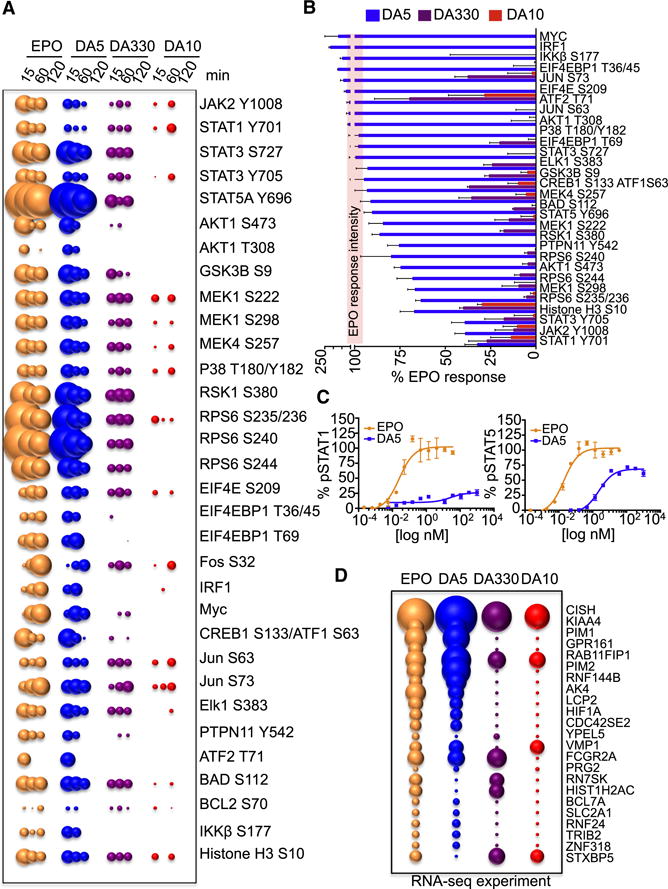
(A) Bubble plot representation of the signaling pathways activated by EPO and the three diabodies at the indicated times in UT-7-EpoR cells. The size of the bubble represents the intensity of the signal activated. (B) The levels of signal activation induced by the three diabodies at 15 min of stimulation were normalized to those induced by EPO and order based on signaling potency. The red line represents the EPO signaling activation potency normalized to 100 %. Data (mean +/− SD) are from three independent replicates. (C) pSTAT1 and pSTAT5 dose-response experiments performed in UT-7-EpoR cells stimulated with EPO or DA5 for 15 min. Data (mean +/− SD) are from two independent replicates. (D) Bubble plot representation of genes induced by EPO and the three diabodies after stimulation of MEP cells for two hours. The size of the bubble represents the fold of gene induction. See also Figure S3 and Table S1.
Next we studied how different signal activation amplitudes exhibited by the diabodies at the membrane-proximal level would impact their membrane-distal gene expression programs. We carried out RNA-seq studies of EPO-responsive genes in purified human primary megakaryocyte-erythroid progenitor (MEP) cells derived from bone marrow of a normal subject (Fig. 2D). Temporally, MEPs are the first progenitors to robustly express EpoR during hematopoiesis in humans (Seita et al., 2012). In agreement with the signaling data, the relative gene-induction potencies exhibited by the diabodies matched their signaling efficacies (i.e. DA5>DA330>DA10) (Fig. 2D). DA5 induced a very similar gene induction profile to EPO, but with some differences, with a small subset of genes (e.g. Pim2 and RN7SK) being differentially regulated by DA5 when compared to EPO.
The different EPO-responsive gene induction potencies induced by the diabodies were further confirmed by qPCR experiments in the EPO-responsive cell line UT7-EpoR. UT-7-EpoR cells were stimulated with saturating doses of EPO or the three diabodies for 2, 4 and 8 hr and the levels of CISH and Pim1 gene expression were studied (Fig. S3C). Here again DA5 stimulation led to similar levels of CISH and Pim1 induction as EPO; DA330 resulted in only 30–40% induction of these genes and DA10 only marginally induced CISH and Pim1 in these cells (Fig. S3C). When compared to the RNA-seq experiment performed in MEP cells, DA10 induced lower level of CISH and Pim1 expression in UT7-EpoR cells. These differences likely result from the use of different cell types in the two assays. Overall our signaling and gene expression data show that the diabodies exhibit various degrees of differential signaling properties from EPO and from one another.
Alternative EpoR dimer orientation and proximity result in different degrees of agonism
To explore the structural basis for the differential signaling activation exhibited by the diabodies, we expressed and purified three diabody/EpoR complexes (DA5, DA10 and DA330) from baculovirus-infected insect cells. All exhibited molecular weights of 97–98 kDa as measured by Multi Angle Light Scattering (MALS) chromatography, in agreement with a 2:1 complex stoichiometry (two EpoR bound to one diabody (Fig. S4A)). We crystallized the diabody/EpoR complexes (DA5 (2.6 Å), DA10 (3.15 Å) and DA330 (2.85 Å)) and determined their structures by molecular replacement (Fig. 3 and Table S2). The diabody subunit relationships are clear for the most and least potent diabody complexes (DA5 and DA10, respectively). For the DA330/EpoR complex, the crystal appears to contain domain-swapped diabodies as “back-to-back,” single-chain Fv’s that pack in similar, but not identical subunit relationships as diabodies. The MALS data show that all of the diabodies are the expected 2:1 complexes in solution.
Fig. 3. Crystal structures of DA5, DA10 and DA330 in complex with EpoR.

(A) Overlay of the three diabody_EpoR complexes. EpoR binding to DA5 is colored green, EpoR binding to DA10 is colored red and EpoR binding to DA330 is colored purple. The DA330 crystal lattice appears to contain domain-swapped diabodies as scFv in similar but not identical subunit relationships. (B) Diabodies binding footprint on the EpoR surface. Amino acids on EpoR interacting with the diabodies are colored white. DA5 CDRs are colored green; DA10 CDRs are colored red and DA330 CDRs are colored purple. Vectors connecting the VH CDR1 and the VL CDR1 in the diabodies define the binding topology of the three diabodies_EpoR complexes. (C–D) Diabodies and EPO binding footprint on the EpoR surface. Hot-spot interaction on EpoR are colored lime and are shared by the diabodies and EPO. Diabodies use Y34, R98 (DA5), Y105 (DA10), Y32, R101 (DA330) to interact with the amino acids forming the two hot-spots on EpoR. EPO uses similar chemistry with F43 and K45 filling the two hot-spots pockets on EpoR. (E–H) Crystal structures of DA5 (E), DA10 (F), DA330 (G), and EPO (H) dimerizing two EpoR are shown in top (left) and side (right) views. In the side view representation, EpoR is depicted as surface. Yellow spheres represent the C-terminal region of the SD2 EpoR domain. See also Figure S4, Figure S5, Figure S6 and Table S2.
All three diabodies converge on the protruding “elbow” of EpoR that also serves as the EPO binding site (Fig. 3 and Fig. S4 and S5). When the diabody VH/VL modules are aligned, the EpoR’s ‘rotational’ binding topology is most similar between DA5 and DA330, with DA10 being markedly different (Fig. 3A). While DA5 and DA330 both bind horizontally and differ primarily in their vertical ‘tilt’ (~14°), DA10 is orthogonally disposed relative to the other two (Fig. 3B). In a striking example of chemical mimicry of EPO binding, the diabody CDR loops use two patches of basic (Arg98/Arg101 of DA5 and DA330, respectively) and hydrophobic (Tyr34/Tyr105/Tyr32 of DA5/DA10/DA330, respectively) residues in a nearly identical manner as residues presented on the EPO helices (Lys45, Phe48) in the EPO site I binding interface to engage the same regions of the EpoR binding site (Fig. 3C and 3D).
The overall architectures of the three diabody/EpoR complexes (Fig. 3E, 3F and 3G) are quite distinct from that of the EPO/EpoR complex, which dimerizes two molecules of EpoR in a classical Y-fork cytokine-receptor architecture, resulting in close proximity between the C-termini of the membrane-proximal EpoR ECD’s (Fig. 3H). In contrast, the diabodies impose much larger separation between the two EpoR molecules with distances ranging from approximately 127 Å in the case of the DA5/EpoR (full agonist) complex, to approximately148 Å as in the case of the DA10/EpoR complex (non-agonist) (Fig. 3E, 3F and 3G). The exact EpoR dimer separation is uncertain for the partial agonist DA330. Interestingly, the relative EpoR dimer distances observed in the full and non-agonist diabody/EpoR complexes correlate their signaling potencies in that the full agonist dimer is closer together, while the non-agonist is further. One caveat is that the diabody molecules themselves are not rigid, they exhibit some degree of flexibility in the hinge angle relating the two VH/VL modules, raising the question of whether we captured one of a range of dimer angles that could be enforced by crystal lattice contacts. We performed conformational sampling studies exploring the relationship between the EpoR separation distance as a function of the diabody hinge angle on the full agonist DA5 and the non-signaling DA10 (Fig. S6 and Video S1 and S2). The results of these studies show that the thermodynamically permitted variation in diabody hinge angles (appear to occupy a few energy minima) lead to only a small range of alternative conformations (i.e. distances) around that seen in the crystal structures (Fig. S6 and Video S1 and S2). The sampling of these alternative conformations has only minimal consequences on the inter-EpoR distances.
Since we observe differences in both the EpoR/diabody docking angles (Fig. 3A and 3B), and the distances between EpoR C-termini in the dimeric complexes, we cannot say whether distance or geometry/topology, or a combination of both factors, is responsible for the differences in signaling between the complexes. However, that the differences in signaling amplitude are due to alternative overall extracellular dimer topologies appears quite clear. Such large differences in extracellular architecture would likely influence the relative orientation and proximity of the two JAKs associated with the membrane proximal intracellular domains of the receptors, and impact their subsequent phosphorylation profiles (Fig. 5A).
Fig. 5. DA10 and DA330 inhibit JAK2V617F constitutive activity.
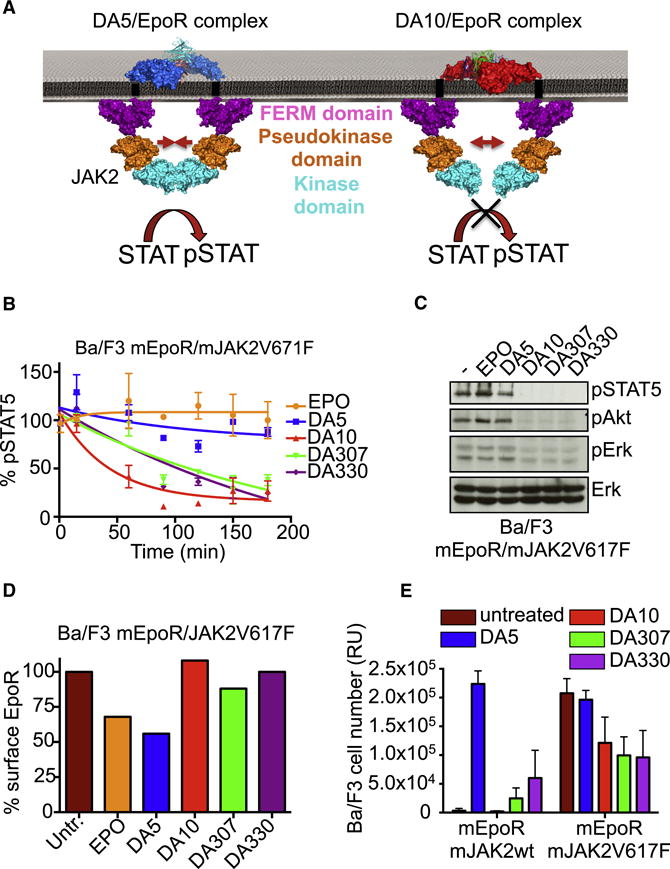
(A) Model depicting the mechanism by which the diabodies affect signaling activation potencies. The large dimer intersubunit distances exhibited by the diabodies may alter the position of JAK2 upon ligand binding, decreasing its ability to transactivate each other and start downstream signaling amplification. (B) Kinetics of pSTAT5 in Ba/F3 cells expressing the JAK2V617F mutant after stimulation with EPO or the four diabodies. DA10, DA307 and DA330 induce a decrease on the basal pSTAT5 levels in a time dependent manner. Data (mean +/− SD) are from two independent experiments. (C) pSTAT5, pErk and pAkt levels induced by 1 μM of the four diabodies in Ba/F3 cells expressing the JAK2V617F mutant after 3 hrs of stimulation. (D) EpoR surface levels after 1 hr stimulation with EPO or the four diabodies. (E) Proliferation of Ba/F3 cells expressing JAK2 wt or JAK2 V617F in response to 1 μM of each of the four diabodies after 5 days of stimulation. Data (mean +/− SD) are from three independent experiments.
Comparable spatiotemporal dynamics of EpoR assembly by EPO and diabodies
An important mechanistic question is whether the diabody/EpoR complexes on the cell surface are indeed homodimers or higher order species due to clustering of preformed EpoR dimers, which has been reported previously (Constantinescu et al., 2001b). To explore the ability of the diabodies to dimerize EpoR in the plasma membrane we probed the assembly and dynamics of signaling complexes by dual color single molecule imaging. For this purpose, EpoR fused to an N-terminal monomeric EGFP (mEGFP) was expressed in HeLa cells and labeled by addition of anti-GFP nanobodies (Rothbauer et al., 2008), which were site-specifically conjugated with DY647 and ATTO Rho11, respectively (Fig. 4A). We labeled the receptors extracellularly so as not to introduce fusion proteins to the intracellular regions that may result in artefactual dimerization behavior. Efficient dual color labeling suitable for long-term observation of individual EpoR was achieved with typical densities of ~0.3 molecules/μm2 in both channels, which was exploited for co-localization and co-tracking analysis. In the absence of an agonist, independent diffusion of EpoR molecules could be observed (Video S3) with no significant single molecule co-localization beyond the statistical background (Fig. 4B). Single molecule co-tracking analysis corroborated the absence of pre-dimerized EpoR at the plasma membrane (Fig. 4C,D). Upon addition of EPO, dimerization of EpoR was detectable by both, co-localization and co-tracking analysis (Video S3, Fig. 4B–D). Individual receptor dimers could be tracked (Video S3) and a clear decrease in their mobility compared to EpoR in absence of ligand was identified (Fig. 4E). Stimulation of EpoR endocytosis in presence of EPO was observed, which was accompanied by an increased fraction of immobile EpoR molecules in presence of EPO. The stoichiometry within individual complexes was analyzed by photobleaching at elevated laser power. Single step photobleaching confirmed the formation of EpoR dimers in the plasma membrane (Video S4, Fig. 4F). Upon labeling the mEGFP-EpoR only with ATTO-Rho11, two-step bleaching could be observed only in presence of EPO (Video S5). For all diabodies, very similar levels of receptor dimerization were obtained (Video S3, Fig. 4D). A slightly increased dimerization level compared to EPO was observed, which may be due to the symmetric binding affinities of diabodies to both EpoR subunits compared to the asymmetric receptor dimer assembly observed for EPO. Importantly, the diffusion properties of receptor dimers assembled by the diabodies were comparable as shown for DA5 in Fig. 4E, confirming a comparable mode of receptor dimerization by diabodies compared to EPO. Moreover, 1:1 receptor dimers recruited by the diabodies is observed by single step photobleaching (Fig. 4F). Thus, although we do not rule out any role of EpoR pre-association in the observed signaling effects, our microscopy data indicates that the diabodies are not simply clustering quiescent EpoR dimers into higher order assemblies.
Fig. 4. Diabodies dimerize EpoR in the surface of living cells.
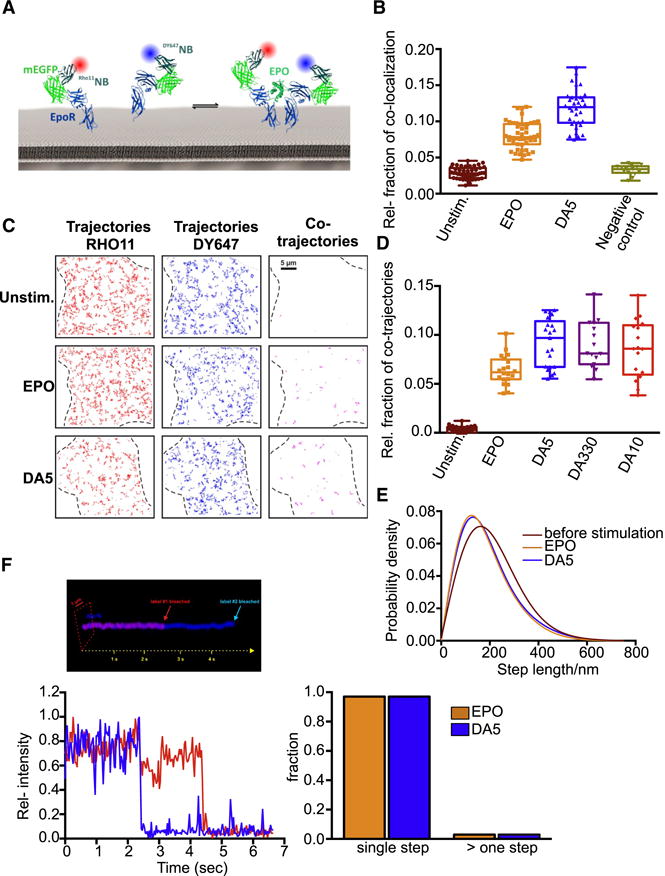
(A) Cell surface labeling of EpoR using dye-labeled anti-GFP nanobodies. (B) Relative co-localization of RHO11EpoR and DY647EpoR in absence and presence of ligand. As a negative control, co-localization of maltose binding protein fused to an indifferent transmembrane domain is shown. (C) Trajectories (150 frames, ~4.8 s) of individual Rho11-labeled (red) and DY647-labeled EpoR (blue) and co-trajectories (magenta) for unstimulated cells as well as after stimulation with EPO (5 nM) and DA5 (250 nM). (D) Relative amount of co-trajectories for unstimulated EPOR and after stimulation with EPO and diabodies (DA5, DA330, DA10). (E) Diffusion properties of EpoR represented as trajectory step-length distribution for unstimulated cells and after dimerization with EPO or DA5. The curves correspond to fitted data from >10 cells (~1500 trajectories each). (F) Diabody-induced dimerization of EpoR demonstrated by dual-step bleaching analysis. Upper panel: A pseudo-3D kymograph illustrating dual-color single-step bleaching for an individual DA5-induced EpoR co-trajectory. Bottom left panel: The corresponding pixel-intensity profiles are shown for both acquisition channels. Bottom right panel: The fraction of signals within co-trajectories that decay within a single step vs. multiple steps. Comparison for complexes obtained with EPO (from 154 co-trajectories) and DA5 (from 186 co-trajectories).
EpoR Diabodies inhibit erythroid colony formation in JAK2V617F-positive patients
Several mutations in JAKs are known to cause immune disorders and cancer by rendering activation ligand-independent (Gabler et al., 2013; James et al., 2005). We asked whether the large EpoR distances and different binding geometries induced by the diabodies could modulate the activity of these kinase mutants in an extracellular ligand-dependent manner by separating the two JAKs at distances where they could not undergo transactivation. The JAK2V617F mutant is the best-described example of an oncogenic JAK mutation, causing the development of hematological disorders such as Polycythemia Vera (PV) and other myeloproliferative (MPN) neoplasms (Baxter et al., 2005; James et al., 2005; Kralovics et al., 2005; Levine et al., 2005). At physiologic expression levels, JAK2V617F-positive cells require EpoR to proliferate in a ligand-independent manner (Lu et al., 2008). Stimulation of Ba/F3 cells expressing the murine EpoR and the JAK2V617F mutant with EPO or DA5 did not significantly affect the basal phosphorylation of STAT5, Akt and Erk in these cells (Fig. 5B and 5C). However, stimulation of these cells with DA10, DA307 and DA330 decreased the STAT5, Akt and Erk phosphorylation in a time dependent manner (Fig. 5B and 5C). This decrease in signal activation induced by DA10, DA307 and DA330 was not the result of EpoR surface depletion. Only the full agonists, EPO and DA5, led to a significant decrease in the levels of EpoR on the surface (Fig. 5D). The decrease in the JAK2V617F-induced basal signaling activation promoted by the diabodies was followed by a reduction in the proliferation rate of Ba/F3 cells expressing the mutated JAK2 (Fig. 5E), suggesting that oncogenic JAK mutant activities can be modulated in an extracellular ligand-dependent manner.
The Ba/F3 cells used here are a transformed cell line engineered to overexpress EpoR and JAK2V617F, which led to transformation and to autonomous growth, so we also performed erythroid colony formation assays in primary cells from human JAK2V617F-positive patients. CD34+ hematopoietic stem cells and progenitors (HSPC) from heterozygous JAK2V617F-positive patients were isolated and stimulated with the indicated diabodies +/− EPO, and their ability to form erythroid colonies was assayed. In the absence of diabodies, JAK2V617F-positive CD34+ cells gave rise to erythroid colonies, which were further increased in numbers in the presence of EPO in the media (Fig. 6A). Stimulation with a non-specific negative control diabody did not significantly alter the number of erythroid (EpoR dependent) or myeloid colonies (EpoR independent) (Fig. 6A and 6B), ruling out possible toxic side effects induced by diabodies. Stimulation of JAK2V617F-positive CD34+ cells with the agonistic diabody, DA5, led to a specific increase in the number of erythroid colonies (Figs. 6A and 6C) without significantly altering the number of myeloid colonies (Fig. 6B). On the other hand, stimulation with DA330 and DA10 led to a potent and specific decrease in the number of erythroid colonies (Fig. 6A, 6B and 6C). We note that DA330, which is a partial agonist of normal JAK2 signaling, limits, but does not prevent signaling in JAK2V617F cells, giving the appearance of a structural ‘governor’ controlling signaling output. All the colonies analyzed in the study harbored the JAK2V617F mutation as determined by single colony genotyping (Fig. 6D). The diabody with the largest intersubunit distance, DA10, inhibited colony formation the strongest, comparably to the JAK1/2 inhibitor Ruxolitinib, which is approved and standard of care for JAK2V617F-positive MPN (Verstovsek et al., 2010) (Fig. 6A). DA10 also decreased the number of erythroid colonies from homozygous JAK2V617F-positive patients (Dupont et al., 2007) (Fig. 6E and 6F), suggesting that the binding topology imposed by this diabody dominates over the influence of the mutated JAK2 expressed in the cell. Overall these results show that extracellular ligands that enforce large receptor dimer separation and different binding geometries can counteract intracellular oncogenic ligand-independent receptor activation, presumably by exceeding the accessible distance that the JAK2 kinase domain can extend to transphosphorylate the opposing JAK2 and receptor (Fig. 5A).
Fig. 6. DA10 and DA330 inhibit erythroid colony formation in JAK2V617F-positive patients samples.
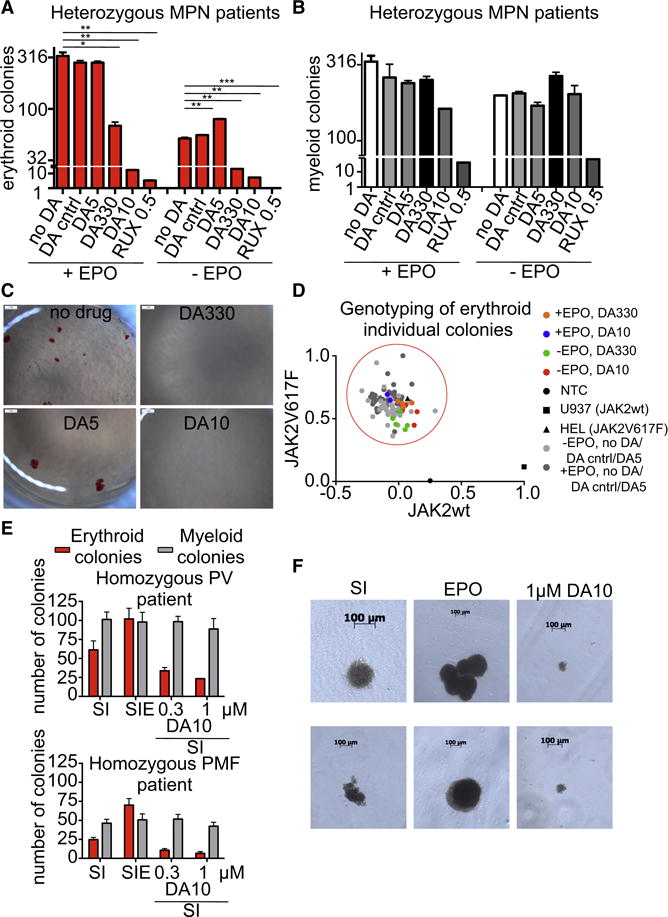
(A) Number of erythroid BFU-E (EPO-dependent) colonies in heterozygous JAK2V617F positive myeloproliferative neoplasm patient samples after stimulation with the indicated ligands. Data (mean +/− SD) are from three different donors. (B) Number of myeloid colonies in heterozygous JAK2V617F positive myeloproliferative neoplasm patient samples after stimulation with the indicated ligands. (C) Overview pictures highlight EPO-independent BFU-E colonies (no drug and DA5) which are significantly diminished with DA330 and DA10 treatment. *P < 0.05; **P < 0.01; ***P < 0.001; paired Student’s t-test was used to determine significant changes. (D) The genotype of 109 erythroid colonies derived from sorted CD34+ cells derived from PMF cases was determined by multiplexed custom TaqMan SNP assay for JAK2V617F and JAK2 wildtype. Each colony is represented by a single dot in the graph and colored according to different treatment regimens. Grey dots represent colonies derived from conditions without treatment or treatment with an agonist (dark grey with EPO, light grey without EPO), orange and green dots represent few residual colonies treated with DA330, and blue and red dots very rare residual colonies treated with DA10. (E) Number of erythroid colonies (Burst-forming units-erythroid (BFU) or endogenous erythroid colonies (EEC)) and myeloid colonies (EPO-independent) in a Polycythemia Vera (PV) (top panel) and primary Myelofibrosis (PMF) patient (bottom panel) homozygous for JAK2V617F. SI: SCF + IL-3; SIE: SCF +IL-3 + EPO. Data (mean +/− SD) are from three different donors. (F) Morphology of EEC colonies after treatment with the indicated conditions is shown.
DISCUSSION
Single-pass Type-I and Type-II transmembrane receptors that contain ligand-binding ECDs constitute a major percentage of all signaling receptors in the mammalian genome, and include cytokine (JAK/STAT) receptors (Spangler et al., 2014), Tyrosine Kinase (RTK) receptors (e.g. EGF-R, Insulin-R, etc) (Lemmon and Schlessinger, 2010), and many others. In most cases, these receptors signal in response to ligand engagement as homo- or heterodimers (Klemm et al., 1998). For G-protein coupled receptors, ligand binding within the TM helices induces conformational changes within the plane of the membrane, and this can be read out as differential signaling (e.g. biased signaling, inverse and partial agonism) (Venkatakrishnan et al., 2013). However, it has been unclear to what extent extracellular ligands can influence signaling through dimeric Type-I and Type-II receptors by enforcing ECD orientational differences. For this class of receptors, ligand binding ECDs are structurally autonomous, and separated from the intracellular signaling modules (e.g. Kinase domains) through juxtamembrane linkers and a TM helix. Thus, the intracellular domains presumably sense ligand mainly through ligand-induced spatial perturbations of receptor orientation and proximity that are relayed as conformational changes relayed through the membrane (Ottemann et al., 1999). We asked whether ligand-induced orientational changes of receptor dimer geometry could serve a functionally analogous role to the diverse types of conformational changes induced by GPCR ligands that result in differential signaling.
While there exists a vast literature showing that dimeric receptor signaling strength is determined by extracellular parameters such as ligand affinity and complex half-life on the cell surface, the role of orientation-specific effects has remained speculative (Ballinger and Wells, 1998; Syed et al., 1998; Wells and de Vos, 1993). Studies using mutated, chimeric or genetically modified receptors have pointed to the importance of the extracellular domain structure in mediating signaling output (Barclay et al., 2010; Liu et al., 2009; Millot et al., 2004; Rowlinson et al., 2008; Seubert et al., 2003; Staerk et al., 2011). Nevertheless, for this parameter to be exploited in a manner that could be useful therapeutically, surrogate ligands with the capacity to induce alternative signaling outputs through naturally, non-mutated receptors on human cells are required. We used diabodies because they would presumably induce large-scale alterations in dimer geometry, and have been previously shown to have the capacity to act as agonists of c-MPL (Nakano et al., 2009). Additionally, diabodies have more constrained structures than antibodies (Perisic et al., 1994), which can also act as agonists, but remain elusive structural targets due to their segmental flexibility.
Our results indicate that cytokine receptor dimer architectural and spacing constraints compatible with signaling appear liberal, but with limits. This is consistent with the diverse range of dimeric ligand-receptor geometries seen in agonistic cytokine-receptor complex structures (Spangler et al., 2014; Wang et al., 2009). Consequently, we find that large-scale re-orientations of receptor dimer topology with alternative ligands are required to qualitatively and quantitatively modulate signaling output. We propose that this strategy is potentially applicable to other dimeric receptor systems, such as RTK’s, where the role of ligand is to bind to the ECDs, dimerize and/or re-orient receptors.
The broader implications of our results are that signaling patterns delivered by endogenous ligands only constitute one, of many possible signaling patterns that can be elicited through a dimeric receptor system using ligands that re-orient dimer topology. By using surrogate or engineered ligands to re-orient receptor dimer topology, a given dimeric receptor can be induced to deliver a wide range of signals of different amplitudes and pathway specificities. Cytokine receptor dimers have the potential to be modulated as rheostats to control signaling output, similar to partial and biased GPCR agonists. Given that many endogenous cytokines and growth factors have adverse effects as therapeutic agonists, our results portend the possibility of dimer re-orientation as a strategy to ‘tune’ signaling output to minimize toxicity, maximize efficacy, or elicit specific functional outcomes.
The molecular mechanisms through which the diabodies described here alter intracellular signaling by remodeling dimer geometry remain unclear, but the signal tuning effects are clearly the result of extracellular receptor dimer proximity (distance) and geometry (orientation) effects. Our single molecule fluorescence tracking shows that the assembled signaling complexes are not due to higher order assemblies that could have resulted from diabody-induced clustering of preformed EpoR receptor dimers (Constantinescu et al., 2001). Even if receptor clustering were occurring to some degree, which we do not rule out, the diabodies still exert a powerful modulatory effect on signaling through repositioning receptor topology whether or not these are monovalent or polyvalent cell surface complexes. Indeed, our results can be reconciled with a recent mechanistic study of cytokine receptor activation (Brooks et al., 2014). Growth Hormone was shown to activate its receptor (GH-R) by rotating the ECD subunits of a pre-associated, but inactive GH-R dimer, resulting in separation of the Box 1 receptor ICD motifs and removal of the JAK2 pseudokinase inhibitory domain, which collectively result in productive JAK2 kinase domain positioning for receptor activation. Diabodies could presumably disrupt a quiescent cytokine receptor dimer to form an activated dimer topology through a related ‘separation’ mechanism that relieves JAK2 inhibition. For the agonist DA5, the outcome of this separation would be placement of the JAK kinase domains into productive apposition, but one that is topologically distinct from that induced by the natural cytokine. In the case of DA10, the kinase domains of JAK2 are separated such that they are not in proper position to trans-phosphorylate.
The surprisingly large EpoR dimer separation distances imposed by the agonistic diabodies may be rationalized by the fact that the intracellular, receptor-associated JAKs are long molecules that exists as a dynamic ensemble of open and closed conformations which could span >100Å distances between receptors in a dimer (Lupardus et al., 2011). Given that the kinase domain of JAK resides at its C-terminus, which is most distal to the receptor bound by the JAK FERM domain, it is likely sensitive to positioning relative to its substrates that it trans-phosphorylates. Changes in the relative positioning of the kinase domain to its substrates could influence the efficiency and patterns of phosphorylation through steric effects imposed by extracellular dimer geometry. By manipulating the dimer geometry, as seen with the non-signaling diabody DA10, such an approach can achieve complete shutoff of constitutively active signaling pathways (JAK2V617F) from the outside of the cell. This is conceptually distinct from Ankyrin repeat antagonists to ErbB2 that were shown to prevent activation of wild-type ErbB2 by distorting the receptors such that they cannot form signaling-competent dimers (Jost et al., 2013). Here, the role of DA10 is to dimerize EpoR, yet terminate ligand-independent signaling, possibly through enforcing a large dimer separation distance. This strategy is applicable to diseases mediated by mutated, constitutively active receptors (Bivona et al., 2011; Pikman et al., 2006; Rebouissou et al., 2009; Zenatti et al., 2011), and could offer the advantage of specificity and reduced toxicity versus broadly neutralizing kinase inhibitors.
Diabodies are a convenient surrogate ligand because they can be created from existing monoclonal antibody sequences, which exist to most human cell surface receptors. However, dimer re-orientation could conceivably be achieved by many different types of engineered scaffolds. A range of altered dimerization geometries could be screened with dimerizing scaffolds for those that induced a particular signaling profile. In principle, using the receptor ECD’s as accessible cell surface targets to induce alternative orientations of intracellular signaling motifs for many Type-I or Type-II cell surface receptors should be feasible.
EXPERIMENTAL PROCEDURES
Structure determination and refinement
All crystallographic data were collected at the Stanford Synchroton Radiation Lightsource (Stanford, CA, USA) beamlines 12–2. Data were indexed, integrated and scaled using XDS or HKL2000 program suits (Kabsh, 2010; Otwinowski et al., 1997). The three DA-EpoR crystal structures were solved by molecular replacement with the program PHASER (McCoy, 2007) and refined with PHENIX and COOT.
Primity Bio Pathway Phenotyping
UT-7-EpoR cells were starved overnight, stimulated with saturated concentrations of EPO and the indicated diabodies for 15, 60 and 120 min and fixed with 1% PFA for 10 min at room temp. The fixed cells were prepared for antibody staining according to standard protocols (Krutzik, 2003). Briefly, the fixed cells were permeabilized in 90% methanol for 15 minutes. The cells were stained with a panel of antibodies specific to the markers indicated (Primity Bio Pathway Phenotyping service and Table S1) and analyzed on an LSRII Flow cytometer (Becton Dickinson, San Jose, CA). The Log2 Ratio of the median fluorescence intensities (MFI) of the stimulated samples divided by the unstimulated control samples were calculated as a measure of response.
Single molecule tracking, co-localization and co-tracking analyses
Single molecule localization and single molecule tracking were carried out using the multiple-target tracing (MTT) algorithm (Serge et al., 2008) as described previously (You et al., 2010). Step-length histograms were obtained from single molecule trajectories and fitted by two fraction mixture model of Brownian diffusion. Average diffusion constants were determined from the slope (2–10 steps) of the mean square displacement vs. time lapse diagrams. Immobile molecules were identified by the density-based spatial clustering of applications with noise (DBSCAN) (Sander et al., 1998) algorithm as described recently (Roder et al., 2014). For comparing diffusion properties and for co-tracking analysis, immobile particles were excluded from the data set. Individual molecules detected in the both spectral channels were regarded as co-localized, if a particle was detected in both channels of a single frame within a distance threshold of 100 nm radius.
HSC and progenitor derived colony genotyping assay
CD34+ cells were sorted from human JAK2V617F homo- and heterozygous myeloproliferative samples. CD34+ cells were plated in methylcellulose with and without erythropoietin (MethoCult H4434 and H4535; STEMCELL Technologies). Colony formation was assessed after 14 days in culture by microscopy and scored on the basis of morphology. JAK2V617F and JAK2 WT TaqMan SNP Genotyping Assay (Applied Biosystems) were designed as published recently (Levine et al., Blood 2006) and details are available upon request. The genotype of each colony was determined by Custom TaqMan SNP Genotyping Assay (Applied Biopsystems) according to the manufacturer’s specification.
Extended Experimental Procedures
Further details for production, characterization and crystallization of diabodies; signaling and functional characterization; in vivo imaging of surface DA-EpoR complex formation; and isolation and treatment of JAK2V617F-positive human samples can be found online in the Extended Experimental Procedures.
Supplementary Material
Highlights.
Ligand-driven re-orientation of receptor dimer topology tune signaling.
Diabodies elicit differential signal activation.
Non-agonistic diabodies counteract intracellular oncogenic signaling.
Acknowledgments
We thank Kevin Jude for technical assistance, and the Division of Hematology Tissue Bank and the patients for donating their samples and Dr William Vainchenker, Institut Gustave Roussy for providing patient JAK2V617F homozygous CD34+ cells and Dr Christian Pecquet for support with cell lines. This work was supported by the BELSPO and de Duve Institute Delori postdoctoral fellowships (V.G.), T32CA009287-35 (Training Program un Investigative Oncology) and TG2-01159 (Stanford CIRM Training Program) (W.I.H.), (NIH) U01HL099999 (G.W., R.S. and I.L.W.), FRS-FNRS, Salus Sanguinis Foundation, Fondation contre le cancer, Belgium, Programs IAP-BeMGI and ARC (S.N.C.), the Howard Hughes Medical Institute (K.C.G.)
Footnotes
Publisher's Disclaimer: This is a PDF file of an unedited manuscript that has been accepted for publication. As a service to our customers we are providing this early version of the manuscript. The manuscript will undergo copyediting, typesetting, and review of the resulting proof before it is published in its final citable form. Please note that during the production process errors may be discovered which could affect the content, and all legal disclaimers that apply to the journal pertain.
AUTHOR CONTRIBUTIONS
I.M and K.C.G. conceived the project and wrote the manuscript. I.M, T.S.W., H.F., V.G., and P.K. functionally characterized the diabodies. S.W., C.P.R. and J.P. designed and performed single-particle microscopy experiments. V.G., S.N.C., I.P., G.W., W.J.H., R.M., I.L.W. designed and performed experiments in human JAK2V617F-positive patients. G.W., R.S. performed RNA-seq libraries and analysis. I.M, F.G expressed recombinant proteins and performed crystallization experiments of DA-EpoR complexes. S.D. and P.M designed and performed molecular dynamics experiments.
References
- Ballinger MD, Wells JA. Will any dimer do? Nat Struct Biol. 1998;5:938–940. doi: 10.1038/2911. [DOI] [PubMed] [Google Scholar]
- Barclay JL, Kerr LM, Arthur L, Rowland JE, Nelson CN, Ishikawa M, d’Aniello EM, White M, Noakes PG, Waters MJ. In vivo targeting of the growth hormone receptor (GHR) Box1 sequence demonstrates that the GHR does not signal exclusively through JAK2. Mol Endocrinol. 2010;24:204–217. doi: 10.1210/me.2009-0233. [DOI] [PMC free article] [PubMed] [Google Scholar]
- Baxter EJ, Scott LM, Campbell PJ, East C, Fourouclas N, Swanton S, Vassiliou GS, Bench AJ, Boyd EM, Curtin N, et al. Acquired mutation of the tyrosine kinase JAK2 in human myeloproliferative disorders. Lancet. 2005;365:1054–1061. doi: 10.1016/S0140-6736(05)71142-9. [DOI] [PubMed] [Google Scholar]
- Bazan JF. Haemopoietic receptors and helical cytokines. Immunol Today. 1990;11:350–354. doi: 10.1016/0167-5699(90)90139-z. [DOI] [PubMed] [Google Scholar]
- Bivona TG, Hieronymus H, Parker J, Chang K, Taron M, Rosell R, Moonsamy P, Dahlman K, Miller VA, Costa C, et al. FAS and NF-kappaB signalling modulate dependence of lung cancers on mutant EGFR. Nature. 2011;471:523–526. doi: 10.1038/nature09870. [DOI] [PMC free article] [PubMed] [Google Scholar]
- Boersma YL, Chao G, Steiner D, Wittrup KD, Pluckthun A. Bispecific designed ankyrin repeat proteins (DARPins) targeting epidermal growth factor receptor inhibit A431 cell proliferation and receptor recycling. J Biol Chem. 2011;286:41273–41285. doi: 10.1074/jbc.M111.293266. [DOI] [PMC free article] [PubMed] [Google Scholar]
- Boulanger MJ, Chow DC, Brevnova EE, Garcia KC. Hexameric structure and assembly of the interleukin-6/IL-6 alpha-receptor/gp130 complex. Science. 2003;300:2101–2104. doi: 10.1126/science.1083901. [DOI] [PubMed] [Google Scholar]
- Brooks AJ, Dai W, O’Mara ML, Abankwa D, Chhabra Y, Pelekanos RA, Gardon O, Tunny KA, Blucher KM, Morton CJ, et al. Mechanism of activation of protein kinase JAK2 by the growth hormone receptor. Science. 2014;344:1249783. doi: 10.1126/science.1249783. [DOI] [PubMed] [Google Scholar]
- Constantinescu SN, Ghaffari S, Lodish HF. The Erythropoietin Receptor: Structure, Activation and Intracellular Signal Transduction. Trends Endocrinol Metab. 1999;10:18–23. doi: 10.1016/s1043-2760(98)00101-5. [DOI] [PubMed] [Google Scholar]
- Constantinescu SN, Huang LJ, Nam H, Lodish HF. The erythropoietin receptor cytosolic juxtamembrane domain contains an essential, precisely oriented, hydrophobic motif. Mol Cell. 2001;7:377–385. doi: 10.1016/s1097-2765(01)00185-x. [DOI] [PubMed] [Google Scholar]
- Seubert N, Royer Y, Staerk J, Kubatzky KF, Moucadel V, Krishnakumar S, Smith SO, Constantinescu SN. Active and inactive orientations of the transmembrane and cytosolic domains of the erythropoietin receptor dimer. Mol Cell. 2003;12:1239–1250. doi: 10.1016/s1097-2765(03)00389-7. [DOI] [PubMed] [Google Scholar]
- de Vos AM, Ultsch M, Kossiakoff AA. Human growth hormone and extracellular domain of its receptor: crystal structure of the complex. Science. 1992;255:306–312. doi: 10.1126/science.1549776. [DOI] [PubMed] [Google Scholar]
- Decker T, Kovarik P. Serine phosphorylation of STATs. Oncogene. 2000;19:2628–2637. doi: 10.1038/sj.onc.1203481. [DOI] [PubMed] [Google Scholar]
- Drake MT, Violin JD, Whalen EJ, Wisler JW, Shenoy SK, Lefkowitz RJ. beta-arrestin-biased agonism at the beta2-adrenergic receptor. J Biol Chem. 2008;283:5669–5676. doi: 10.1074/jbc.M708118200. [DOI] [PubMed] [Google Scholar]
- Dupont S, Masse A, James C, Teyssandier I, Lecluse Y, Larbret F, Ugo V, Saulnier P, Koscielny S, Le Couedic JP, et al. The JAK2 617V>F mutation triggers erythropoietin hypersensitivity and terminal erythroid amplification in primary cells from patients with polycythemia vera. Blood. 2007;110:1013–1021. doi: 10.1182/blood-2006-10-054940. [DOI] [PubMed] [Google Scholar]
- Gabler K, Behrmann I, Haan C. JAK2 mutants (e.g., JAK2V617F) and their importance as drug targets in myeloproliferative neoplasms. JAKSTAT. 2013;2:e25025. doi: 10.4161/jkst.25025. [DOI] [PMC free article] [PubMed] [Google Scholar]
- Gent J, van Kerkhof P, Roza M, Bu G, Strous GJ. Ligand-independent growth hormone receptor dimerization occurs in the endoplasmic reticulum and is required for ubiquitin system-dependent endocytosis. Proc Natl Acad Sci U S A. 2002;99:9858–9863. doi: 10.1073/pnas.152294299. [DOI] [PMC free article] [PubMed] [Google Scholar]
- Hansen G, Hercus TR, McClure BJ, Stomski FC, Dottore M, Powell J, Ramshaw H, Woodcock JM, Xu Y, Guthridge M, et al. The structure of the GM-CSF receptor complex reveals a distinct mode of cytokine receptor activation. Cell. 2008;134:496–507. doi: 10.1016/j.cell.2008.05.053. [DOI] [PubMed] [Google Scholar]
- Heller NM, Qi X, Gesbert F, Keegan AD. The extracellular and transmembrane domains of the gammaC and interleukin (IL)-13 receptor alpha1 chains, not their cytoplasmic domains, dictate the nature of signaling responses to IL-4 and IL-13. J Biol Chem. 2012;287:31948–31961. doi: 10.1074/jbc.M112.348896. [DOI] [PMC free article] [PubMed] [Google Scholar]
- Ihle JN, Witthuhn BA, Quelle FW, Yamamoto K, Silvennoinen O. Signaling through the hematopoietic cytokine receptors. Annu Rev Immunol. 1995;13:369–398. doi: 10.1146/annurev.iy.13.040195.002101. [DOI] [PubMed] [Google Scholar]
- James C, Ugo V, Casadevall N, Constantinescu SN, Vainchenker W. A JAK2 mutation in myeloproliferative disorders: pathogenesis and therapeutic and scientific prospects. Trends Mol Med. 2005;11:546–554. doi: 10.1016/j.molmed.2005.10.003. [DOI] [PubMed] [Google Scholar]
- Jost C, Schilling J, Tamaskovic R, Schwill M, Honegger A, Pluckthun A. Structural basis for eliciting a cytotoxic effect in HER2-overexpressing cancer cells via binding to the extracellular domain of HER2. Structure. 2013;21:1979–1991. doi: 10.1016/j.str.2013.08.020. [DOI] [PubMed] [Google Scholar]
- Kabsch W. Xds. Acta Crystallogr D Biol Crystallogr. 2010;66:125–132. doi: 10.1107/S0907444909047337. [DOI] [PMC free article] [PubMed] [Google Scholar]
- Kavran JM, McCabe JM, Byrne PO, Connacher MK, Wang Z, Ramek A, Sarabipour S, Shan Y, Shaw DE, Hristova K, et al. How IGF-1 activates its receptor. eLife. 2014;3 doi: 10.7554/eLife.03772. [DOI] [PMC free article] [PubMed] [Google Scholar]
- Klemm JD, Schreiber SL, Crabtree GR. Dimerization as a regulatory mechanism in signal transduction. Annual Review of Immunology. 1998;16:569–592. doi: 10.1146/annurev.immunol.16.1.569. [DOI] [PubMed] [Google Scholar]
- Kralovics R, Passamonti F, Buser AS, Teo SS, Tiedt R, Passweg JR, Tichelli A, Cazzola M, Skoda RC. A gain-of-function mutation of JAK2 in myeloproliferative disorders. N Engl J Med. 2005;352:1779–1790. doi: 10.1056/NEJMoa051113. [DOI] [PubMed] [Google Scholar]
- LaPorte SL, Juo ZS, Vaclavikova J, Colf LA, Qi X, Heller NM, Keegan AD, Garcia KC. Molecular and structural basis of cytokine receptor pleiotropy in the interleukin-4/13 system. Cell. 2008;132:259–272. doi: 10.1016/j.cell.2007.12.030. [DOI] [PMC free article] [PubMed] [Google Scholar]
- Lemmon MA, Schlessinger J. Cell signaling by receptor tyrosine kinases. Cell. 2010;141:1117–1134. doi: 10.1016/j.cell.2010.06.011. [DOI] [PMC free article] [PubMed] [Google Scholar]
- Levine RL, Wadleigh M, Cools J, Ebert BL, Wernig G, Huntly BJ, Boggon TJ, Wlodarska I, Clark JJ, Moore S, et al. Activating mutation in the tyrosine kinase JAK2 in polycythemia vera, essential thrombocythemia, and myeloid metaplasia with myelofibrosis. Cancer Cell. 2005;7:387–397. doi: 10.1016/j.ccr.2005.03.023. [DOI] [PubMed] [Google Scholar]
- Li W, Lan H, Liu H, Fu Z, Yang Y, Han W, Guo F, Liu Y, Zhang H, Liu J, et al. The activation and differential signalling of the growth hormone receptor induced by pGH or anti-idiotypic monoclonal antibodies in primary rat hepatocytes. Mol Cell Endocrinol. 2013;376:51–59. doi: 10.1016/j.mce.2013.06.008. [DOI] [PubMed] [Google Scholar]
- Liao W, Lin JX, Leonard WJ. IL-2 family cytokines: new insights into the complex roles of IL-2 as a broad regulator of T helper cell differentiation. Curr Opin Immunol. 2011;23:598–604. doi: 10.1016/j.coi.2011.08.003. [DOI] [PMC free article] [PubMed] [Google Scholar]
- Lim AC, Ketchem RR, Borges L, Carabeo T, Carter J, Hoover JE, Hu Z, Wittekind M, Zhou H, Mehlin C. A diversity of antibody epitopes can induce signaling through the erythropoietin receptor. Biochemistry. 2010;49:3797–3804. doi: 10.1021/bi1001147. [DOI] [PubMed] [Google Scholar]
- Liu W, Kawahara M, Ueda H, Nagamune T. The influence of domain structures on the signal transduction of chimeric receptors derived from the erythropoietin receptor. J Biochem. 2009;145:575–584. doi: 10.1093/jb/mvp013. [DOI] [PubMed] [Google Scholar]
- Livnah O, Johnson DL, Stura EA, Farrell FX, Barbone FP, You Y, Liu KD, Goldsmith MA, He W, Krause CD, et al. An antagonist peptide-EPO receptor complex suggests that receptor dimerization is not sufficient for activation. Nat Struct Biol. 1998;5:993–1004. doi: 10.1038/2965. [DOI] [PubMed] [Google Scholar]
- Livnah O, Stura EA, Johnson DL, Middleton SA, Mulcahy LS, Wrighton NC, Dower WJ, Jolliffe LK, Wilson IA. Functional mimicry of a protein hormone by a peptide agonist: the EPO receptor complex at 2.8 A. Science. 1996;273:464–471. doi: 10.1126/science.273.5274.464. [DOI] [PubMed] [Google Scholar]
- Livnah O, Stura EA, Middleton SA, Johnson DL, Jolliffe LK, Wilson IA. Crystallographic evidence for preformed dimers of erythropoietin receptor before ligand activation. Science. 1999;283:987–990. doi: 10.1126/science.283.5404.987. [DOI] [PubMed] [Google Scholar]
- Lu X, Huang LJ, Lodish HF. Dimerization by a cytokine receptor is necessary for constitutive activation of JAK2V617F. J Biol Chem. 2008;283:5258–5266. doi: 10.1074/jbc.M707125200. [DOI] [PubMed] [Google Scholar]
- Lupardus PJ, Skiniotis G, Rice AJ, Thomas C, Fischer S, Walz T, Garcia KC. Structural snapshots of full-length Jak1, a transmembrane gp130/IL-6/IL-6Ralpha cytokine receptor complex, and the receptor-Jak1 holocomplex. Structure. 2011;19:45–55. doi: 10.1016/j.str.2010.10.010. [DOI] [PMC free article] [PubMed] [Google Scholar]
- McCoy AJ. Solving structures of protein complexes by molecular replacement with Phaser. Acta Crystallogr D Biol Crystallogr. 2007;63:32–41. doi: 10.1107/S0907444906045975. [DOI] [PMC free article] [PubMed] [Google Scholar]
- Millot GA, Vainchenker W, Dumenil D, Svinarchuk F. Differential signalling of NH2-terminal flag-labelled thrombopoietin receptor activated by TPO or anti-FLAG antibodies. Cell Signal. 2004;16:355–363. doi: 10.1016/j.cellsig.2003.08.010. [DOI] [PubMed] [Google Scholar]
- Muller-Newen G, Kuster A, Wijdenes J, Schaper F, Heinrich PC. Studies on the interleukin-6-type cytokine signal transducer gp130 reveal a novel mechanism of receptor activation by monoclonal antibodies. J Biol Chem. 2000;275:4579–4586. doi: 10.1074/jbc.275.7.4579. [DOI] [PubMed] [Google Scholar]
- Nakano K, Kojima T, Kasutani K, Senoh C, Natori O, Ishii S, Tsunoda H, Hattori K. Effective screening method of agonistic diabodies based on autocrine growth. Journal of immunological methods. 2009;347:31–35. doi: 10.1016/j.jim.2009.05.012. [DOI] [PubMed] [Google Scholar]
- O’Shea JJ, Paul WE. Mechanisms underlying lineage commitment and plasticity of helper CD4+ T cells. Science. 2010;327:1098–1102. doi: 10.1126/science.1178334. [DOI] [PMC free article] [PubMed] [Google Scholar]
- Ohashi H, Maruyama K, Liu YC, Yoshimura A. Ligand-induced activation of chimeric receptors between the erythropoietin receptor and receptor tyrosine kinases. Proc Natl Acad Sci U S A. 1994;91:158–162. doi: 10.1073/pnas.91.1.158. [DOI] [PMC free article] [PubMed] [Google Scholar]
- Ottemann KM, Xiao W, Shin YK, Koshland DE., Jr A piston model for transmembrane signaling of the aspartate receptor. Science. 1999;285:1751–1754. doi: 10.1126/science.285.5434.1751. [DOI] [PubMed] [Google Scholar]
- Otwinowski Z, Minor W, Carter CW., Jr . Methods in Enzymology. New York: Academic Press; 1997. Processing of X-ray diffraction data collected in oscillation mode; pp. 307–326. [DOI] [PubMed] [Google Scholar]
- Pattyn E, Van Ostade X, Schauvliege L, Verhee A, Kalai M, Vandekerckhove J, Tavernier J. Dimerization of the interferon type I receptor IFNaR2-2 is sufficient for induction of interferon effector genes but not for full antiviral activity. J Biol Chem. 1999;274:34838–34845. doi: 10.1074/jbc.274.49.34838. [DOI] [PubMed] [Google Scholar]
- Perisic O, Webb PA, Holliger P, Winter G, Williams RL. Crystal structure of a diabody, a bivalent antibody fragment. Structure. 1994;2:1217–1226. doi: 10.1016/s0969-2126(94)00123-5. [DOI] [PubMed] [Google Scholar]
- Pikman Y, Lee BH, Mercher T, McDowell E, Ebert BL, Gozo M, Cuker A, Wernig G, Moore S, Galinsky I, et al. MPLW515L is a novel somatic activating mutation in myelofibrosis with myeloid metaplasia. PLoS Med. 2006;3:e270. doi: 10.1371/journal.pmed.0030270. [DOI] [PMC free article] [PubMed] [Google Scholar]
- Rebouissou S, Amessou M, Couchy G, Poussin K, Imbeaud S, Pilati C, Izard T, Balabaud C, Bioulac-Sage P, Zucman-Rossi J. Frequent in-frame somatic deletions activate gp130 in inflammatory hepatocellular tumours. Nature. 2009;457:200–204. doi: 10.1038/nature07475. [DOI] [PMC free article] [PubMed] [Google Scholar]
- Ring AM, Lin J, Feng D, Mitra S, Rickert M, Bowman GR, Pande VS, Li P, Moraga I, Spolski R, et al. Mechanistic and structural insight into the functional dichotomy between interleukin-2 and interleukin-15. Nature Immunology. 2012;13:1187–1195. doi: 10.1038/ni.2449. [DOI] [PMC free article] [PubMed] [Google Scholar]
- Roder F, Wilmes S, Richter CP, Piehler J. Rapid transfer of transmembrane proteins for single molecule dimerization assays in polymer-supported membranes. ACS Chem Biol. 2014;9:2479–2484. doi: 10.1021/cb5005806. [DOI] [PubMed] [Google Scholar]
- Rothbauer U, Zolghadr K, Muyldermans S, Schepers A, Cardoso MC, Leonhardt H. A versatile nanotrap for biochemical and functional studies with fluorescent fusion proteins. Mol Cell Proteomics. 2008;7:282–289. doi: 10.1074/mcp.M700342-MCP200. [DOI] [PubMed] [Google Scholar]
- Rowlinson SW, Yoshizato H, Barclay JL, Brooks AJ, Behncken SN, Kerr LM, Millard K, Palethorpe K, Nielsen K, Clyde-Smith J, et al. An agonist-induced conformational change in the growth hormone receptor determines the choice of signalling pathway. Nat Cell Biol. 2008;10:740–747. doi: 10.1038/ncb1737. [DOI] [PubMed] [Google Scholar]
- Seita J, Sahoo D, Rossi DJ, Bhattacharya D, Serwold T, Inlay MA, Ehrlich LI, Fathman JW, Dill DL, Weissman IL. Gene Expression Commons: an open platform for absolute gene expression profiling. PLoS One. 2012;7:e40321. doi: 10.1371/journal.pone.0040321. [DOI] [PMC free article] [PubMed] [Google Scholar]
- Serge A, Bertaux N, Rigneault H, Marguet D. Dynamic multiple-target tracing to probe spatiotemporal cartography of cell membranes. Nat Methods. 2008;5:687–694. doi: 10.1038/nmeth.1233. [DOI] [PubMed] [Google Scholar]
- Socolovsky M, Fallon AE, Lodish HF. The prolactin receptor rescues EpoR−/− erythroid progenitors and replaces EpoR in a synergistic interaction with c-kit. Blood. 1998;92:1491–1496. [PubMed] [Google Scholar]
- Spangler JB, Moraga I, Mendoza JL, Garcia KC. Insights Into Cytokine-Receptor Interactions from Cytokine Engineering. Annu Rev Immunol. 2014 doi: 10.1146/annurev-immunol-032713-120211. [DOI] [PMC free article] [PubMed] [Google Scholar]
- Staerk J, Defour JP, Pecquet C, Leroy E, Antoine-Poirel H, Brett I, Itaya M, Smith SO, Vainchenker W, Constantinescu SN. Orientation-specific signalling by thrombopoietin receptor dimers. EMBO J. 2011;30:4398–4413. doi: 10.1038/emboj.2011.315. [DOI] [PMC free article] [PubMed] [Google Scholar]
- Stroud RM, Wells JA. Mechanistic diversity of cytokine receptor signaling across cell membranes. Sci STKE. 2004;2004:re7. doi: 10.1126/stke.2312004re7. [DOI] [PubMed] [Google Scholar]
- Syed RS, Reid SW, Li C, Cheetham JC, Aoki KH, Liu B, Zhan H, Osslund TD, Chirino AJ, Zhang J, et al. Efficiency of signalling through cytokine receptors depends critically on receptor orientation. Nature. 1998;395:511–516. doi: 10.1038/26773. [DOI] [PubMed] [Google Scholar]
- Thomas C, Moraga I, Levin D, Krutzik PO, Podoplelova Y, Trejo A, Lee C, Yarden G, Vleck SE, Glenn JS, et al. Structural linkage between ligand discrimination and receptor activation by type I interferons. Cell. 2011;146:621–632. doi: 10.1016/j.cell.2011.06.048. [DOI] [PMC free article] [PubMed] [Google Scholar]
- Ullrich A, Schlessinger J. Signal transduction by receptors with tyrosine kinase activity. Cell. 1990;61:203–212. doi: 10.1016/0092-8674(90)90801-k. [DOI] [PubMed] [Google Scholar]
- Venkatakrishnan AJ, Deupi X, Lebon G, Tate CG, Schertler GF, Babu MM. Molecular signatures of G-protein-coupled receptors. Nature. 2013;494:185–194. doi: 10.1038/nature11896. [DOI] [PubMed] [Google Scholar]
- Verstovsek S, Kantarjian H, Mesa RA, Pardanani AD, Cortes-Franco J, Thomas DA, Estrov Z, Fridman JS, Bradley EC, Erickson-Viitanen S, et al. Safety and efficacy of INCB018424, a JAK1 and JAK2 inhibitor, in myelofibrosis. N Engl J Med. 2010;363:1117–1127. doi: 10.1056/NEJMoa1002028. [DOI] [PMC free article] [PubMed] [Google Scholar]
- Walter MR, Windsor WT, Nagabhushan TL, Lundell DJ, Lunn CA, Zauodny PJ, Narula SK. Crystal structure of a complex between interferon-gamma and its soluble high-affinity receptor. Nature. 1995;376:230–235. doi: 10.1038/376230a0. [DOI] [PubMed] [Google Scholar]
- Wang X, Lupardus P, Laporte SL, Garcia KC. Structural biology of shared cytokine receptors. Annu Rev Immunol. 2009;27:29–60. doi: 10.1146/annurev.immunol.24.021605.090616. [DOI] [PMC free article] [PubMed] [Google Scholar]
- Wang X, Rickert M, Garcia KC. Structure of the quaternary complex of interleukin-2 with its alpha, beta, and gammac receptors. Science. 2005;310:1159–1163. doi: 10.1126/science.1117893. [DOI] [PubMed] [Google Scholar]
- Wehrman T, He X, Raab B, Dukipatti A, Blau H, Garcia KC. Structural and mechanistic insights into nerve growth factor interactions with the TrkA and p75 receptors. Neuron. 2007;53:25–38. doi: 10.1016/j.neuron.2006.09.034. [DOI] [PubMed] [Google Scholar]
- Wells JA, de Vos AM. Structure and function of human growth hormone: implications for the hematopoietins. Annu Rev Biophys Biomol Struct. 1993;22:329–351. doi: 10.1146/annurev.bb.22.060193.001553. [DOI] [PubMed] [Google Scholar]
- Wilson IA, Jolliffe LK. The structure, organization, activation and plasticity of the erythropoietin receptor. Curr Opin Struct Biol. 1999;9:696–704. doi: 10.1016/s0959-440x(99)00032-9. [DOI] [PubMed] [Google Scholar]
- You C, Wilmes S, Beutel O, Lochte S, Podoplelowa Y, Roder F, Richter C, Seine T, Schaible D, Uze G, et al. Self-controlled monofunctionalization of quantum dots for multiplexed protein tracking in live cells. Angew Chem Int Ed Engl. 2010;49:4108–4112. doi: 10.1002/anie.200907032. [DOI] [PubMed] [Google Scholar]
- Zenatti PP, Ribeiro D, Li W, Zuurbier L, Silva MC, Paganin M, Tritapoe J, Hixon JA, Silveira AB, Cardoso BA, et al. Oncogenic IL7R gain-of-function mutations in childhood T-cell acute lymphoblastic leukemia. Nat Genet. 2011;43:932–939. doi: 10.1038/ng.924. [DOI] [PMC free article] [PubMed] [Google Scholar]
- Zhang H, Wilson IA, Lerner RA. Selection of antibodies that regulate phenotype from intracellular combinatorial antibody libraries. Proc Natl Acad Sci U S A. 2012;109:15728–15733. doi: 10.1073/pnas.1214275109. [DOI] [PMC free article] [PubMed] [Google Scholar]
- Zhang H, Yea K, Xie J, Ruiz D, Wilson IA, Lerner RA. Selecting agonists from single cells infected with combinatorial antibody libraries. Chem Biol. 2013;20:734–741. doi: 10.1016/j.chembiol.2013.04.012. [DOI] [PubMed] [Google Scholar]
Associated Data
This section collects any data citations, data availability statements, or supplementary materials included in this article.