

Abstract
Previous findings in diabetic rodents suggest that insulin activation of atypical protein kinase C (aPKC) is impaired in muscle, but surprisingly conserved in liver, despite impaired hepatic PKB/Akt activation. Moreover, aPKC at least partly regulates two major trans-activators, viz.,hepatic sterol receptor binding protein-1c (SREBP-1c), which controls lipid synthesis, and NFκB, which promotes inflammation and systemic insulin resistance. Presently, in type 2 diabetic Goto-Kakizaki (GK) rats, we examined whether: (a) differences in hepatic aPKC and PKB activation reflect differences in activation of insulin receptor substrate (IRS)-1- and IRS-2-dependent phosphatidylinositol 3-kinase (PI3K); (b) hepatic SREBP-1c and NFκB are excessively activated by aPKC; and (c) metabolic consequences of excessive hepatic aPKC/SREBP-1c/NFκB activation. We found that, in liver as well as in muscle, whereas IRS-1/PI3K activation by insulin was impaired, IRS-2/PI3K was intact. Moreover, selective inhibition of hepatic aPKC by adenoviral-mediated expression of either kinase-inactive aPKC, or shRNA that targets and partially depletes hepatic IRS-2, which controls hepatic aPKC during insulin activation, diminished hepatic SREBP-1c expression and NFκB activities, and concomitantly improved serum lipids and insulin signalling in muscle and liver. Similar improvements in SREBP-1c, NFκB and insulin signaling were seen in ob/ob mice following inhibition of hepatic aPKC. Our findings suggest that, in diabetic rodents: (a) in liver, diminished PKB activation largely reflects impaired IRS-1/PI3K activation, and conserved aPKC activation reflects retained IRS-2/PI3K activity; (b) hepatic aPKC contributes importantly to excessive SREPB-1c and NFκB activities; and (c) excessive hepatic aPKC-dependent activation of SREBP-1c and NFκB contributes importantly to hyperlipidaemia and systemic insulin resistance.
Keywords: Diabetes, insulin, IRS-1, IRS-2, atypical protein kinase C, protein kinase B, liver, muscle
Atypical protein kinase C (aPKC) and protein kinase B (PKB/Akt), operating downstream of phosphatidylinositol 3-kinase (PI3K), mediate specific insulin effects. In muscle and adipocytes, aPKC and PKB co-activate glucose transport, and PKB increases glycogenesis; in liver, PKB diminishes glucose production/release, and aPKC and PKB together increase lipid synthesis.
Normally, insulin increases glucose uptake/storage in muscle/adipocytes, diminishes hepatic glucose output, and increases hepatic lipid synthesis. In type 2 diabetes, as expected, glucose clearance by muscle/adipocytes is diminished and hepatic glucose output is increased, but, inexplicably, lipid synthesis is paradoxically increased (1).
Relevant to divergent insulin regulation of hepatic glucose and lipid metabolism in two models of type 2 diabetes, Goto-Kakizaki (GK) rats and ob/ob mice, whereas PKB activation is impaired in muscle and liver (2,3), aPKC activation is impaired in muscle (2,4) but conserved in liver (2).
Conserved aPKC activation in diabetic liver is noteworthy, as aPKC mediates insulin/feeding effects on expression/activation of hepatic sterol regulatory element binding protein-1c (SREBP-1c) (5,6), which regulates expression of multiple enzymes engaged in lipid synthesis. Thus, conserved hepatic aPKC activation may contribute to paradoxical increases in lipid synthesis in diabetic liver. In this regard, although PKB co-regulates hepatic SREBP-1c expression (7,8), PKB activation is markedly impaired in diabetic liver (2) and is therefore unlikely to mediate increases in hepatic SREBP-1c expression.
Presently, there is limited information on SREBP-1c expression/activity, and whether conserved aPKC activity may underlie paradoxical activation of SREBP-1c and SREBP-1c-dependent lipid abnormalities in diabetic liver. Hepatic expression of SREBP-1c is increased in ob/ob and lipodystrophic diabetic mice (9), but information in GK-rats is lacking. In streptozotocin(STZ)-induced hypoinsulinaemic diabetes, hepatic SREBP-1c expression is depressed, but promptly responds to insulin (10) by an uncertain signalling mechanism.
As with SREBP-1c, conserved hepatic aPKC activation in hyperinsulinaemic diabetic states may excessively activate hepatic NFκB, since aPKC phosphorylates/activates IκB kinase-β (IKKβ (11,12), which phosphorylates IκKα/β,. thereby negating its restraining/inhibitory effects on NFκB, thereby allowing nuclear transfer and subsequent action of NFκB to increase expression of cytokines that promote inflammation, atherosclerotic processes and systemic insulin resistance (13,14). Along with IKKβ activation, aPKC directly phosphorylates/activates NFκB (12). Whether insulin activates IKKβNFκB in liver is unknown.
The reason for conserved aPKC activation and impaired PKB activation in diabetic liver is uncertain, as information on activities of upstream activators, IRS-1- and IRS-2-dependent phosphatidylinositol (PI) 3-kinase (3K) is limited: in GK- rats, insulin activation of IRS-1/PI3K is diminished in muscle (4), but there is no information on muscle IRS-2/PI3K, or on hepatic IRS-1/PI3K or IRS-2/PI3K; in ob/ob mice, activation of IRS-1/PI3K and to a lesser extent IRS-2/PI3K during 1-min insulin treatment is impaired in liver and muscle (15), but longer studies are lacking.
Germane to divergent activation of aPKC and PKB in diabetic liver, in IRS-1 knockout mice, insulin activation of aPKC (16) and PKB (16,17) is impaired in muscle, whereas, in liver, PKB activation is impaired (17), but aPKC activation is intact (16). In IRS-2-deficient hepatocytes, activation of both aPKC and PKB is impaired (18). Thus, in liver, aPKC is largely controlled by IRS-2, and PKB is controlled by both IRS-1 and IRS-2.
Here, we tested the hypothesis that conserved hepatic aPKC activation by insulin/feeding causes excessive expression/activation of SREBP-1c and activation of IKKβ/NFκB in GK-rats and ob/ob mice. We also examined whether conserved aPKC activation and impaired PKB activation in diabetic liver may reflect differences in insulin-induced activation of IRS-2/PI3K and IRS-1/PI3K. Most importantly, since excessive SREBP-1c activity can increase serum lipids, and, since both SREBP-1c, via lipids, and NFκB, via cytokines, can impair insulin action in muscle and liver, we questioned whether limiting activity of hepatic aPKC or its upstream regulator, IRS-2/PI3K (by administration of adenoviruses that encode factors that selectively alter hepatic signalling) would have salutary effects on serum lipids and insulin signalling mechanisms in these tissues.
Methods
Experimental Rodents
Male Wistar non-diabetic rats, 8–12 weeks of age, weight approx 250g, were obtained from Harlan Industries, and male GK-diabetic rats were obtained from our colony at the James A. Haley Veterans Hospital Vivarium in Tampa, Fl, USA (see 2, 4). Male ob/ob mice and lean counterparts, 8–12 weeks of age, weight approx 35g, were obtained from Jackson Laboratories. Rodents were maintained in conditions of constant temperature and humidity, with 12-hour light-dark cycles, and fed standard rat chow. All experimental procedures were approved by the Institutional Animal Care and Use Committee of the University of South Florida College of Medicine and James A. Haley Veterans Administration Medical Center Research and Development Committee, and were in accordance with the Principles of Helsinki.
Treatments
Rodents were injected intramuscularly (IM) or intraperitoneally (IP) with physiological saline (0.9% NaCl) or saline containing insulin (1U [kg body weight]−1) 5 or 15 min before killing to elicit maximal effects. Where indicated, rats were fasted overnight or fed their usual diet to observe effects of physiological feeding-dependent increases in serum insulin, or treated overnight with saline or long-acting glargine insulin (40U [kg body weight]−1), thereby increasing serum insulin levels in GK-diabetic rats from approximately 480pmol/l to 960 pmol/l [fed serum insulin levels in non-diabetic Wistar rats are approximately 160pmol/l (4)], and decreasing serum glucose levels from approximately 13.9mmol/l to 8.9mmol/l [fed serum glucose levels in Wistar rats are approximately 8.3mmol/l (4)].
Muscle and Liver Homogenates
As described (2,4), quadriceps muscles and liver were homogenized (Polytron) in buffer containing 0.25mol/l sucrose, 20mmol/l Tris/HCl (pH 7.5), 2mmol/l EGTA, 2mmol/l EDTA, 1mmol/l phenlysulfonlyfluoride (PMSF), 20μg/ml leupeptin, 10μg/ml aprotinin, 2mmol/l Na4P2O7, 2mmol/l Na3VO4, 2mmol/l NaF, and 1μmol/l microcystin, centrifuged for 10-min at 700 × g to remove debris, nuclei and fat, and resulting lysates were supplemented with 1% TritonX-100, 0.6% Nonidet and 150mmol/l NaCl, and centrifuged to remove insoluble materials.
aPKC Activation
As described (2,4), aPKCs were immunoprecipitated from cell lysates with a rabbit polyclonal antiserum (Santa Cruz Biotechnologies) that recognizes the C-termini of both PKC-ζ and PKC-λ, collected on Sepharose-AG beads, and incubated for 8-min; 32P-labelled substrate trapped on P-81 filter papers were counted.
PI3K Activation
Lysate IRS-1/PI3K and IRS-2/PI3K activities were determined as described (2,4). In brief, IRS-1 and IRS-2 immunoprecipitates (rabbit polyclonal antibodies; Upstate Cell Signalling) were examined for incorporation of 32PO4 into PI-3-PO4, which was purified by TLC and quantified with a BioRad Phosphor-Imager.
PKB Activation
Lysate PKB enzyme activity was measured using a kit from Upstate Cell Signalling, as described (2,4). In brief, PKB was immunoprecipitated with rabbit polyclonal antibodies, collected on Sepharose-AG beads, and incubated as per kit directions. PKB activation was also assessed by immunoblotting for phosphorylation of serine-473.
Immunoblot Studies
Western analyses were conducted as described (2,4), using: rabbit polyclonal anti-PKC-ζ/λ antiserum (Santa Cruz Biotechnologies); rabbit polyclonal anti-PKB antiserum (Upstate Cell Signalling); rabbit polyclonal anti-phospho-serine-473-PKB antiserum (Cell Signalling Technology): rabbit polyclonal anti-IRS-1 and anti-IRS-2 antisera (Upstate Cell Signalling); rabbit polyclonal anti-IRS-2 antiserum ((Upstate Cell Signalling); rabbit polyclonal anti-p85/PI3K antiserum ((Upstate Cell Signalling); rabbit polyclonal anti-SREBP-1c antiserum (Santa Cruz Biotechnologies); and rabbit polyclonal anti-phospho-serine-307-IRS-1 (Upstate Cell Signalling).
Adenoviral Studies
Adenoviruses encoding kinase-inactive (KI) PKC-ζ (19) and short hairpin (sh) RNA targeting IRS-2 (20) were described previously. Adenovirus vector or adenovirus encoding KI-PKC-ζ or shRNA targeting IRS-2 mRNA [2.5 × 10¹² plaque forming units (PFU) [kg body weight]−1] was administered intravenously (IV) through the tail vein. Where indicated, some rats, on the 4th day, were treated overnight with saline or long-acting glargine insulin (40U [kg body weight]−1); in other cases, on day 5, the rats were treated for 15 min with saline or regular insulin (1U [kg body weight]−1) in saline. Note that, relative to saline-treated controls, adenoviral treatments: did not alter serum aspartate-aminotransferase or alanine-aminotransferase levels or food intake; and provoked changes in levels or activities of targeted signalling factors only in liver (note that the inhibition of hepatic aPKC was accompanied by improved insulin signalling to PKB in liver, and to IRS-1/PI3K, aPKB and PKB in muscle).
Measurement of SREBP-1c and FAS mRNA
Hepatic SREBP-1c and FAS mRNAs were measured as described (21).
Nuclear Preparations
Liver nuclei were prepared as described (21) and used to: measure levels of active nuclear SREBP-1c fragment and p65/RelA subunit of NFκB; and perform NFκB electrophoretic mobility shift assays (EMSAs).
Electrophoretic Mobility Shift Assays (EMSAs)
NFκB-dependent shifts in mobility of specific 32PO4-labelled DNA sequences were measured with an Invitrogen kit. The sequence of the consensus nucleotide NFκB probe provided in the kit used for detection of the NFκB/DNA complex was 5′-AGTTGAGGGGACTTTCCCAGGC-3′ and 3′-TCAACTCCCCTGAAAGGGTCCG-5′.
Serum Tiracylglycerol, Cholesterol and Glucose Levels
Serum triacylglycerol and glucose levels were measured as described (21)
Statistical Evaluations
Data are expressed as mean ± SE, and P values were determined by a two-way ANOVA and the least-significant multiple comparison method.
Results
Studies in GK-Diabetic Rats
IRS-1/PI3K and IRS-2/PI3K Activation in Liver
Relevant to the question of divergent activation of PKB and aPKC during insulin action in diabetic liver, we found: (a) insulin increased IRS-1/PI3K activity in Wistar non-diabetic liver, but not in GK-diabetic liver (Fig 1a); and (b), in contrast, activation of IRS-2/PI3K by insulin was, if anything, greater in GK-diabetic liver (Fig 1b). Levels of IRS-1, IRS-2 and the p85 subunit of PI3K (Fig 1e) were comparable in livers of Wistar non-diabetic and GK-diabetic rats. Although not shown, we did not observe increases in phosphorylation of Ser-307-IRS-1 in GK-diabetic liver, relative to non-diabetic liver.
Figure 1.
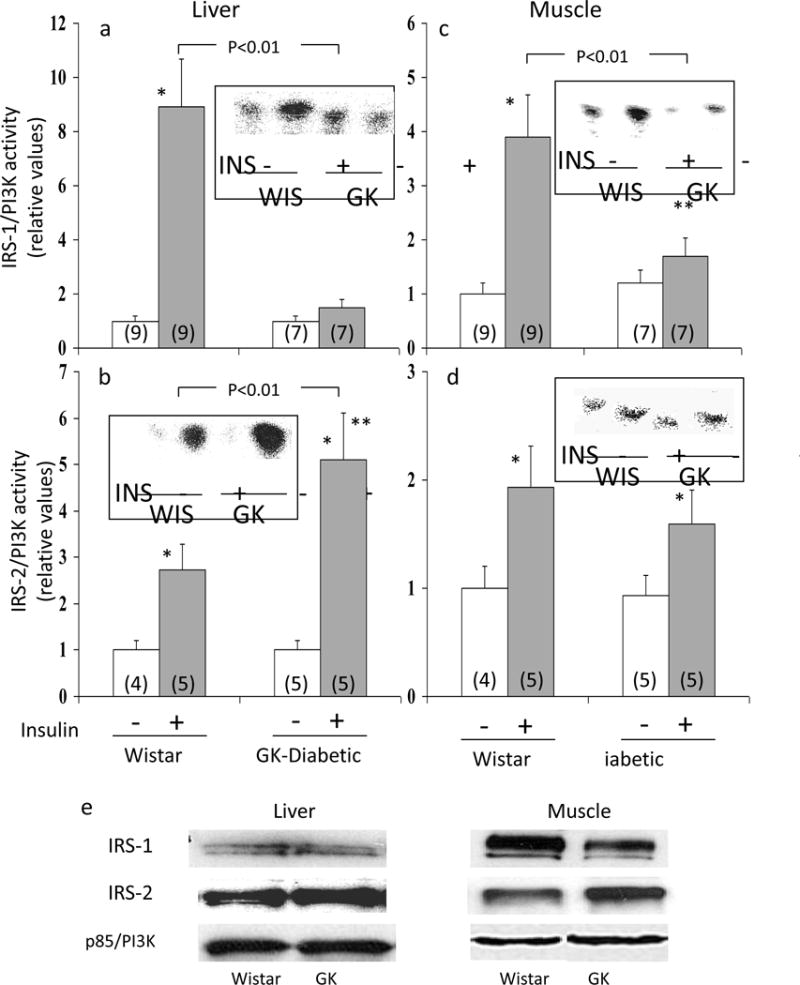
Activation of IRS-1- and IRS-2-dependent PI 3-kinase by insulin in livers and muscles of Wistar (WIS) non-diabetic and GK-diabetic rats. Insulin (1U [kg body weight]−1 in saline; shaded bars) or vehicle (clear bars) was administered intramuscularly 15 minutes before killing in muscle studies, and 5 min before killing in liver studies, i.e., optimal times for these tissues. Values are mean ± SE of (N) rats. Asterisks (*, P<0.05; **, P<0.01; ***, P<0.001) portray statistical comparisons of insulin-stimulated samples versus adjacent basal resting (i.e., unstimulated) samples of the indicated rat group. Depicted P values show comparisons of insulin-stimulated samples of GK-diabetic rats versus insulin-stimulated samples of Wistar non-diabetic rats. All P values were determined by ANOVA. Insets of Panels a, b, c and d show representative autoradiograms of PI-3-32PO4, the lipid product of the PI3K assay. Levels of IRS-1, IRS-2, and the p85 subunit of PI3K in liver and muscle of GK-diabetic and Wistar non-diabetic rats are portrayed by representative blots shown in Panel e (also see text).
IRS-1/PI3K and IRS-2/PI3K Activation in Muscle
As previously observed (4), insulin effects on IRS-1/PI3K were diminished in GK-diabetic muscle, relative to Wistar non-diabetic muscle (Fig 1c). In contrast, IRS-2/PI3K activation was not significantly diminished in GK-diabetic muscle (Fig 1d). Note that IRS-1 levels trended downward, and IRS-2 levels trended upward in GK-diabetic muscle (Fig 1e), but not significantly. Levels of the PI3K p85 subunit levels were comparable in non-diabetic and GK-diabetic muscle (Fig 1e). As shown in Fig 1 in ESM, in contrast to liver, phosphorylation of Ser-307-IRS-1 was increased in GK-diabetic muscle, relative to non-diabetic muscle.
Activation of Hepatic aPKC and PKB by Feeding
In Wistar non-diabetic rats, similar to findings in insulin-treated rats (2), aPKC (Fig 2a) and PKB (Fig 2b) activities were increased in fed, relative fasted, rats. These feeding-dependent increases in hepatic aPKC and PKB activities most likely reflected physiological increases in insulin secretion elicited by feeding, but other factors may also have contributed. Note that increases seen with insulin treatment in fed non-diabetic rats (ref 2 and see Fig 3) implies that feeding effects on hepatic aPKC and PKB are sub-maximal.
Figure 2.
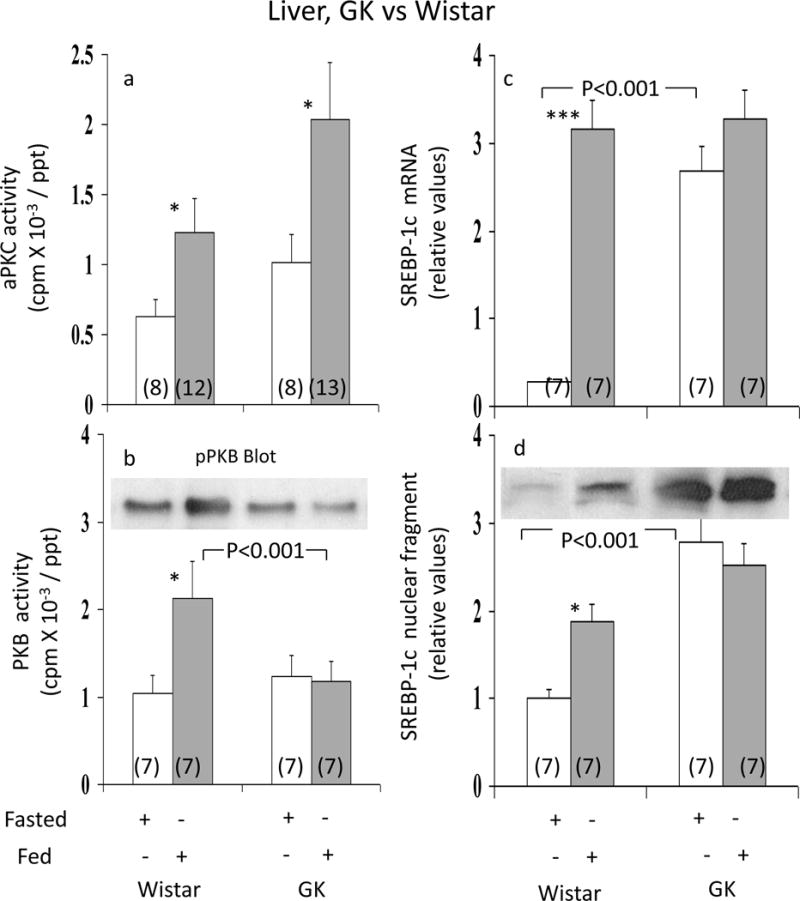
Effects of feeding on hepatic activities of aPKC (Panel a), PKB (Panel b), and expression (mRNA levels; Panel c) and activation (nuclear levels of active fragment; Panel d) of hepatic SREBP-1c in Wistar non-diabetic and GK-diabetic rats. Rats were either fasted overnight or allowed access to their usual diets, i.e, fed. Values are mean ± SE of (N) rats. Asterisks (*, P<0.05; **, P<0.01; ***, P<0.001) portray statistical comparisons of insulin-stimulated samples versus adjacent basal resting (i.e., unstimulated) samples of the indicated rat group. Depicted P values show comparisons of insulin-stimulated samples of GK-diabetic rats versus insulin-stimulated samples of Wistar non-diabetic rats. All P values were determined by ANOVA.
Figure 3.
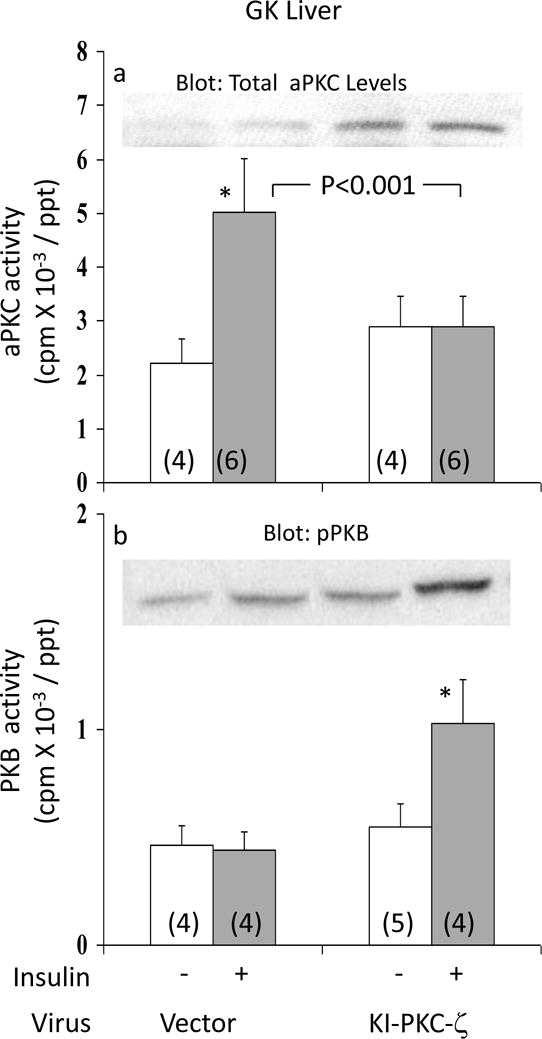
Effects of adenovirally-mediated expression of kinase-inactive (KI) PKC-ζ on basal and insulin-stimulated activities of aPKC (Panel a) and PKB (Panel b) in liver of GK-diabetic rats. Insulin treatment in these studies was for 15 min, i.e., optimal for the depicted signalling factors. Values are mean ± SE of (N) rats. Asterisks (*, P<0.05; **, P<0.01; ***, P<0.001) portray statistical comparisons of insulin-stimulated samples versus adjacent basal resting (i.e., unstimulated) samples of the indicated group. Depicted P values show comparisons of insulin-stimulated samples of vector-treated and KI-ζ-treated rats. All P values were determined by ANOVA. Insets show: expressed KI-PKC-ζ-induced increases in levels of hepatic total aPKC in Panel a; and a representative blot of immunoreactive phospho-Ser-473-PKB in Panel b.
In livers of GK-diabetic rats, whereas feeding-stimulated aPKC activity was, if anything, greater than that seen in Wistar non-diabetic controls (Fig 2a), PKB activity failed to increase with feeding (Fig 2b). Thus, the pattern of intact aPKC activation and impaired PKB activation in response to exogenous insulin treatment observed previously in livers of fed GK-diabetic rats (2) was reproduced in livers of fed versus fasted GK-diabetic rats.
Hepatic SREBP-1c Expression
Relative to fasted Wistar non-diabetic rats, hepatic SREBP-1c mRNA (Fig 2c) and SREBP-1c active nuclear fragment levels (Fig 2d) were increased in fed Wistar non-diabetic rats. However, in GK-diabetic rats, fasting levels of hepatic SREBP-1c mRNA (Fig 2c) and SREBP-1c nuclear protein levels (Fig 2d) were increased, relative to fasted Wistar non-diabetic rats, but did not increase further with feeding. Note that: (a) serum glucose levels were approximately 10mmol/l and 5mmol/l in fed and fasted Wistar rats, versus 18mmol/l and 10mmol/l in fed and fasted GK-diabetic rats; and (b), although not shown here, treatment of GK-diabetic rats with long-acting glargine insulin over 16 hours did not elicit further increases in SREBP-1c mRNA or nuclear levels above those seen with feeding alone, indicating persistent maximal activation of SREBP-1c in hyperinsulinaemic GK-diabetic rats, regardless of feeding.
Effects of Adenovirally-Administered Kinase-Inactive PKC-ζ on Hepatic aPKC and PKB
To determine if aPKC was required for maintaining hepatic SREBP-1c levels in fed GK-diabetic rats, these rats were treated with adenovirus encoding kinase-inactive (KI) PKC-ζ or adenovirus vector alone. As seen in Fig 3a, insulin provoked a 2.4-fold increase in hepatic aPKC activity in livers of GK-diabetic rats treated with adenovirus vector, similar to previously reported increases observed in fed GK-diabetic rats not treated with adenovirus (2). However, following administration of adenovirus encoding KI-PKC-ζ (which increased total hepatic aPKC levels – inset, Fig 3a), insulin-induced increases in hepatic aPKC activity were virtually abolished in GK-diabetic rats (Fig 3a).
In contrast to hepatic aPKC, whereas activation and Ser-473-phosphorylation of hepatic PKB was, as expected (2), markedly impaired in GK-diabetic rats treated with adenovirus alone, insulin-stimulated PKB activity (Fig 3b) and Ser-473-phosphorylation (Fig 3b) improved substantially following treatment with adenovirus encoding kinase-inactive PKC-ζ.
Effects of Adenovirally-Administered Kinase-Inactive PKC-ζ on Hepatic SREBP-1c and FAS
Compared to GK-diabetic rats treated with adenovirus vector alone, the administration of adenovirus encoding KI-PKC-ζ diminished hepatic levels of both SREBP-1c mRNA (Fig 4a) and the active nuclear SREBP-1c fragment (Fig 4b). Similarly, hepatic FAS mRNA, which is regulated by SREBP-1c, was diminished by expression of KI-PKC-ζ (Fig 4c). These findings suggested that the observed increases in SREBP-1c expression in GK-diabetic liver were at least partly dependent on continued activation of hepatic aPKC.
Figure 4.
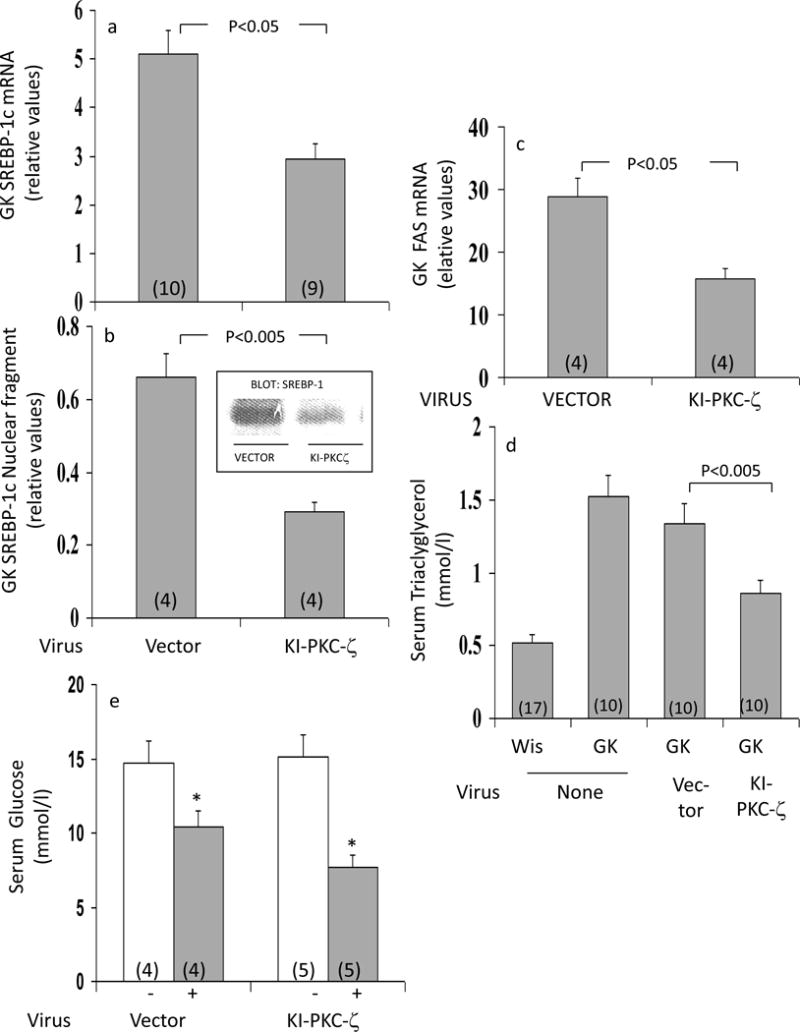
Effects of adenovirally-mediated expression of kinase-inactive (KI) PKC-ζ on (a) expression (mRNA; Panel a) and active nuclear fragment levels (Panel b) of SREBP-1c, and expression of FAS (Panel c) in liver; (b) fasting serum triglyceride levels (Panel d); and (c) unstimulated and insulin-stimulated serum glucose levels (Panel e) of fed GK-diabetic rats. Rats were injected IV with adenovirus vector (Vec) or adenovirus encoding KI-PKC-ζ (KI-ζ), and, 5 days later (to allow time for expression), rats were treated where indicated with insulin for 15 min. Values are mean ± SE of (N) rats. P values were determined by ANOVA.
Effects of Adenovirally-Administered Kinase-Inactive PKC-ζ on Serum Triacylglycerol and Glucose
As seen in Fig 4d, serum triacylglycerol was increased in GK-diabetic rats, relative to Wistar non-diabetic rats. Interestingly, in association with decreases in hepatic aPKC activity and SREBP-1c expression/activity following administration of adenovirus encoding KI-PKC-ζ, serum triacylglycerol diminished in GK-diabetic rats (Fig 4d). Decreases in serum glucose in response to insulin treatment were slightly but not significantly greater following administration of adenovirus encoding KI-PKC-ζ (Fig 4e).
Effects of Adenovirally-Administered Kinase-Inactive PKC-ζ on Hepatic IKKβ and NFκB NFκB
As discussed, IKKβ and NFκB are regulated by aPKC in some cell types and chronic IKKβ/NFκB activation in high-fat-fed mice contributes importantly to systemic insulin resistance; however, effects of insulin and diabetes on these activities are unknown. Relevant to these questions, we found that: (a) 16-hour overnight treatment with long-acting glargine insulin provoked increases in hepatic IKKβ activity (Fig 5a), NFκB electophoretic mobility shift activity (EMSA) (Figs 5b and 5c), and active p65/RelA/NFκB nuclear levels (Figs 5d) in fed Wistar non-diabetic rats (in contrast, acute 15 min insulin treatment was without effect – data not shown); and (b) activities of IKKβ (Fig 5a) and NFκB activity (as per EMSA in Figs 5b and c) and active p65/RelA/NFκB nuclear levels (Fig 5d) were increased in fed GK-diabetic rats, although not further increased by overnight glargine insulin treatment. Moreover, after treatment of GK-diabetic rats with adenovirus encoding KI-PKC-ζ, the activities of hepatic IKKβ (Fig 5a) and NFκB (Figs 5b, 5c, 5d) diminished to or below the levels seen in fed Wistar non-diabetic rats.
Figure 5.
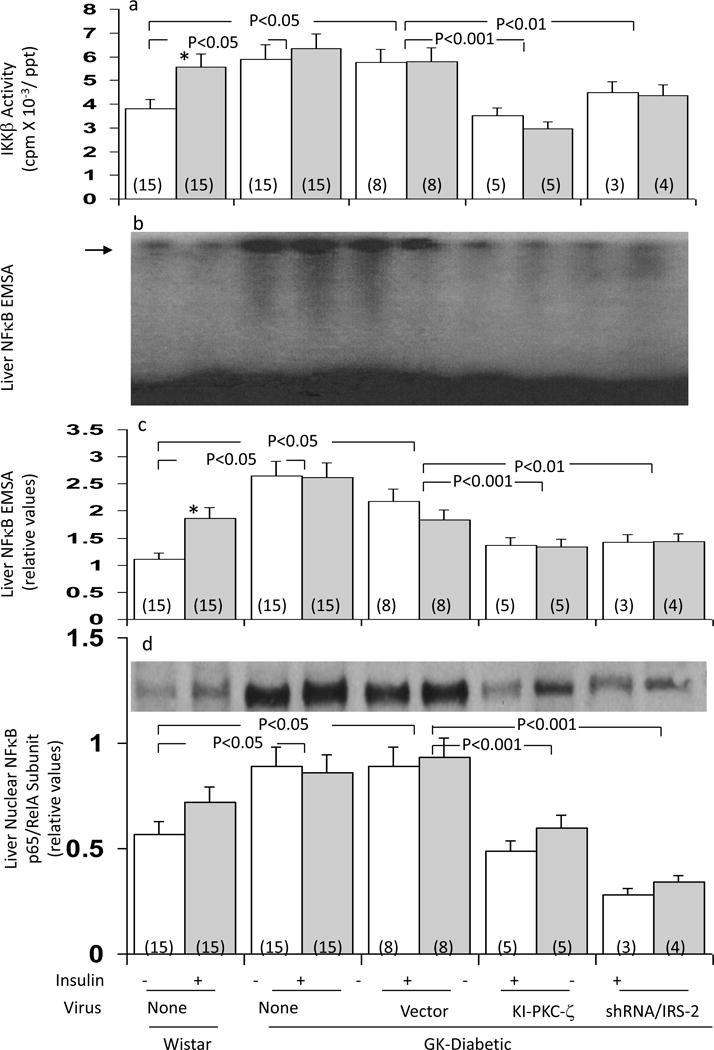
Effects of adenovirally-mediated expression of kinase-inactive (KI) PKC-ζ or short hairpin RNA (shRNA) targeting IRS-2 on hepatic IKKβ activity (Panel a), hepatic NFκB-dependent EMSA mobility shifts (Panels b and c), and hepatic nuclear levels of the p65RelA subunit of NFκB (Panel d) in fed GK-diabetic rats. Where indicated, rats were injected IV with adenovirus vector alone, or adenovirus encoding either KI-PKC-ζ or shRNA targeting IRS-2, and 5 days later (to allow time for expression and knockdown), mice were either treated IM overnight with saline or glargine insulin (40U [kg body weight]−1), as indicated. For comparisons in assays, basal and insulin-treated Wistar non-diabetic rats were similarly examined. Values are mean ± SE of (N) rats. P values (as per ANOVA) depict comparisons of indicated groups. Panel b shows a representative autoradiogram of NFκB EMSA mobility shifts of the indicated groups; the level of migration of the NFκB/DNA complex was determined with a standard provided with the assay kit, and is shown by the arrow; the electrophoretic front is at the bottom of the autoradiogram. Panel d shows a representative immunoblot of nuclear levels of the p65/RelA subunit of NFκB.
Effects of Adenovirally-Administered Kinase-Inactive PKC-ζ on Muscle IRS-1/PI3K, aPKC and PKB Activity
Similar to previous findings in virus-untreated GK-diabetic rats (refs 2 and 4, and Fig 1c), insulin activation of aPKC (Fig 6a) and IRS-1/PI3K (Fig 6b), but not PKB (Fig 6c), was markedly impaired in muscles of adenoviral vector-treated GK-diabetic rats. Remarkably, completely opposite to findings in liver, after administration of adenovirus encoding KI-PKC-ζ, insulin activation of aPKC was substantially increased in muscles of GK-diabetic rats (Fig 6a). This improvement in muscle aPKC activation in GK-diabetic rats following treatment with adenovirus encoding KI-PKC-ζ was accompanied by, and presumably at least partly due to, improved activation of IRS-1/PI3K (Fig 6c). Moreover, improvement in muscle IRS-1/PI3K activation may have been due in part to diminished phosphorylation of serine-307-IRS-1, which was inordinately increased in muscles of GK-diabetic rats (ESM).
Figure 6.
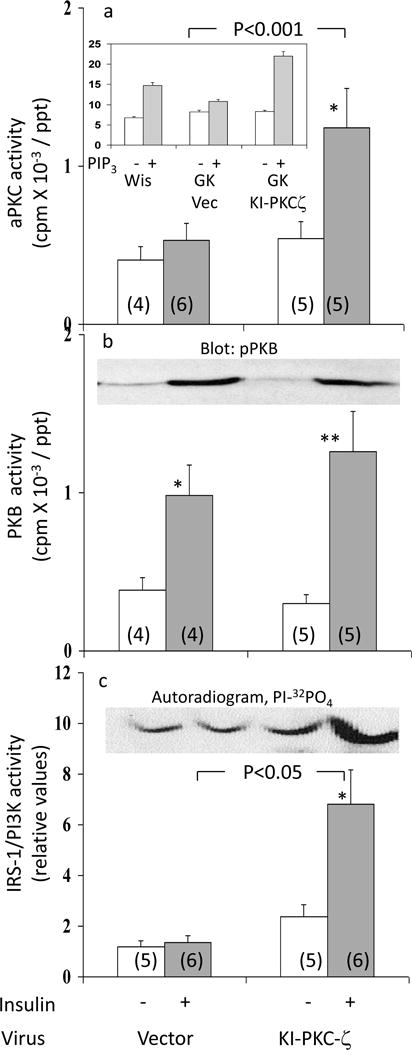
Effects of adenovirally-mediated expression of kinase-inactive (KI) PKC-ζ on basal and insulin-stimulated activities of aPKC (Panel a), PKB (Panel b), and IRS-1-dependent PI3K (Panel c), in vastus lateralis muscle of GK-diabetic rats. Insulin treatment in these studies was for 15 min, i.e., optimal for the depicted signaling factors. Values are mean ± SE of (N) rats. Asterisks (*, P<0.05; **, P<0.01; ***, P<0.001) portray statistical comparisons of insulin-stimulated samples versus adjacent basal resting (i.e., unstimulated) samples of the indicated rat group. Depicted P values show comparisons of insulin-stimulated samples of GK-diabetic rats versus insulin-stimulated samples of Wistar non-diabetic rats. All P values were determined by ANOVA. Insets show: 10 μmol/l PIP3-dependent activation of aPKC immunoprecipitated from muscles of indicated rats in Panel a; a representative immunoblot of phospho-Ser-473-PKB in Panel b; and a representative autoradiogram of PI-3-32PO4, the lipid product of the PI3K assay, in Panel c.
In addition to improved activation of aPKC in muscles of GK-diabetic rats in response to insulin treatment in vivo, responsiveness of immunoprecipitated muscle aPKC to PIP3 [note increases in activity of immunoprecipitated aPKC obtained from Wistar non-diabetic rats] was markedly improved following treatment with adenovirus encoding KI-PKC-ζ (inset, Fig 6a). Presumably, this increase in responsiveness to PIP3, in addition to increases in muscle IRS-1/PI3K activation, contributed to improved effects of insulin on muscle aPKC activity in GK-diabetic rats treated with adenovirus encoding KI-PKC-ζ.
Also note that, since PKB activation is diminished only slightly if at all in muscles of fed GK-diabetic rats treated with comparably high doses of insulin (2,4), it was not surprising that muscle PKB activation showed only a modest upward trend following administration of adenovirus encoding KI-PKC-ζ (Fig 6b).
Effects of shRNA-mediated Knockdown of Hepatic IRS-2 on: (a) Hepatic aPKC, PKB, SREBP-1c, FAS, and NFκB; (b) Muscle aPKC and IRS-1/PI3K; and (c) Serum Triacylglycerol
As discussed above, previous findings suggest that, unlike muscle, hepatic aPKC activation by insulin is dependent on IRS-2, rather than IRS-1, but, on the other hand, PKB activation is dependent on both, or either, IRS-1 and IRS-2. Accordingly, administration of adenovirus encoding shRNA targeting IRS-2, as reported (20), diminished IRS-2 levels within 5 days (Fig 7a; note – IRS-2 levels in muscle were not altered – data not shown); and, moreover, this decrease in hepatic IRS-2 markedly reduced insulin-stimulated aPKC activation (Fig 7b) in GK-diabetic liver. In marked contrast, hepatic PKB activation, which was markedly impaired in GK-diabetic rats treated with adenovirus alone, significantly improved following IRS-2 depletion (Fig 7c). This improvement in hepatic PKB activation in the face of sh-RNA-mediated IRS-2 depletion presumably reflected improved activation of IRS-1 and/or other IRSs by insulin.
Figure 7.
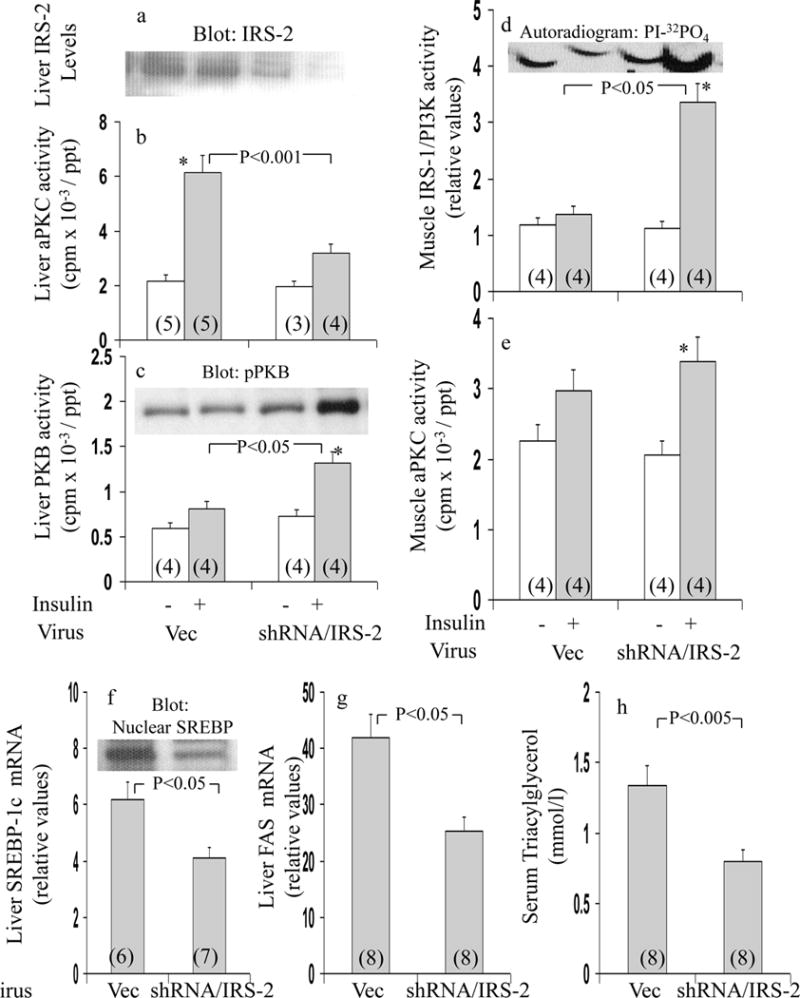
Effects adenovirally-mediated expression of short hairpin RNA (shRNA) targeting IRS-2 on basal and insulin-stimulated levels of immunoreactive IRS-2 (Panel a), aPKC (Panel b) and hepatic PKB (Panel c) in liver, and basal and insulin-stimulated muscle activities of IRS-1-dependent PI3K (Panel d) and aPKC (Panel e) in vastus lateralis muscle, and mRNA expression and nuclear levels of SREBP-1c (Panel f) and FAS (Panel g) in liver, and serum triglycerides (Panel h) of fed GK-diabetic rats. Rats were injected IV with adenovirus vector (Vec) or adenovirus encoding shRNA targeting IRS-2. Five days later, mice were treated IM for 15 min with saline (clear bars) or insulin in saline (shaded bars) before killing and harvesting of muscle and livers for depicted analyses. Values are mean ± SE of (N) rats. Asterisks indicate P<0.05 (*), P<0.01 (**) and P<0.001 (***) for insulin-stimulated versus adjacent basal samples from rats treated with comparable virus. Depicted P values show comparisons of indicated groups, viz., insulin-stimulated adenovirus vector versus insulin-stimulated adenovirus encoding shRNA targeting IRS-2. All P values were determined by ANOVA. Insets show representative: virus-induced alterations in levels of: immunoreactive hepatic IRS-2 in Panel a; immunoreactive phospho-ser-473-PKB (pPKB) in Panel c; autoradiogram of PI-3-32PO4, the lipid product of the PI3K assay, in Panel d; and, and immunoreactive hepatic nuclear SREBP-1c fragment in Panel f.
In association with shRNA-mediated IRS-2 depletion and diminished insulin activation of aPKC in liver, insulin activation of IRS-1/PI3K (Fig 7d) and aPKC (Fig 7e) improved in muscle in GK-diabetic rats. The improvement in muscle IRS-1/PI3K activation in muscle may have been due in part to diminished phosphorylation of serine-307-IRS-1, which was inordinately elevated in GK-diabetic rats (ESM). Additionally, inordinate increases in hepatic SREBP-1c mRNA (Fig 7f), SREBP-1c nuclear fragment levels (inset, Fig 7f), FAS mRNA (Fig 7g), IKKβ activity (Fig 7a), active nuclear p65RelA/NFκB levels (inset, Fig 5d), and NFκB EMSA activity (Figs 5b and 5c) diminished following administration of adenovirus encoding shRNA targeting IRS-2 in GK-diabetic rats. Moreover, in conjunction with improved hepatic SREBP-1c, serum triacylglycerol levels (Fig 7h) diminished in GK-diabetic rats after administration of adenovirus encoding shRNA targeting IRS-2.
As these improvements induced by IRS-2 knockdown were similar to those seen with inhibition of hepatic aPKC, and, since IRS-2 activates hepatic aPKC, it follows that effects of IRS-2 depletion were at least partly due to decreased hepatic aPKC activation.
Studies in Ob/Ob Mice
Effects of KI-PKC-ζ on Hepatic aPKC and SREBP-1c
Despite poor activation of both aPKC and PKB in muscle, and poor activation of PKB in liver, aPKC activation in liver is intact (2), and, moreover, is accompanied by excessive activation of hepatic SREBP-1c (9) in ob/ob obese-diabetic mice; comparable findings were seen in presently studied ob/ob mice (Fig 8). Presently, we also found that, as in GK-diabetic rats, administration of adenovirus encoding KI-PKC-ζ, as expected, diminished hepatic aPKC activity (Fig 8a), and this was accompanied by decreases in hepatic SREBP-1c mRNA and active nuclear fragment levels (Fig 8e), SREBP-1c-dependent FAS expression (Fig 8f), nuclear levels of hepatic p65/RelA/NFκB (Fig 8g), and NFκB-dependent EMSA gel-shift activity (Fig 8h). Furthermore, unlike hepatic aPKC activity, muscle aPKC activity increased (Fig 8b), and was accompanied by increases in activities of hepatic PKB (Fig 8c) and muscle PKB (Fig 8d) following treatment with adenovirus encoding KI-PKC-ζ. Like PKB activity, phosphorylation (pSer-473) of hepatic PKB and muscle PKB respectively increased from 1.00±0.29 to 3.16±0.76 (P<0.05) and from 1.00±0.35 to 2.85±0.58 (P<0.05).
Figure 8.
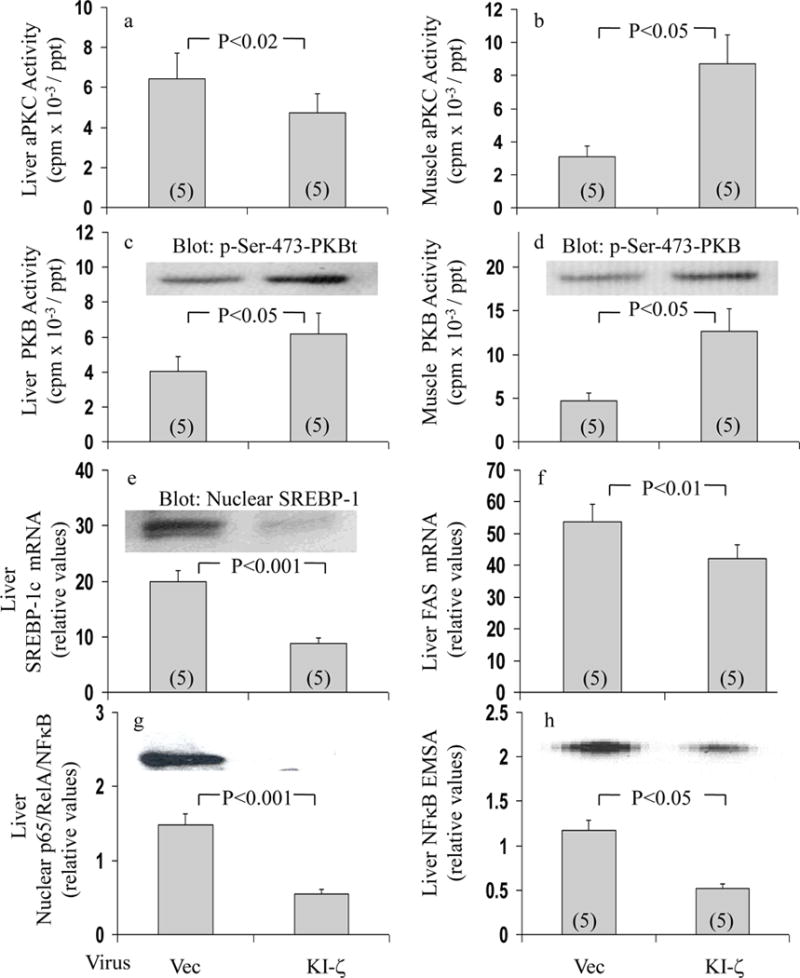
Effects of adenovirally-mediated expression of kinase-inactive (KI) PKC-ζ on activities of aPKC (Panel a) and PKB (Panel c) in liver, and aPKC (Panel b) and PKB (Panel d) in vastus lateralis muscle, and expression and nuclear levels of SREBP-1c (Panel e), expression of FAS (Panel f), nuclear levels of p65/RelA subunit of NFκB (Panel g), and NFκB-dependent mobility shifts in EMSAs (Panel h)) in livers of fed ob/ob mice. Fed obese/diabetic ob/ob mice (presumably well stimulated by marked hyperinsulinaemia therein) were injected IV with adenovirus vector (Vec) or adenovirus encoding KI-PKC-ζ (KI-ζ), and, 5 days later (to allow time for expression), mice were killed and muscles and livers were harvested and processed for indicated analyses. Values are mean ± SEM of (N) mice. Depicted P values show comparisons of indicated groups, viz., virus vector versus virus encoding KI-PKC-ζ, as determined by ANOVA.
It may be noted that IRS-2/PI3K activation, as measured 1-min after insulin administration, is impaired in ob/ob mice (15). However, we presently observed a significant (P<0.05) increase in insulin-stimulated hepatic IRS-2/PI3K activity, viz., from 1.00±0.20 (mean ±SE; N=7) to 1.94±0.23 (mean ±SE; N=9), in ob/ob mice treated 15-min with saline or insulin, respectively; this increase was only 28% less than that seen in lean controls.
Discussion
Findings in GK-diabetic rats and ob/ob mice were in accord with the idea that conserved hepatic aPKC activation was explained by intact or retained IRS-2/PI3K activation, whereas diminished PKB activation was largely explained by impaired IRS-1/PI3K activation. This idea is in accord with above-discussed findings in IRS-1 knockout mice (16,17) and IRS-2-deficient hepatocytes (18), and is further supported by finding diminished hepatic aPKC, but increased PKB, activation in GK-diabetic liver wherein IRS-2 was partially depleted by adenoviral/shRNA treatment. [Also note, in STZ-diabetic rats, insulin activation of PKB and IRS-1/PI3K are markedly impaired, but, in contrast, activation of aPKC and IRS-2/PI3K are fully conserved; unpublished observations; MP Sajan, ML Standaert, RV Farese].
The finding of diminished activation of IRS-1/PI3K, but not IRS-2/PI3K, in GK-diabetic muscle and liver raised the possibility of increased phosphorylation of inhibitory residues specific to IRS-1. In this regard, phosphorylation of serine-307-IRS-1 was increased in GK-diabetic muscle, and, moreover, was reduced by expression of kinase-inactive PKC-ζ or shRNA targeting IRS-2; however, no such changes were observed in GK-diabetic liver. In this regard, phosphorylation of serine-307-IRS-1 is increased by mammalian target of rapamycin and c-Jun NH2-terminal kinase pathways, but further studies are needed to see if changes in these pathways are relevant to findings in GK-diabetic muscle.
Conserved aPKC activation in livers of GK-diabetic rats and ob/ob mice is noteworthy for several reasons. First, aPKC participates in mediating insulin effects on hepatic SREBP-1c expression (5,6), which trans-activates an array of enzymes that promote lipid synthesis, and which is increased in these and other insulin-resistant hyperinsulinemic states, including, lipodystrophic mice (9) and muscle-specific PKC-λ knockout mice (21). Accordingly, it was important to find that inhibition of hepatic aPKC was attended, not only by sizable decreases in expression/activation of hepatic SREPB-1c and FAS in both diabetes models, but also by remarkable improvement in serum triacylglycerol levels in GK-diabetic rats. It may therefore be surmised that hepatic aPKC plays a pivotal role in the pathogenesis of excessive hepatic lipid synthesis and hyperlipidaemia in hyperinsulinaemic forms of diabetes.
Second, conserved ability of insulin to activate aPKC appeared to be largely responsible for excessive IKKβNFκB activation presently observed in diabetic liver. This is particularly important, as NFκB promotes the development of (a) systemic insulin resistance (13,14), and (b) inflammatory responses that may abet thrombotic tendencies in atherosclerotic processes.
Improvements in insulin signalling to IRS-1/PI3K, aPKC and PKB in muscle, and PKB in liver, observed with inhibition of hepatic aPKC in GK-diabetic rats and ob/ob mice, are most likely attributable to improvements in either or both, SREBP-1c-dependent hepatic lipid synthesis and NFκB-dependent cytokine production [both have been linked to systemic insulin resistance (5,13,14,22)]. Although further studies are needed to determine relative contributions of SREBP-1c and NFκB to alterations in insulin signalling in diabetic muscle and liver, the fact that both factors are largely controlled by hepatic aPKC may facilitate development of a therapeutic agent that simultaneously limits excessive and deleterious activities of both factors.
Excessive increases in activities of SREBP-1c and NFκB presently observed in diabetic livers were apparently at least partly due to hyperinsulinaemia acting upon hepatic IRS-2 and aPKC. These increases in insulin action in diabetic liver contrast sharply with decreases in actions mediated through PKB. Stated differently, insulin actions in type 2 diabetic liver may simultaneously be both excessive and deficient. Accordingly, whereas metabolic processes in diabetic liver that are primarily controlled by signalling through IRS-1/2/PI3K and PKB, such as expression of genes that diminish hepatic glucose production and release, are likely to be impaired, those processes largely controlled by signalling through IRS-2, aPKC, SREBP-1c and NFκB, such as hepatic lipid synthesis and cytokine production, may be hyperactive, normoactive, or hypoactive, depending upon circulating insulin levels. This bifurcation of insulin signaing to IRS-2/aPKC (conserved) and IRS-1/PKB (impaired) in liver provides a reasonable explanation for the paradoxical retention of lipid effects and simultaneous loss of carbohydrate effects of insulin/feeding in liver of type 2 diabetic animals (1).
It should be emphasized that, although excessive activation of hepatic aPKC in hyperinsulinaemic diabetic states is in part deleterious, and hepatic aPKC is therefore a reasonable therapeutic target, activation of aPKC is critically needed, both for insulin-stimulated glucose transport in muscle (21) and adipocytes (19), and for glucose-dependent insulin secretion in pancreatic islet β-cells (23). Thus, therapeutically effective aPKC inhibitors must be tailored to selectively inhibit hepatic aPKC. Development of such inhibitors promises to be a daunting, but, if successful, rewarding challenge.
Acknowledgments
Supported by funds from the Department of Veterans Affairs Merit Review Program (R.V.F.), and the National Institutes of Health Research Grants DK-38079 (R.V.F.), and DK-30136 (C.R.K.).
References
- 1.Brown MS, Goldstein JL. Selective versus total insulin resistance; a pathogenic paradox. Cell Metab. 2008;7:95–96. doi: 10.1016/j.cmet.2007.12.009. [DOI] [PubMed] [Google Scholar]
- 2.Standaert ML, Sajan MP, Miura A, et al. Insulin-induced activation of atypical protein kinase C, but not protein kinase B, is maintained in diabetic ob/ob and Goto-Kakizaki liver. Contrasting insulin signaling patterns in liver versus muscle define phenotypes of type 2 diabetic and high fat-induced insulin-resistant states. J Biol Chem. 2004;279:24929–24934. doi: 10.1074/jbc.M402440200. [DOI] [PubMed] [Google Scholar]
- 3.Krook A, Kawano Y, Song XM, Roth RA, Wallberg-Henricksson H, Zierath JR. Improved glucose tolerance restores insulin-stimulated Akt activity and glucose transport in skeletal muscle of diabetic Goto-Kakizaki rats. Diabetes. 1997;46:2110–2114. doi: 10.2337/diab.46.12.2110. [DOI] [PubMed] [Google Scholar]
- 4.Kanoh Y, Bandyopadhyay G, Sajan MP, Standaert ML, Farese RV. Rosiglitazone, insulin treatment and fasting correct defective activation of protein kinase C-ζ/λ by insulin in vastus lateralis muscles and adipocytes of diabetic rats. Endocrinology. 2001;142:1595–1605. doi: 10.1210/endo.142.4.8066. [DOI] [PubMed] [Google Scholar]
- 5.Matsumoto M, Ogawa W, Akimoto K, et al. PKCλ in liver mediates insulin-induced SREBP-1c expression and determines both hepatic lipid content and overall insulin sensitivity. J Clin Invest. 2003;112:935–944. doi: 10.1172/JCI18816. 2003. [DOI] [PMC free article] [PubMed] [Google Scholar]
- 6.Taniguchi CM, Kondo T, Sajan M, et al. Divergent regulation of hepatic glucose and lipid metabolism by phosphoinositide 3-kinase via Akt and PKC-lambda/zeta. Cell Metab. 2006;3:343–353. doi: 10.1016/j.cmet.2006.04.005. [DOI] [PubMed] [Google Scholar]
- 7.Fleischmann M, Iynedjian PB. Regulation of sterol regulatory-element binding protein expression in liver: role of insulin and protein kinase B/Akt. Biochem J. 2000;349:13–17. doi: 10.1042/0264-6021:3490013. [DOI] [PMC free article] [PubMed] [Google Scholar]
- 8.Zhang W, Patil S, Chauhan B, et al. FoxO1 regulates multiple metabolic pathways in the liver. Effects on gluconeogenic, glycolytic and lipogenic gene expression. J Biol Chem. 2006;281:10105–10117. doi: 10.1074/jbc.M600272200. [DOI] [PubMed] [Google Scholar]
- 9.Shimomura I, Matsuda M, Hammer RE, Bashmakov Y, Brown MS, Goldstein JL. Decreased IRS-2 and increased SREBP-1c lead to mixed insulin resistance and sensitivity in livers of lipodystrophic and ob/ob mice. Mol Cell. 2000;6:77–86. [PubMed] [Google Scholar]
- 10.Shimomura I, Bashmakov Y, Ikemoto S, Horton JD, Brown MS, Goldstein JL. Insulin selectively increases SREBP-1c mRNA in the livers of rats with streptozotocin-induced diabetes. Proc Natl Acad Sci USA. 1999;96:13656–13661. doi: 10.1073/pnas.96.24.13656. [DOI] [PMC free article] [PubMed] [Google Scholar]
- 11.Lallena M-J, Diaz-Meco MT, Bren G, Pay CV, Moscat J. Activation of IκB kinaseβ by protein kinase C isoforms. Mol Cell Biol. 1999;19:2180–2188. doi: 10.1128/mcb.19.3.2180. [DOI] [PMC free article] [PubMed] [Google Scholar]
- 12.Duran A, Diaz-Meco MT, Moscat J. Essential role of RelA Ser311 phosphorylation by ζ PKC in NF-κB transcriptional activation. The EMBO J. 2003;22:3910–3918. doi: 10.1093/emboj/cdg370. [DOI] [PMC free article] [PubMed] [Google Scholar]
- 13.Cai D, Yuan M, Frantz DF, et al. Local and systemic insulin resistance resulting from hepatic activation of IKK-beta and NF-kappaB. Nat Med. 2005;11:183–190. doi: 10.1038/nm1166. [DOI] [PMC free article] [PubMed] [Google Scholar]
- 14.Shoelson SE, Herrero L, Naaz A. Obesity, inflammation and insulin resistance. Gastroenterology. 2007;132:2169–2180. doi: 10.1053/j.gastro.2007.03.059. [DOI] [PubMed] [Google Scholar]
- 15.Kerouz NJ, Hörsch D, Pons S, Kahn CR. Differential regulation of insulin receptor substrates-1 and -2 (IRS-1 and IRS-2) and phosphatidylinositol 3-kinase isoforms in liver and muscle of the obese diabetic (ob/ob) mouse. J Clin Invest. 1997;100:3164–3172. doi: 10.1172/JCI119872. [DOI] [PMC free article] [PubMed] [Google Scholar]
- 16.Sajan MP, Standaert ML, Miura A, Farese RV. Tissue-specific differences in activation of atypical protein kinase C and protein kinase B in muscle, liver and adipocytes of insulin receptor substrate-1 knockout mice. Mol Endocrinol. 2004;18:2513–2521. doi: 10.1210/me.2004-0045. [DOI] [PubMed] [Google Scholar]
- 17.Ueki K, Yamauchi T, Tamemoto H, et al. Restored insulin-sensitivity in IRS-1-deficient mice treated by adenovirus-mediated gene therapy. J Clin Invest. 2000;105:1437–1445. doi: 10.1172/JCI7656. [DOI] [PMC free article] [PubMed] [Google Scholar]
- 18.Valverde AM, Burks DJ, Fabregat I, et al. Molecular mechanisms of insulin resistance in IRS-2-deficient hepatocytes. Diabetes. 2003;52:2239–2248. doi: 10.2337/diabetes.52.9.2239. [DOI] [PubMed] [Google Scholar]
- 19.Sajan MP, Rivas J, Li P, Standaert ML, Farese RV. Repletion of atypical protein kinase C following RNA interference-mediated depletion restores insulin-stimulated glucose transport. J Biol Chem. 2006;281:17466–17473. doi: 10.1074/jbc.M510803200. [DOI] [PubMed] [Google Scholar]
- 20.Taniguchi CM, Ueki K, Kahn CR. Complementary roles of IRS-1 and IRS-2 in the hepatic regulation of metabolism. J Clin Invest. 2005;115:718–727. doi: 10.1172/JCI23187. [DOI] [PMC free article] [PubMed] [Google Scholar] [Retracted]
- 21.Farese RV, Sajan MP, Yang H, et al. Muscle-specific knockout of protein Kinase C-λ Impairs Glucose Transport and Induces Metabolic and Diabetic Syndromes. J Clin Invest. 2007;117:2289–2301. doi: 10.1172/JCI31408. [DOI] [PMC free article] [PubMed] [Google Scholar]
- 22.Nagle CA, An J, Shiota M, et al. Hepatic overexpression of glycerol-sn-3-phosphate acyltransferase-1 in rats causes insulin resistance. J Biol Chem. 2007;282:14807–14815. doi: 10.1074/jbc.M611550200. [DOI] [PMC free article] [PubMed] [Google Scholar]
- 23.Hashimoto N, Kido Y, Uchida T, et al. PKClambda regulates glucose-induced insulin secretion through modulation of gene expression in pancreatic beta cells. J Clin Invest. 2005;115:16–20. doi: 10.1172/JCI22232. [DOI] [PMC free article] [PubMed] [Google Scholar]