

Abstract
Protein-based, fluorescent biosensors power basic research on cell signaling in health and disease, but their use in automated laboratories is limited. We have now created two live-cell assays, one for diacyl glycerol and another for cAMP, that are robust (Z′ > 0.7) and easily deployed on standard fluorescence plate readers. We describe the development of these assays, focusing on the parameters that were critical for optimization, in the hopes that the lessons learned can be generalized to the development of new biosensor-based assays.
Keywords: fluorescence, baculovirus, mNeonGreen, GFP, Z′ statistic, live-cell assay, adenylyl cyclase, cAMP, diacyl glycerol, DAG
Introduction
Living cells respond to their environment with intracellular signaling pathways that are tightly regulated in space and time. While this simple truth is obvious and fundamental, we often ignore it for technical reasons. Many assays in use today involve destructive, single-point measurements that lose a great deal of information regarding both when and where signaling took place. To measure cAMP activity, for example, it is common to inhibit the phosphodiesterase, stimulate the system, wait many minutes, and finally homogenize the cells and measure cAMP accumulation.1 The simplification of measuring cAMP accumulation instead of dynamic signaling makes it possible to produce an assay for use in an automated laboratory setting, but this simplification means that we miss where in the cell the cAMP was generated, which can be quite important,2,3 as well as when and for how long this occurred.4
The Fluorescence Imaging Plate Reader (FLIPR) instrument provided new access to kinetic data from living cells through an innovative optical design that made it possible to monitor 96 wells simultaneously over time.5 Coupled with robust Ca2+ dyes, this instrument has become commonplace in many automated laboratories because of the quality of the data it provides and the access to both the amplitude and kinetics of the signaling. While the FLIPR has been a powerful tool when coupled to good fluorescent dyes, there are no dyes for many of the most important second messengers. One way of circumventing this has been to engineer new hybrid proteins and pathways that artificially couple to Ca2+,6 but this simplification inevitably means that the amplitude and kinetics of the normal signaling will be lost.
Genetically encoded, fluorescent sensors constructed with protein domains offer some promising solutions. For virtually every second messenger, there is at least one protein domain that has evolved to bind the messenger at physiologically relevant concentrations. These domains can be fused to fluorescent proteins such that second-messenger binding is converted into changes in fluorescence. There are now examples of excellent sensors for a variety of different second messengers, including Ca2+,7 glutamate,8 cAMP,9,10 and diacyl glycerol (DAG).11 These sensors empower important scientific progress, but to date they have had a very limited impact in automated drug discovery settings.
Our goal was to optimize two biosensors for DAG and cAMP such that they could be deployed in automated laboratory settings and routinely produce Z′ values of 0.7 or better12 on the large installed base of standard fluorescence plate readers. Here we describe the results and the parameters that we found to be critical to producing such assays.
Materials and Methods
Molecular Biology
All of the plasmids were created with a combination of Q5 polymerase-based PCR amplification (NEB, Ipswich, MA) and InFusion cloning (Clontech, Mountain View, CA) as described previously.11 The constructs were initially tested in a custom cytomegalovirus (CMV) expression plasmid fitted with a CMV promoter and polyadenylation sequence. Successful sensor prototypes were sequence verified, and all of the constructs were designed, annotated, and checked with the Gene Construction Kit (Textco, Raleigh, NC) and MacVector software (Cary, NC).
Protein production in Escherichia coli was done by cloning the sequences encoding the sensors in frame with a histidine tag in a constitutive expression plasmid (pCP). Cells were grown for 2 days of growth in Circle Grow (MP biomedicals, Santa Ana, CA), pelleted, and lysed in Bugbuster with Benzonase (EMD Millipore, Billerica, MA). Machery-Nagel protino columns (Macherey-Nagel, Bethlehem, PA) were used to purify the protein, and the eluted protein was extensively dialyzed against 10 mM Tris pH 8 buffer.
Transient Transfections and Live-Cell Microscopy
The sensors were tested and optimized in HEK 293T cells grown in Eagle’s minimum essential medium (EMEM) supplemented with 10% fetal bovine serum (FBS). For transient transfection with plasmids, the cells were plated and grown for 24 h, followed by transient transfection with Lipofectamine 2000 following the manufacturer’s protocol (Life Technologies, Grand Island, NY). Twenty-four to 48 h later, the cells were imaged with an inverted Olympus IX51 microscope fitted with a 20× 0.9 NA objective. Computer-controlled LED illumination was used to intermittently illuminate the cells (Thor Labs, Newton, NJ), a Semrock filter set was used to produce and capture the fluorescence (GFP/DsRed-A-000; Semrock, Rochester, NY), and the fluorescence images were captured with a Qimaging Retiga camera (Surrey, British Columbia, Canada). The FIJI distribution of ImageJ was used for data analysis in conjunction with IGOR (Wavemetrics, Lake Oswego, OR). Background in the image series was defined as the average intensity of a region of interest (ROI) placed over a portion of the image that contained no cells (Fig. 1).
Figure 1.

Examples of single-cell responses are plotted (A) to illustrate the consequences of transient transfection and the relevant parameters. The fluorescence signal is collected over time, from individual, transiently transfected cells expressing an Upward DAG sensor (the 2-D1 prototype) and responding to M1 receptor-driven Gq signaling. The change in fluorescence (ΔF) induced by receptor signaling is important since it is the relevant signal. A good starting assumption is that a larger ΔF makes a better sensor. However, the sensor brightness is also important because it defines the separation between the background fluorescence—from the plate, cells, and media—and the sensor fluorescence. Transient transfection is frequently used to express biosensors into cell lines, and comparing individual cells in such an experiment (B) reveals that there can be more than a 10 times variation in fluorescence intensity from cell to cell. This broad range of expression frequently exceeds the dynamic range of an instrument, and the cells above a certain saturation level become unresponsive fluorescence that lowers the measured ΔF of the population. In addition, the overexpression of the sensor can potentially overwhelm the amount of intracellular second messenger, leading to smaller ΔF.
Baculovirus Packaging
To create baculovirus, we constructed a new donor plasmid, pKay6, that carries a promoter, the biosensor coding sequence, and a polyadenylation signal in a plasmid with Tn7 recombination sites based on the design described by Luckow and colleagues.13 Adjacent to this mammalian expression cassette, we positioned a PH promoter driving insect cell expression of full-length vesicular stomatitis virus glycoprotein (VSVG) to pseudotype the virus for mammalian cell expression.14 Competent E. coli carrying the bacmid (bMON14272) and a helper plasmid (pMON7124) were transformed, and antibiotic selection was used to select for recombinants. PCR with primers complementary to the biosensor and the plasmid carrying the bacmid were used to verify correct insertion of the donor plasmid and bacmid. Bacmid DNA was purified with a PureLink HiPure Plasmid Miniprep Kit (Life Technologies, Carlsbad, CA), and the resulting DNA was used for Sf9 cell transfection. Sf9 cells (Allele Biotechnology, San Diego, CA) were grown in TNM-FH medium (Allele Biotechnology) containing 10% FBS. For transfection with bacmid DNA and P1 baculovirus production, the cells were seeded in 6-well plates and grown for 24 h, followed by transfection with Sapphire Insect Transfection Reagent following the manufacturer’s protocol (Allele Biotechnology). P1 baculovirus was harvested after 5 days and used to infect additional Sf9 cells to generate a high-titer P2 viral stock. Sf9 cells were infected with the P1 stock at a multiplicity of infectivity (MOI) of .05 to .1, and the P2 virus was harvested after 3 days. The infection protocol was repeated with the P2 stock to generate P3.
To establish the number of functional viral particles, we did serial dilutions of the resulting virus and added them to wells of HEK 293T cells. The following day, we counted fluorescent cells with live-cell imaging. While this is only an indirect measurement of the MOI, traditionally measured with plaque assays of the host cells, it is a direct measurement of our objective: heterologous sensor expression in HEK 293T cells.
Fluorescence Plate Reader
The BioTek (Winooski, VT) Synergy Mx fluorescence plate reader was used to characterize the sensors, the baculovirus transduction capabilities, and the agonist profiles of different receptors. HEK 293T cells were seeded at a density of 30,000 cells per well in Greiner Cell Coat 96-well plates (Greiner Bio-One, Monroe, NC). The following day, virus was added directly to the well along with sodium butyrate (final concentration 5 mM). Four hours later, the media were replaced with fresh EMEM containing 2 mM sodium butyrate. The following day, the cells were washed in Dulbecco’s Phosphate Buffered Saline (DPBS) in a BioTek plate washer (BioTek 405TS Microplate Washer). Drugs were added with an electronic multichannel pipette, and fluorescence measurements were made using excitation and emission wavelengths of 488/20 nm and 525//20 nm, respectively.
Results
The literature describing fluorescent biosensors is replete with assertions of better probes that are brighter, deliver a larger signal, are more photo stable, or are better expressed. Faced with developing assays, however, it was not entirely clear which properties were most important in achieving a reliable readout. Figure 1A illustrates the response of an individual HEK 293T cell expressing an Upward DAG sensor in an imaging experiment. The addition of a G-protein-coupled receptor (GPCR) agonist that signals through Gq causes an increase (ΔF) in the fluorescence of the cells over time. The background is defined as the fluorescence produced by the plate, media, and cells alone. One can see in this response that the overall brightness of the cell sets the difference between the autofluorescence and the sensor signal: the brighter the cell, the better the signal-to-noise ratio will be. Another key parameter, however, is the absolute change in fluorescence, ΔF. One can imagine a dim sensor with a large ΔF being better than a bright sensor with a small ΔF. The experiment illustrated in Figure 1 was done by transiently transfecting HEK 293T cells using plasmids and Lipofectamine 2000. Plasmid transfection produces a broad range of fluorescence intensities in the cells: comparison of a few cells in any well reveals that there is more than a 10-fold variation in intensity (Fig. 1B). This variation exceeds the dynamic range of the camera and has several consequences. First, this saturation in an imaging instrument means that the responses of the brightest cells are lost, and they become another source of background fluorescence that lowers the apparent ΔF. Second, very high levels of sensor expression can exceed the amount of analyte within the cell, resulting in less bound sensor and less change in fluorescence, ΔF.
The variability inherent in transient transfections can be overcome with a variety of heterologous expression strategies that introduce a consistent amount of the sensor gene. The creation of stable cell lines or transgenic animals minimizes expression variability, but this is a limited solution since many investigators already have a particular cell line of choice, or they study a different species. Viral delivery, on the other hand, provides a flexible solution that is compatible with many different cell types. Baculovirus is particularly useful because it can be used to drive sensor expression in mammalian cells, if the correct promoters are used, while the remaining viral genome is silent.15 The virus concentration can be easily adjusted, and it carries minimal risks to humans, making it easily used in automated laboratory settings.
Remarkably consistent expression of the Upward DAG2 sensor16 was achieved within wells and across plates using a baculovirus expression system (Table 1). This consistency reduced the variability, significantly improving Z′ from 0.59 in an optimal transient transfection to 0.72 in a baculovirus transduction. Our efforts to improve Z′ by increasing ΔF, however, brought ever diminishing returns. We realized that the solution might be to increase the signal-to-noise ratio by making brighter sensors.
Table 1.
Performance Differences of Upward DAG Sensors Expressed with Transient Transfection of Plasmids or Baculovirus-Mediated Transduction.
| Sensor | Average ΔF/F | Average F | Z′ |
|---|---|---|---|
| Plasmid transfections | |||
| Upward DAG2 | 0.39 | 2166.63 | 0.59 |
| Upward DAG mNeon 1-D6 | 0.31 | 2212.56 | 0.62 |
| Upward DAG mNeon 1-G8 | 0.24 | 4424.69 | 0.65 |
| Upward DAG mNeon 2-D1 | 0.25 | 4942.00 | 0.65 |
| Upward DAG mNeon 1-G7 | 0.28 | 2441.31 | 0.59 |
| Baculovirus transductions | |||
| Upward DAG2 | 0.5 | 0.72 | |
| Upward DAG mNeon 1G8 | 0.48 | 7445.50 | 0.80 |
| Upward DAG mNeon 2D1 | 0.45 | 6050.38 | 0.79 |
For the plasmid-based expression, the sensor and the M1 receptor were coexpressed by mixing two plasmids. For baculovirus transduction, two different viruses were mixed. The data were acquired with HEK 293T cells activated by addition of carbachol (50 µM final concentration). Upward DAG2 is a sensor described previously, while mNeonGreen Upward DAG sensors are prototypes developed with the mNeonGreen fluorescent protein. The experiments done with the plasmid transfections were measured with a slightly higher gain than those with the baculovirus, so the increased brightness in the baculovirus experiments is a slight underestimate of the improvement baculovirus produces (n = 16 for each measurement).
The Upward DAG2 sensor16 was based on a circularly permuted Aequoria green fluorescent protein (GFP). A new fluorescent protein, mNeonGreen,17 is 2.7-fold brighter than enhanced GFP (eGFP). However, the primary sequence is so different from the Aequoria protein that we had to build and test hundreds of constructs to find a circularly permuted version of mNeonGreen that would successfully signal in a manner similar to the Aequoria-based sensor. The responses of four Upward DAG, mNeonGreen-based sensors are presented in Table 1 along with the original Upward DAG2 sensor. In plasmid transfections, the Gq-driven increase in fluorescence varied between 24% and 31% on the plate reader, measuring whole-well fluorescence, and the average initial fluorescence varied ~2-fold. Carbachol stimulation of the coexpressed M1 receptor revealed that while the prototypes 1-GB and 2-D1 produced a smaller ΔF than the other prototypes or the original Upward DAG2, their increased initial brightness compensated for this by increasing the signal-to-noise (S/N) ratio and producing the best Z′ of 0.65. When these two prototypes were then expressed by baculovirus transduction, variability in expression was reduced and there was an additional increase in the Z′ to 0.8. The 1G8 prototype was chosen as Upward DAG3.
We created both Upward and Downward versions of the mNeonGreen DAG sensors and moved the best of these into baculovirus. Baculovirus expression can be titrated by adjusting the amount of virus added to the well. We tested a range of expression levels with the Downward DAG3 sensor to determine the relationship between viral dose and (1) total fluorescence, (2) change in fluorescence in response to Gq activation, and (3) Z′ statistic (Fig. 2). As the viral dose was increased from 1 to 60 µL, there was a monoexponential rise in total fluorescence. However, above this, the fluorescence began to fall, potentially due to toxicity at these very high virus concentrations. Surprisingly, the response of the sensor was maximal at low viral concentrations and fell off slowly as viral concentrations were increased. This is consistent with a model in which the sensor concentration exceeds the analyte: as sensor expression increases, the cells become brighter, but the change in the fluorescence decreases because less of the sensor is bound to the small pool of available DAG. Since different cell lines are likely to have different concentrations of DAG in their membrane and different amounts of membrane, it is quite likely that the viral dose/Z′ relationships should be quantified when this assay is moved to a different cell type.
Figure 2.

The Z′ performance of the Downward DAG3 sensor as a function of baculovirus concentration in HEK 293T cells. Systematically varying the baculovirus added to each well makes it possible to explore the relationship between sensor expression, total fluorescence, fluorescence change, and Z′. In the case of the Downward DAG3 sensor, the addition of virus from 1 to 60 µL produced a monoexponential rise in the total fluorescence in each well. As the sensor fluorescence rises, however, there is a concomitant drop in the ΔF. Accordingly, there is an assay window ranging from 5 to 35 µL of virus that produces an optimum Z′ of greater than 0.8, and additional virus degrades the assay performance.
Optimization of a New cAMP Assay
Cyclic AMP is an essential second messenger used for many important cellular processes. There are now many examples of how the messages carried by cAMP are tightly regulated within cells. Transient changes in cAMP levels carry important information,4 and these changes often occur within small, subcellular microdomains.2,3,18 Different levels of cAMP appear to activate different subsequent effectors that have different affinities for the second messenger. In short, when, where, and how much cAMP is produced are important factors that mediate the physiology of the cell. A number of FRET-based cAMP sensors have been used in basic research laboratories,19 but the signal-to-noise ratios of these sensors20 are quite small and remarkably difficult to detect on fluorescence plate readers.
To create a bright fluorescent sensor for cAMP, we positioned a circularly permuted green fluorescent protein in the hinge region of a guanine nucleotide exchange factor EPAC 221 (Fig. 3A). The catalytic and regulatory regions of EPAC are interconnected by a hinge, and cAMP binding to the regulatory region causes a large conformational change in EPAC 2 in which the relative positions of the catalytic and regulatory regions are rearranged with a twisting of the hinge.21 We tested hundreds of prototypes that varied the position of the fluorescent protein as well as the composition of the small linkers that interconnected EPAC 2 and fluorescent protein domains. Two sensors were recovered that produced bright fluorescence and significant changes in fluorescence. One increased fluorescence in response to Gs signaling; the other decreased fluorescence, much like the responses of the original Upward and Downward DAG sensors.11 The downward sensor produced the most robust response (Fig. 3B) and was named the cAMP Difference Detector in situ (cADDis).
Figure 3.
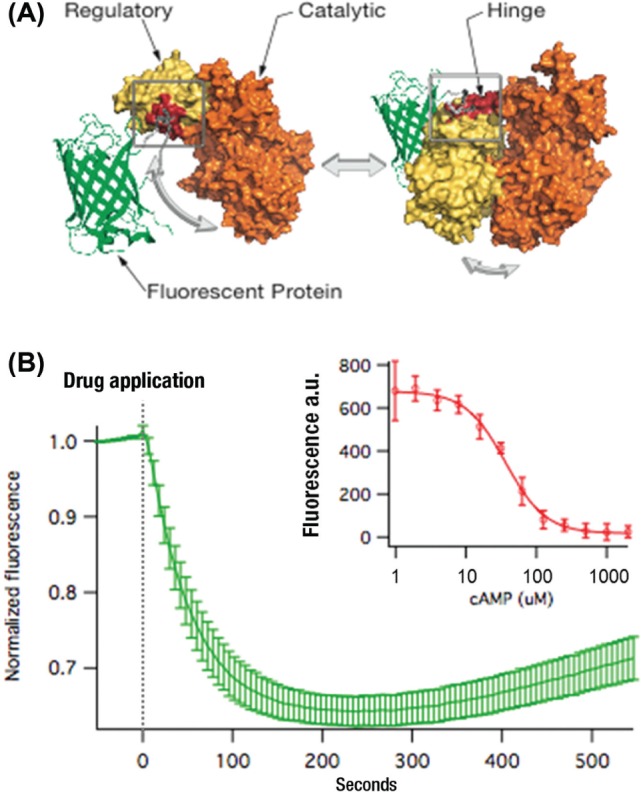
Creating the cAMP Difference Detector in situ (cADDis). To create a bright sensor based on a single fluorescent protein, we positioned a circularly permuted green fluorescent protein (GFP) in between the catalytic and enzymatic domains of EPAC. The concept driving the design is cartooned in (A), where the EPAC 2 structure is combined with the β barrel of a GFP. Iterations of design, build, and test resulted in an optimized sensor with a ~35% drop in fluorescence in response to receptor-stimulated Gs signaling. This is illustrated as the mean response of 25 adjacent cells in a well, imaged with a microscope, and each cell is normalized to the initial fluorescence (B). The cAMP sensitivity of the cADDis sensor was determined by purifying the sensor protein and measuring the fluorescence of the sensor in different concentrations of free cAMP (inset). Like other EPAC-based sensors, the sensitivity is optimal at cAMP concentrations between 10 and 100 µM.
To test the sensitivity of cADDis, we purified the protein and measured the cAMP concentration-fluorescence relationship on a fluorescence plate reader. The sensor sensitivity is quite similar to other EPAC-based biosensors as well as the cAMP affinity of EPAC (Fig. 3B). The sensor was then moved into baculovirus, which produced a very even and consistent pattern of expression much like the DAG sensor. NECA (5′-N-ethylcarboxamidoadenosine) application to activate the endogenous adenosine receptor had an EC50 of 426 nM, which is consistent with the values reported using other assays, and isoproterenol stimulation of endogenous β-adrenergic receptors produced an EC50 of 3.5 nM. To test the human dopamine receptor, the cells were first transfected with a plasmid carrying the D1 receptor and then transduced with the cADDis baculovirus 24 h later. This hybrid approach worked well, and the EC50 was 2.9 nM (Fig. 4).
Figure 4.

The cAMP Difference Detector in situ (cADDis) sensor responses, in a 96-well assay, to several standard receptors, including the D1 dopamine receptor (A), the endogenous adenosine receptor (B), and the endogenous β-adrenergic receptor (C), produced EC50 values consistent with the literature. The cADDis sensor showed little sensitivity to DMSO (D). Addition of DMSO alone, at final concentrations of up to 5%, resulted in a barely detectable increase in fluorescence (red), while the subsequent addition of isoproteronol produced a consistent ~35% ΔF (green), which was a decrease in fluorescence because this is a downward going sensor.
We used isoproterenol stimulation of the endogenous β-adrenergic receptor to explore the relationship between levels of cADDis expression, sensor responses (ΔF), and the assay Z′ (Fig. 5). Increasing amounts of virus produced a monoexponential rise in total fluorescence, much like the DAG sensor, but the ΔF remained remarkably constant while the cells got brighter and brighter. A plausible explanation for this is that cAMP concentrations within the stimulated cells exceed the amount of sensor present even at high levels of sensor expression. The result is a large assay window with Z′ >0.75 obtained over a wide range of virus concentrations.
Figure 5.

cAMP Difference Detector in situ (cADDis) performance in baculovirus. Increasing amounts of baculovirus led to monoexponentially increasing amounts of total fluorescence in each well. Above 20 µL per well, this increase in fluorescence had little effect on the receptor-driven ΔF, which plateaued at ~50%, which led to a remarkably large assay window of 20 to 80 µL of virus and a Z′ of 0.75 to 0.85.
Discussion
This process of optimizing fluorescent DAG and cAMP assays was instructive, and the results should be useful for the creation of additional assays with other fluorescent biosensors or in other cell types. Baculovirus transduction was a significant improvement in terms of producing consistent expression levels that could be easily adjusted. Indeed, the ease with which expression levels can be adjusted suggests that it would be useful to optimize the viral dose before any new series of large-scale experiments with new receptors and/or new cell types.
In the case of the DAG sensor, the largest signal ΔF, and best Z′, came from the lowest levels of readily detectable sensor expression. As the sensor level increased, the ΔF gradually fell off as though the amount of DAG was limiting. On the contrary, the cAMP sensor change in fluorescence remained constant through a large range of expression levels, which seems to be due to very large amounts of cAMP in these cells. In the case of both sensors, there was a reasonably large window of virus concentrations that provided good Z′ values, but the absolute optimum will most likely vary between cell types with different enzyme isoforms.
Creating genetically encoded biosensors is an arduous, iterative process of designing and testing many different prototypes. Frequently, the focus is on creating sensors with the largest possible ΔF because this is easily measured and somewhat intuitive. This inevitably means that as the sensors evolve, the selection pressure will be for larger changes. Our results with the DAG sensor, however, indicate that solely focusing on the magnitude of the fluorescence change (ΔF) might be counterproductive: while the sensor created with mNeonGreen had a marginally smaller change in fluorescence, the probe was so much brighter that it produced a significantly better Z′ on an automated plate reader, presumably due to a better S/N ratio.
There are now several cAMP assays, including the one described here, that involve genetically encoded sensors and living cells. Each has strengths and weaknesses. Recently, a fluorescence resonance energy transfer (FRET)–based cAMP sensor was overexpressed, with a β-adrenergic receptor, in a stable cell line to produce a high-throughput screening (HTS) compatible assay.22 Robust expression of the sensor in the context of a stable cell line had much the same effect as baculovirus: the increase in brightness, and cell-to-cell consistency, was enough to produce a reasonable Z′ even though the absolute change in FRET was fairly small. Additional overexpression of the receptor appears to have increased the signal, and there is a remarkable long-lived response (~10 h). The downside of the assay as described, however, is that it involves creating new stable cell lines for each receptor assay, and overexpression could introduce artifacts. A different group used baculovirus expression of a FRET-based cAMP sensor, and they saw many of the benefits we report here, with a Z′ of >0.6.23 FRET-based sensors, however, typically produce fairly small (10%–20%) changes in fluorescence that have to be monitored in both the donor and acceptor emission channels.
The most commonly used genetically encoded assay for cAMP incorporates the Glo sensor, which creatively couples a cAMP binding domain to complementing fragments of luciferase.24 Because this assay employs a luminescent enzyme reaction, it is quite sensitive and has little background. The Glo sensor assay, however, involves transient transfection, which may be inefficient in certain cell types, is difficult to multiplex with other biosensor systems, and relies on enzymes that can be inhibited by some compounds.25 Another live-cell assay involves introducing a cAMP-gated ion channel.26 This has been successfully used in HTS,27 although it is an indirect measurement of cAMP levels by channels that can be modulated by other second messengers.
The cAMP sensor reported here offers new opportunities for studying cAMP signaling in living cells. The assay performance is robust, as shown by the Z′ of 0.75 or greater. However, the real benefits of this sort of live-cell assay have yet to be realized. Our assay experiments were done with a standard fluorescent plate reader and two measurements. On an imaging plate reader such as the FLIPR, it would be possible to capture the real kinetics of the response, which is likely to vary from one cell type to another due to the complexity of adenylyl cyclases and phosphodiesterases. Furthermore, because the sensor is green, it can be paired with red Ca2+ sensors for multiplex recordings,16 and this could be quite important when Ca2+-sensitive adenylyl cyclases are present.4,28,29 It can also be combined with either the red PIP2 sensor16 or red DAG sensor to discriminate between Gq and Gs signaling events or quantify agonist bias.30 Finally, since this biosensor is a protein, with no additional components, it should be possible to target it to subcellular domains to interrogate localized cAMP concentrations. One can imagine a time in the near future when screens can be done for compounds that cause very specific signaling that is restricted in both space and time.
Acknowledgments
The authors thank Dr. Catherine Berlot for advice and feedback on the nature of G-protein signaling and Kelsey March for constructing plasmid components of the baculovirus. Paul Held from BioTek offered excellent advice and access to new instruments, and Robert Duvoisin offered guidance in preparing the manuscript.
Footnotes
Declaration of Conflicting Interests: The authors declared no potential conflicts of interest with respect to the research, authorship, and/or publication of this article.
Funding: The authors disclosed receipt of the following financial support for the research, authorship, and/or publication of this article: This work was supported by the National Science Foundation (NSF SBIR IIP-1430878) and National Institute of Neurological Disorders and Stroke (R44 NS082222).
References
- 1. Williams C. cAMP Detection Methods in HTS: Selecting the Best from the Rest. Nat Rev Drug Discov 2004, 3, 125–135. [DOI] [PubMed] [Google Scholar]
- 2. Ballinger M. N., Welliver T., Straight S., et al. Transient Increase in Cyclic AMP Localized to Macrophage Phagosomes. PLoS ONE 2010, 5, e13962. [DOI] [PMC free article] [PubMed] [Google Scholar]
- 3. Zaccolo M., Pozzan T. Discrete Microdomains with High Concentration of cAMP in Stimulated Rat Neonatal Cardiac Myocytes. Science 2002, 295, 1711–1715. [DOI] [PubMed] [Google Scholar]
- 4. Landa L. R., Harbeck M., Kaihara K., et al. Interplay of Ca2+ and cAMP Signaling in the Insulin-Secreting MIN6-Cell Line. J. Biol. Chem. 2005, 280, 31294–31302. [DOI] [PMC free article] [PubMed] [Google Scholar]
- 5. Schroeder K. S. FLIPR: A New Instrument for Accurate, High Throughput Optical Screening. J. Biomol. Screen. 1996, 1, 75–80. [Google Scholar]
- 6. Conklin B. R., Farfel Z., Lustig K. D., et al. Substitution of Three Amino Acids Switches Receptor Specificity of Gqα to That of Giα. Nature 1993, 363, 274–276. [DOI] [PubMed] [Google Scholar]
- 7. Akerboom J., Chen T.-W., Wardill T. J., et al. Optimization of a GCaMP Calcium Indicator for Neural Activity Imaging. J. Neurosci. 2012, 32, 13819–13840. [DOI] [PMC free article] [PubMed] [Google Scholar]
- 8. Marvin J. S., Borghuis B. G., Tian L., et al. An Optimized Fluorescent Probe for Visualizing Glutamate Neurotransmission. Nat. Methods 2013, 10, 162–170. [DOI] [PMC free article] [PubMed] [Google Scholar]
- 9. Ponsioen B., Zhao J., Riedl J., et al. Detecting cAMP-Induced Epac Activation by Fluorescence Resonance Energy Transfer: Epac as a Novel cAMP Indicator. EMBO Rep. 2004, 5, 1176–1180. [DOI] [PMC free article] [PubMed] [Google Scholar]
- 10. Odaka H., Arai S., Inoue T., et al. Genetically-Encoded Yellow Fluorescent cAMP Indicator with an Expanded Dynamic Range for Dual-Color Imaging. PLoS ONE 2014, 9, e100252–e100257. [DOI] [PMC free article] [PubMed] [Google Scholar]
- 11. Tewson P., Westenberg M., Zhao Y., et al. Simultaneous Detection of Ca2+ and Diacylglycerol Signaling in Living Cells. PLoS ONE 2012, 7, e42791. [DOI] [PMC free article] [PubMed] [Google Scholar]
- 12. Zhang J., Chung T., Oldenburg K. A Simple Statistical Parameter for Use in Evaluation and Validation of High Throughput Screening Assays. J. Biomol. Screen. 1999, 4, 67–73. [DOI] [PubMed] [Google Scholar]
- 13. Luckow V. A., Lee S. C., Barry G. F., et al. Efficient Generation of Infectious Recombinant Baculoviruses by Site-Specific Transposon-Mediated Insertion of Foreign Genes Into a Baculovirus Genome Propagated in Escherichia coli. J. Virol. 1993, 67, 4566–4579. [DOI] [PMC free article] [PubMed] [Google Scholar]
- 14. Barsoum J., Brown R., McKee M., et al. Efficient Transduction of Mammalian Cells by a Recombinant Baculovirus Having the Vesicular Stomatitis Virus G Glycoprotein. Hum. Gene Ther. 1997, 8, 2011–2018. [DOI] [PubMed] [Google Scholar]
- 15. Boyce F. M., Bucher N. L. Baculovirus-Mediated Gene Transfer into Mammalian Cells. Proc. Natl. Acad. Sci. 1996, 93, 2348–2352. [DOI] [PMC free article] [PubMed] [Google Scholar]
- 16. Tewson P. H., Quinn A. M., Hughes T. E. A Multiplexed Fluorescent Assay for Independent Second-Messenger Systems: Decoding GPCR Activation in Living Cells. J. Biomol. Screen. 2013, 18, 797–806. [DOI] [PMC free article] [PubMed] [Google Scholar]
- 17. Shaner N. C., Lambert G. G., Chammas A., et al. A Bright Monomeric Green Fluorescent Protein Derived from Branchiostoma Lanceolatum. Nat. Methods 2013, 10, 407–409. [DOI] [PMC free article] [PubMed] [Google Scholar]
- 18. Agarwal S. R., MacDougall D. A., Tyser R., et al. Effects of Cholesterol Depletion on Compartmentalized cAMP Responses in Adult Cardiac Myocytes. J. Mol. Cell. Cardiol. 2011, 50, 500–509. [DOI] [PMC free article] [PubMed] [Google Scholar]
- 19. Willoughby D., Cooper D. M. F. Live-Cell Imaging of cAMP Dynamics. Nat. Methods 2008, 5, 29–36. [DOI] [PubMed] [Google Scholar]
- 20. Woehler A., Wlodarczyk J., Neher E. Signal/Noise Analysis of FRET-Based Sensors. Biophys. J. 2010, 99, 2344–2354. [DOI] [PMC free article] [PubMed] [Google Scholar]
- 21. Rehmann H., Arias-Palomo E., Hadders M. A., et al. Structure of Epac2 in Complex with a Cyclic AMP Analogue and RAP1B. Nature 2008, 455, 124–127. [DOI] [PubMed] [Google Scholar]
- 22. Vedel L., Bräuner-Osborne H., Mathiesen J. M. A cAMP Biosensor-Based High-Throughput Screening Assay for Identification of Gs-Coupled GPCR Ligands and Phosphodie-sterase Inhibitors. J. Biomol. Screen. 2015, 20, 849–857. [DOI] [PubMed] [Google Scholar]
- 23. Mazina O., Reinart-Okugbeni R., Kopanchuk S., et al. BacMam System for FRET-Based cAMP Sensor Expression in Studies of Melanocortin MC1 Receptor Activation. J. Biomol. Screen. 2012, 17, 1096–1101. [DOI] [PubMed] [Google Scholar]
- 24. Binkowski B. F., Butler B. L., Stecha P. F., et al. A Luminescent Biosensor with Increased Dynamic Range for Intracellular cAMP. ACS Chem. Biol. 2011, 6, 1193–1197. [DOI] [PubMed] [Google Scholar]
- 25. Auld D. S., Southall N. T., Jadhav A., et al. Characterization of Chemical Libraries for Luciferase Inhibitory Activity. J. Med. Chem. 2008, 51, 2372–2386. [DOI] [PubMed] [Google Scholar]
- 26. Reinscheid R. K., Kim J., Zeng J., et al. High-Throughput Real-Time Monitoring of G S-Coupled Receptor Activation in Intact Cells Using Cyclic Nucleotide-Gated Channels. Eur. J. Pharmacol. 2003, 478, 27–34. [DOI] [PubMed] [Google Scholar]
- 27. Titus S., Neumann S., Zheng W., et al. Quantitative High-Throughput Screening Using a Live-Cell cAMP Assay Identifies Small-Molecule Agonists of the TSH Receptor. J. Biomol. Screen. 2008, 13, 120–127. [DOI] [PMC free article] [PubMed] [Google Scholar]
- 28. Gorbunova Y. V., Spitzer N. C. Dynamic Interactions of Cyclic AMP Transients and Spontaneous Ca(2+) Spikes. Nature 2002, 418, 93–96. [DOI] [PubMed] [Google Scholar]
- 29. Ni Q., Ganesan A., Aye-Han N.-N., et al. Signaling Diversity of PKA Achieved via a Ca2+-cAMP-PKA Oscillatory Circuit. Nat. Chem. Biol. 2010, 7, 34–40. [DOI] [PMC free article] [PubMed] [Google Scholar]
- 30. Rajagopal S., Rajagopal K., Lefkowitz R. J. Teaching Old Receptors New Tricks: Biasing Seven-Transmembrane Receptors. Nat. Rev. Drug Discov. 2010, 9, 373–386. [DOI] [PMC free article] [PubMed] [Google Scholar]