

Abstract
Context
Due to the limitations of single-center studies in achieving appropriate sampling with relatively rare disorders, multicenter collaborations have been proposed to achieve desired sampling levels. However, documented reliability of biomechanical data is necessary for multicenter injury-prevention studies and is currently unavailable.
Objective
To measure the reliability of 3-dimensional (3D) biomechanical waveforms from kinetic and kinematic variables during a single-leg landing (SLL) performed at 3 separate testing facilities.
Design
Multicenter reliability study.
Setting
3 laboratories.
Patients
25 female junior varsity and varsity high school volleyball players who visited each facility over a 1-mo period.
Intervention
Subjects were instrumented with 43 reflective markers to record 3D motion as they performed SLLs. During the SLL the athlete balanced on 1 leg, dropped down off of a 31-cm-high box, and landed on the same leg. Kinematic and kinetic data from both legs were processed from 2 trials across the 3 laboratories.
Main Outcome Measures
Coefficients of multiple correlations (CMC) were used to statistically compare each joint angle and moment waveform for the first 500 ms of landing.
Results
Average CMC for lower-extremity sagittal-plane motion was excellent between laboratories (hip .98, knee .95, ankle .99). Average CMC for lower-extremity frontal-plane motion was also excellent between laboratories (hip .98, knee .80, ankle .93). Kinetic waveforms were repeatable in each plane of rotation (3-center mean CMC ≥.71), while knee sagittal-plane moments were the most consistent measure across sites (3-center mean CMC ≥.94).
Conclusions
CMC waveform comparisons were similar relative to the joint measured to previously published reports of between-sessions reliability of sagittal- and frontal-plane biomechanics performed at a single institution. Continued research is needed to further standardize technology and methods to help ensure that highly reliable results can be achieved with multicenter biomechanical screening models.
Keywords: ACL reinjury, screening for injury risk, multi-institution research, biomechanics of rehabilitation
Anterior cruciate ligament (ACL) injuries occur more frequently in adolescent and college female athletes than in their male counterparts in the sports of soccer and basketball.1,2 Those who suffer an ACL injury usually experience physical impairments such as effusion, pain, and decreased range of motion in the knee joint.3 Because of these impairments and the resulting loss of normal knee function, individuals with ACL injury often elect to undergo surgery to reconstruct the injured ligament.3 However, ACL-reconstruction (ACLR) surgery is not without secondary complications. For instance, a recent study reported that 11% of the reconstructed ACL grafts did not last longer than 15 years.4 Moreover, nearly one-third of athletes who return to their preinjury sporting activity will succumb to a second ACL injury, 30% within the first 20 athletic exposures.5,6 In addition, recent longitudinal studies reported a high incidence of premature osteoarthritis in those who experienced an ACL injury and underwent reconstructive surgeries.7,8
One of the commonly implemented return-to-sport guidelines after ACLR includes serial testing of muscle-strength symmetry, single-limb hop and landing performance, and patient-reported outcome measures.9–12 Specifically, landing patterns during drop-landing tasks (both single- and double-leg) can discriminate between athletes who have undergone ACLR relative to uninjured peers.5,13–15 While strength symmetry and patient perception of function add important information to the clinical picture of each athlete, single-leg hopping and landing tests effectively assess dynamic knee function before return to sport by quantifying dynamic limb-performance asymmetries. These tests may also have utility in identifying aberrant movement mechanics associated with risk of second ACL injury.16,17 These tests are easily implemented in clinical settings and commonly used to determine unilateral joint function and identify residual neuromuscular deficits (eg, side-to-side asymmetries) in patients after ACLR.14–16 The single-leg landing test (SLL) is commonly used in a clinical setting, requires far less space than traditional hop testing, lends itself to easy video recording in a clinical environment, and may provide a better opportunity to assess the quality of movement that may be lacking in traditional models of functional testing.13,18,19
To examine the effectiveness of the traditional return-to-play guidelines and emergent evidence-based methods that can identify residual deficits in patients after ACLR, there is a need to compile extensive data (ie, determine the relevant criteria), as well as large numbers of study participants, to identify predictors of secondary injury risk. The recruitment of large samples of athletes post-ACLR to prospectively capture secondary ACL injury incidence is challenging in a single-site study. To overcome this limitation, collaborative studies between multiple research laboratories are needed to collect increased sample sizes and evaluate the generalizability of clinical interventions. The current project was conducted by multiple investigators across 3 institutions to examine reliability of the SLL, a test often used in ACLR-outcomes research in the same group of female high school athletes. The purpose of this project was to determine the reliability and consistency of measures collected on the SLL using 3-dimensional (3D) motion analysis across 3 different institutions.
Methods
Participants
Twenty-five female junior varsity and varsity high school volleyball players participated in this study. All participants were tested as a group at each testing site (Figure 1) on separate dates within a 1-month period. Only 12 participants (mean ± SD age 15.34 ± 0.6 y, height 1.69 ± 3.9 m, weight 58.36 ± 6.0 kg) were included in our analysis due to gaps in 3D motion data collected on some participants at the secondary and tertiary research sites.
Figure 1.

Presentation of a single subject performing the single-leg landing task at each of the biomechanical laboratories. (I) Landing phase used for analysis, (II) prehop stance and (III) the athlete preparing for the hop off the box.
SLL Task
Participants performed 3 SLL maneuvers from a 31-cm-high box (Figure 2). Participants were instructed to align either their left or right foot on the corresponding tape mark on the platform. They were then instructed to balance on the foot that was aligned on the tape by picking up the opposite foot. Once in this position, they were instructed to hop off the box, land on that the same foot, and hold the landing for a minimum of 2 seconds. The order in which limbs were tested during the SLL was randomized for each subject.
Figure 2.

Temporal depiction of the single-leg landing task.
Verbal Instructions and Common Errors
Standardized instructions were delivered to each participant: “Line up with your (right/left) foot on the tape, toes on the edge of the box, and pick your (right/left) foot up.” Most participants easily followed the given instructions appropriately. Once the participant was in the proper position, the next instructions were, “Hop off of the box, land on the same foot you are standing on, and hold the landing for 2 seconds.” On landing, the participant held that single-leg position for an audible 2-count by the experimenter. The most common errors included hitting the box with the opposite foot during the landing, touching down with the opposite foot to gain balance, using the nonstance foot on the box to stabilize, touching the ground with either hand, or coming out of the landing position in less than 2 seconds. If any of these errors occurred, the trial was eliminated and repeated.
Data Collection
The investigators at secondary and tertiary sites were responsible for instrumenting each participant with the forty-three 9-mm retroreflective markers. Investigators from the lead institution provided detailed instructions to researchers at the other sites regarding marker placement and data-collection methods (Figure 3). Markers were placed on the C7, sternum, sacrum, and left offset and bilaterally on the shoulders, upper arms, elbows, wrists, anterosuperior iliac spines, greater trochanters, midthighs, medial and lateral femoral condyles, tibial tubercles, distal and lateral shanks, and medial and lateral malleoli. Participants wore a standardized shoe (Supernova Glide 2, Adidas) with markers embedded at the heel, the dorsal surface of the midfoot, posterolateral foot, and toe (between the second and third metatarsals). Participants also wore a small, securely fitted backpack outfitted with 3 noncollinearly placed markers to capture upper-trunk (thorax) motion.
Figure 3.
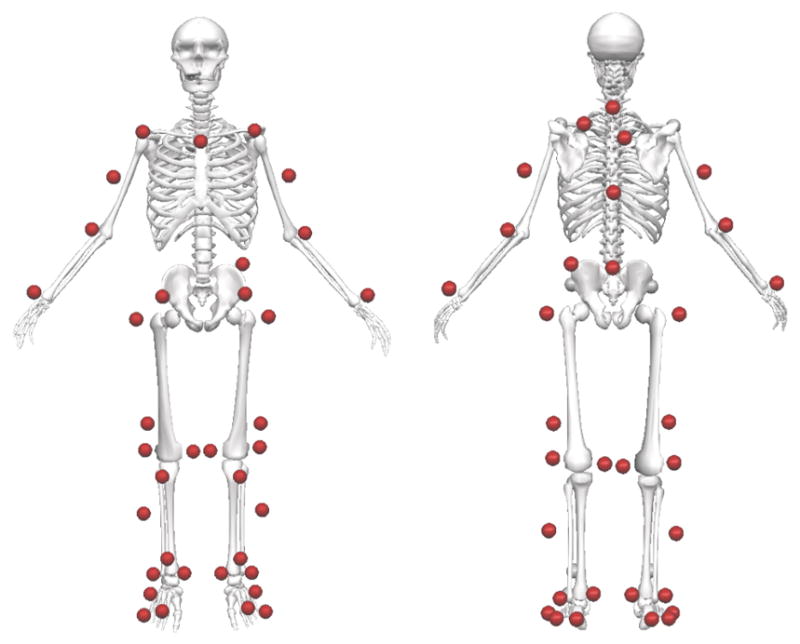
Pictorial depiction of the marker set used for 3-dimensional motion capture at each site.
All 3 sites used similar equipment and sampling frequencies for 3D motion capture. Motion data at the first testing site were collected at 240 Hz using a 10-camera motion-capture system (Eagle, Motion Analysis Corp, Santa Rosa, CA) and embedded force plates (AMTI, Watertown, MA) recording at 1200 Hz. Motion data at the second testing site were collected at 200 Hz using an 18-camera motion-capture system (Eagle, Motion Analysis Corp, Santa Rosa, CA) and force plates embedded in a split-belt treadmill (Bertec, Columbus OH) recording at 1200 Hz. Motion data at the third testing site were collected at 240 Hz using an 8-camera motion-capture system (Vicon, Oxford, United Kingdom) and embedded force plates (Bertec, Columbus, OH) recording at 1200 Hz (Table 1).
Table 1.
3-Dimensional Motion-Capture Equipment at Each Testing Site
| Site I | Site II | Site III | |
|---|---|---|---|
| Motion | |||
| number of cameras | 10 | 18 | 8 |
| manufacturer | Motion Analysis | Motion Analysis | Vicon |
| motion-sampling rate | 240 Hz | 200 Hz | 240 Hz |
| Force | |||
| number of force platforms | 2 | 2 | 2 |
| manufacturer | AMTI | Bertec | Bertec |
| force-sampling rate | 1200 Hz | 1200 Hz | 1200 Hz |
Marker trajectories for the lower extremity, as well as landing kinetics, were collected using previously published kinematic and kinetic motion-analysis techniques.20–22 A static trial was initially collected in which the participant was instructed to stand in a neutral position with foot placement standardized to the laboratory’s coordinate system.
Motion Capture Postprocessing
Standardization of the postprocessing methods was used to improve consistency in data handling. All motion-capture data were inspected to identify any gaps in marker trajectories. Gaps in marker-trajectory data that were less than or equal to 10% of the capture frequency (ie, ≤24 frames for sites 1 and 3, ≤20 frames for site 2) were filled using a cubic-spline join function. Trials were deemed “good” if there were no gaps in marker-position data greater than 10% of the capture frequency for the particular markers that were required to track the motion of the lower extremities. Marker trajectories and force data were filtered using a low-pass fourth-order Butterworth filter at a cutoff frequency of 12 Hz. Lower-extremity joint angles and moments were calculated by a single investigator (B.D.R.) using the same custom Visual3D (C-Motion, Inc, Germantown, MD) pipeline scripts on each site’s data set.22 Kinematic and kinetic data during the landing phase of the movement were averaged between 2 good trials (both limbs required) of each movement at each site and normalized to 101 data points using the same custom Matlab scripts (Mathworks, Natick, MA) applied to each site’s data. If all 3 trials were deemed “good” for a given participant, only the first 2 were used in each analysis. The landing phase was defined as the first 500 milliseconds after initial contact with the force plate. Initial contact was defined as the time at which the vertical ground-reaction force exceeded 10 N.
Statistical Analysis
For each participant, the mean of successful trials was used to calculate the total range-of-motion and vertical ground-reaction-force values for each investigative site. For each participant, the total range of motion for the hip, knee, and ankle was determined in each plane. Total range of motion was determined as the difference in joint angles from initial contact with the force plate to the point where the subject’s center of mass reached its lowest point. Peak values were determined during the landing phase. Discrete variables for hip, knee, and ankle kinematics and kinetics were reported in sagittal, frontal, and transverse planes, and waveforms were used to calculate reliability and total error individually for the right and left legs. Coefficients of multiple correlation (CMCs) were used to calculate kinetic and kinematic waveform reliability during the landing phase of the SLL.23 CMCs measured to be ≥.6 and <.9 are generally designated as good, and CMCs ≥.9 are reported as excellent.23 Typical errors were also calculated between sessions using methods outlined by Hopkins24 and were reported in degrees for kinematic variables and Newton-meters per kilogram for kinetic variables. All calculations were performed in Matlab using custom processing code.
Results
Group means for peak values, range of motion, and waveforms for kinematics and kinetics observed at the hip, knee, and ankle at each center during an SLL are documented in Table 2 and Figures 4 and 5. The between-centers waveform reliability for kinematic values in the sagittal plane was quite repeatable—mean CMCs across all 3 centers exceeded .87 for each joint (Table 3, Figure 4). The frontal plane was also reliable at the hip and the knee (3-center mean CMCs >.73). In the sagittal plane, CMC reliability decreased while moving proximally along the kinematic chain. The opposite pattern was true in the frontal plane, where the hip exhibited the most reliable kinematic waveform between centers. Hip and knee kinematics were the least reliable in the transverse plane (3-center mean CMCs .56–.80). At each joint, typical errors between centers exhibited larger magnitudes in the frontal plane than in the sagittal and transverse planes.
Table 2.
Peak Values and Range of Motion Recorded for Kinematic (Joint-Angle) and Kinetic (Joint-Moment) Variables During a Single-Leg Landing Performed at Each Testing Center (I, II, and III)
| Left Leg
|
Right Leg
|
|||||||||||
|---|---|---|---|---|---|---|---|---|---|---|---|---|
| Peak
|
Range of motion
|
Peak
|
Range of motion
|
|||||||||
| I | II | III | I | II | III | I | II | III | I | II | III | |
| Kinematic (°) | ||||||||||||
| hip-flexion angle | 61.2 (6.4) | 54.5 (16.5) | 54.0 (3.7) | 34.4 (4.2) | 30.4 (11.1) | 28.0 (7.3) | 60.0 (4.9) | 51.3 (17.8) | 54.1 (4.2) | 35.4 (5.0) | 28.2 (9.9) | 29.4 (5.8) |
| hip-adduction angle | 10.7 (4.9) | 10.7 (5.6) | 10.6 (4.8) | 20.8 (4.9) | 21.5 (8.7) | 20.1 (5.6) | 12.2 (4.5) | 13.8 (7.1) | 11.4 (3.4) | 21.8 (5.0) | 23.6 (9.4) | 21.2 (5.8) |
| hip internal angle | −3.4 (3.3) | −3.1 (5.6) | −3.4 (8.2) | 10.6 (3.4) | 10.0 (4.3) | 11.8 (3.1) | −6.0 (2.8) | −6.6 (6.9) | −5.6 (6.4) | 10.0 (2.8) | 12.4 (4.6) | 12.9 (3.6) |
| knee-flexion angle | −71.3 (5.5) | −68.4 (7.5) | −64.7 (6.3) | 56.7 (6.2) | 51.7 (7.3) | 49.1 (7.6) | −71.5 (8.2) | −67.5 (10.4) | −65.0 (12.0) | 59.1 (7.6) | 53.0 (7.7) | 51.9 (6.9) |
| knee-abduction angle | −8.8 (3.3) | −8.3 (5.9) | −9.1 (6.2) | 7.9 (2.6) | 8.8 (3.7) | 9.5 (3.6) | −9.5 (3.8) | −12.5 (4.8) | −9.8 (4.1) | 7.7 (2.2) | 11.8 (3.6) | 9.5 (2.3) |
| knee internal angle | 7.4 (5.4) | 10.7 (3.2) | 10.1 (6.5) | 12.9 (3.2) | 15.0 (3.6) | 15.4 (3.6) | 4.2 (3.4) | 8.5 (4.4) | 5.2 (15.6) | 12.8 (2.7) | 13.7 (3.0) | 14.3 (3.2) |
| ankle-dorsiflexion angle | 23.3 (3.1) | 20.2 (4.1) | 20.7 (4.0) | 55.8 (6.8) | 47.8 (6.4) | 51.1 (5.7) | 24.2 (4.6) | 21.4 (5.9) | 20.9 (14.1) | 57.0 (6.2) | 49.6 (7.0) | 52.1 (5.8) |
| ankle-eversion angle | −10.0 (2.3) | −11.5 (2.2) | −12.6 (2.5) | 10.1 (2.9) | 9.4 (2.0) | 10.3 (2.9) | −9.3 (2.6) | −11.3 (2.0) | −11.6 (5.8) | 11.1 (3.1) | 10.9 (3.9) | 11.2 (2.4) |
| Kinetic (N·m) | ||||||||||||
| hip-flexion moment | 120.7 (19.4) | 117.8 (39.5) | 99.5 (26.9) | 103.2 (25.1) | 145.8 (54.0) | 137.5 (30.7) | 110.8 (23.0) | 97.5 (36.6) | 100.9 (17.7) | 100.8 (24.8) | 143.0 (51.0) | 133.4 (18.7) |
| hip-adduction moment | 97.7 (16.2) | 84.6 (32.0) | 103.1 (13.5) | 105.4 (20.5) | 104.7 (38.6) | 112.7 (20.9) | 107.5 (21.1) | 97.8 (35.2) | 106.5 (17.4) | 108.3 (21.7) | 120.2 (44.3) | 124.5 (27.4) |
| hip internal moment | 43.5 (9.3) | 44.7 (14.6) | 33.6 (9.7) | 42.0 (11.7) | 49.1 (23.6) | 46.7 (16.9) | 46.3 (9.0) | 35.5 (14.8) | 33.3 (8.3) | 44.9 (10.8) | 46.2 (20.9) | 46.9 (12.6) |
| knee-flexion moment | −150.2 (22.5) | −161.1 (39.7) | −159.1 (28.5) | 170.7 (27.7) | 184.0 (34.6) | 164.2 (37.8) | −150.5 (20.4) | −162.6 (24.7) | −167.4 (30.7) | 173.6 (29.9) | 181.3 (35.8) | 178.1 (36.0) |
| knee-abduction moment | −14.0 (7.9) | −14.0 (9.4) | −17.4 (13.8) | 45.6 (15.6) | 48.7 (15.8) | 50.4 (11.9) | −7.7 (8.4) | −18.0 (11.0) | −16.1 (8.0) | 46.0 (13.0) | 54.4 (14.7) | 50.2 (13.5) |
| knee internal moment | 1.5 (2.6) | 2.9 (4.4) | −1.8 (3.8) | 36.6 (5.9) | 34.0 (7.2) | 33.1 (7.7) | 0.9 (2.0) | −0.7 (2.8) | −2.6 (2.2) | 37.7 (7.4) | 35.6 (5.9) | 35.5 (5.9) |
| ankle-dorsiflexion moment | 129.5 (11.6) | 121.5 (20.8) | 144.3 (18.4) | 124.8 (22.9) | 113.5 (17.1) | 179.5 (34.1) | 138.0 (19.2) | 120.2 (26.2) | 139.9 (26.1) | 126.2 (23.7) | 116.1 (21.6) | 158.7 (24.3) |
| ankle-eversion moment | −29.3 (12.1) | −34.9 (15.1) | −27.7 (12.2) | 42.9 (9.7) | 35.9 (6.8) | 38.0 (9.2) | −32.6 (12.6) | −30.7 (16.3) | −28.4 (8.9) | 49.5 (10.3) | 34.1 (8.8) | 38.4 (10.1) |
Figure 4.

Mean kinematics for both sides of the single-leg landing from 0 to 500 ms after initial contact with the force plate, normalized to 101 data points for 3 institutions. The shaded area represents the standard error of the mean.
Figure 5.

Mean kinetics for both sides of the single-leg landing from 0 to 500 ms after initial contact with the force plate, normalized to 101 data points for 3 institutions. The shaded area represents the standard error of the mean.
Table 3.
Between-Centers Coefficient of Multiple Correlations (CMC) and Typical Error (TE) for Kinematic (Joint-Angle) and Kinetic (Joint-Moment) Variables Calculated for the Left and Right Limbs at All Combinations of Testing Centers
| All 3 Centers
|
I Versus II
|
I Versus III
|
II Versus III
|
|||||
|---|---|---|---|---|---|---|---|---|
| CMC | TE | CMC | TE | CMC | TE | CMC | TE | |
| Left Leg | ||||||||
| Joint angles (°) | ||||||||
| hip flexion | .915 | 9.49 | .879 | 12.07 | .792 | 4.86 | .821 | 11.55 |
| hip adduction | .876 | 4.43 | .897 | 5.44 | .846 | 3.72 | .905 | 4.12 |
| hip internal | .556 | 3.58 | .661 | 3.60 | .487 | 3.78 | .799 | 3.36 |
| knee flexion | .945 | 7.14 | .917 | 7.84 | .905 | 6.12 | .904 | 7.47 |
| knee abduction | .730 | 2.30 | .676 | 2.34 | .584 | 2.46 | .821 | 2.10 |
| knee internal | .797 | 3.32 | .634 | 3.05 | .638 | 2.73 | .591 | 4.18 |
| ankle dorsiflexion | .971 | 3.10 | .948 | 3.36 | .973 | 2.93 | .972 | 3.02 |
| ankle eversion | .613 | 1.71 | .734 | 1.60 | .524 | 1.81 | .517 | 1.71 |
| Joint moments (N·m) | ||||||||
| hip flexion | .820 | 28.10 | .743 | 31.28 | .823 | 21.11 | .714 | 31.91 |
| hip adduction | .810 | 22.83 | .754 | 27.81 | .809 | 13.43 | .857 | 27.25 |
| hip internal | .828 | 11.38 | .756 | 12.81 | .698 | 7.43 | .712 | 13.89 |
| knee flexion | .943 | 14.48 | .917 | 12.17 | .883 | 17.07 | .918 | 14.20 |
| knee abduction | .726 | 7.72 | .636 | 7.38 | .598 | 7.88 | .599 | 7.89 |
| knee internal | .804 | 3.00 | .756 | 2.72 | .767 | 3.39 | .741 | 2.88 |
| ankle dorsiflexion | .913 | 11.38 | .838 | 11.63 | .876 | 1.54 | .870 | 11.97 |
| ankle eversion | .843 | 5.93 | .844 | 5.26 | .749 | 6.32 | .703 | 6.21 |
| Right Leg | ||||||||
| Joint angles (°) | ||||||||
| hip flexion | .896 | 9.77 | .825 | 12.51 | .847 | 4.58 | .889 | 12.22 |
| hip adduction | .895 | 4.83 | .898 | 5.19 | .895 | 4.04 | .873 | 5.25 |
| hip internal | .686 | 2.81 | .525 | 3.10 | .519 | 2.73 | .628 | 2.60 |
| knee flexion | .939 | 6.47 | .898 | 7.38 | .913 | 5.57 | .938 | 6.46 |
| knee abduction | .732 | 2.17 | .779 | 2.19 | .739 | 2.11 | .672 | 2.22 |
| knee internal | .629 | 2.61 | .650 | 2.18 | .641 | 2.43 | .648 | 3.22 |
| ankle dorsiflexion | .972 | 3.40 | .952 | 3.72 | .966 | 2.95 | .963 | 3.52 |
| ankle eversion | .633 | 1.85 | .514 | 1.70 | .621 | 1.63 | .603 | 2.22 |
| Joint moments (N·m) | ||||||||
| hip flexion | .750 | 21.69 | .689 | 23.45 | .695 | 15.10 | .728 | 26.53 |
| hip adduction | .867 | 24.48 | .826 | 3.17 | .876 | 17.01 | .869 | 26.26 |
| hip internal | .808 | 9.55 | .760 | 11.28 | .642 | 7.78 | .784 | 9.61 |
| knee flexion | .954 | 15.94 | .932 | 11.79 | .898 | 14.99 | .939 | 21.04 |
| knee abduction | .712 | 7.41 | .582 | 7.10 | .623 | 7.93 | .740 | 7.20 |
| knee internal | .904 | 3.50 | .864 | 2.05 | .803 | 4.42 | .777 | 4.03 |
| ankle dorsiflexion | .849 | 12.11 | .826 | 12.82 | .820 | 12.86 | .783 | 10.66 |
| ankle eversion | .862 | 5.73 | .806 | 5.24 | .747 | 5.82 | .692 | 6.14 |
Kinetic waveforms were repeatable in each plane of rotation, as the mean CMCs across all 3 centers exceeded .71 for each joint (Table 3, Figure 5). Knee-flexion moments were consistently the most reliable waveforms (3-center mean CMCs .94 and .95), while knee-abduction moments were the least reliable waveforms (3-center mean CMCs .73 and .71). CMC reliability did not consistently increase or decrease in any plane of motion when moving between joints either proximally or distally along the kinetic chain. Waveform reliability calculated across all 3 centers was comparable between sides, but there were greater differences in side-to-side variability when comparing between individual centers. Typical errors for between-centers kinetics were 2.05 to 31.91 N·m. The largest errors were found in the sagittal plane at each joint and in hip adduction, and these errors correspond to the specific joint coordinate-system plane of motion (sagittal, frontal, transverse) where the maximum joint moment was greater than 100 N·m.
Discussion
The between-centers kinematic reliability of an SLL task performed by identical participants in this study compares favorably with previous literature that examined between-sessions CMCs from a drop-vertical-jump task.21 Historically, the landing phase of drop vertical jump or single-leg hop for distance has been used to assess risk of ACL injury and reinjury, as well as neuromuscular control, due to its high levels of reliability and repeatability.5,14,25–28 The SLL task performed in the current study exhibited waveform reliability similar to that of the drop vertical jump, as evidenced by CMCs.21 Comparable levels of reliability between the SLL and drop vertical jump indicate that each task can similarly be used to assess kinematic and kinetic differences in performance. Therefore, the presented reliability of the SLL task indicates the potential value of its incorporation in a functional assessment battery of return-to-sport criteria in multicenter research. Single-leg tasks are useful for return-to-sport testing after ACLR and may also reveal deficits in neuromuscular control that cannot be identified in a double-leg task. In addition, the SLL adds to the functional assessment battery to further evaluate isolated limb symmetry, which is fundamentally different than the drop vertical jump and may help identify risk factors in athletes aiming to return to sport after ACLR. Even more promising, the between-centers frontal-plane values for the SLL demonstrated greater reliability at the hip (.89 vs .70) and knee (.72 vs .65) than previously reported drop-vertical-jump values.21 This is likely due in part to the increased range of motion at the hip in the frontal plane during this task compared with the drop vertical jump. This is important, as increased frontal-plane knee rotation, which is influenced by hip motion, has been prospectively linked with ACL injury.26 Likewise, increased frontal-plane excursion is considered a risk factor for second ACL injury.5 As participants exhibited greater frontal-plane reliability during the SLL than the drop vertical jump, the SLL may be implemented as a supportive screening tool for the assessment of these primary and secondary knee-injury risk factors.
The SLL task demonstrated moderate to good waveform reliability between all 3 testing centers. When the current data are normalized similar to the previously reported notation of N·m/kg, the range of between-centers typical error was 0.04 to 0.53 N·m/kg. The reliability reported between centers here with the SLL task exceeds values that were previously recorded in single-site between-sessions drop-vertical-jump tasks typically used for injury-screening methods.21 The reported difference may be because the SLL places greater physical demand on the subject, as only 1 leg is used to support the landing, despite the fact that both the drop vertical jump and SLL task are performed from the same height.25 Landing on a single leg produces greater magnitudes of ground-reaction force than for each individual leg in a dual-leg landing,20,21,29 and both variability and error in motion tend to increase when larger forces are generated during landing.30 Therefore, even as both tasks exhibited comparable waveform reliability, it is reasonable to expect that the typical error observed during this SLL task was greater than that of previously reported drop vertical jumps.21
The peak hip- and knee-flexion moments reported by all 3 centers exceeded those previously reported from a drop-vertical-jump task (−96.5 to −114.0 N·m) that was performed by a similar population cohort from the same height.31,32 The larger flexion torque observed during the SLL was expected, as a drop vertical jump involves landing on 2 legs, while in the SLL task, only 1 leg is supporting the body. Despite this difference, the peak knee-abduction torques reported by all 3 centers during the SLL task were less than or equivalent to the peak torques reported in either leg of a drop-vertical-jump landing (−13.3 to −17.8 N·m).31,32 In a cohort of male subjects with an average mass of 63.9 kg who performed single-leg landings from a 40-cm hanging fall, the mean peak hip- and knee-flexion moments were found to be approximately −60.1 to −79.2 N·m, while peak knee abduction was found to be approximately −35.1 N·m.33 These data exhibited lower flexion torques and greater frontal-plane knee torques than the current study. However, these differences may be attributed to a change in task (9-cm greater drop height) and change in filtering frequency (10 Hz) relative to the current investigation.
Previous multicenter reliability studies of 3D gait analysis have resulted in conflicting results.34,35 For example, 12 motion-analysis laboratories assessed 1 participant over a 3-month period.35 After the implementation of a standardized set of motion-analysis protocols that the staff at each laboratory were instructed and trained to use, the variability between most dependent factors was improved. This highlights the challenges of multicenter studies and the importance of standardized protocols and detailed descriptions of marker-placement methodology. The 3D motion-analysis techniques should have high reliability within and between testing sessions, as previous reports in clinical gait analyses have indicated acceptable reliability in multiple populations and cohorts23,36–39 For example, in a recent systematic review most errors in gait analysis were within acceptable limits.36 Details regarding the magnitude of typical error between testing sessions are critical to data interpretation and clinical application. Transverse- and frontal-plane kinematic errors should be closely examined as they are generally larger than measures in the sagittal plane.36
Similar reliability results are found in more dynamic, athletic movements that are typically used for injury-risk assessment. Examination of a drop vertical jump21 and a stop-jump landing40 found that several sagittal-plane kinematic and kinetic variables had higher reliability than frontal- and transverse-plane variables. Higher reliability was also found within sessions than between sessions during landing and running trials,21,41,42 and factors that may lead to increased variability during repeated motion-analysis tests include marker-placement errors, referenced static alignment, task difficulty, and neuromuscular development of the population. In single-center investigations, it is common to reduce marker-placement errors by using 1 well-trained investigator to apply all reflective markers, especially in longitudinal research studies and repeated clinical tests.21 Likewise, in multicenter studies, a well-trained, experienced investigator designated for this role at each test is also preferable. In the current investigation the primary investigator involved in marker placement provided training to each site investigator who applied markers. This onsite training approach that helped standardize method and marker placement was considered a strength of the current study and should be considered during future multicenter investigations.
The effects of intralaboratory intersession and inter-rater variability on the repeatability and reliability of walking,23,43 jogging,44,45 and drop-vertical-jump tasks21 have been largely attributed to small variations in marker placement,23,41 task complexity, and changes in neuromuscular development that may occur when testing an adolescent population over an extended period of time. Several controls can be implemented to reduce these confounding factors. Marker placement performed by a single, trained investigator may limit errors associated with marker placement.46 Similarly, standardized task instructions and appropriate feedback from a trained investigator to ensure patient compliance with testing instructions can be implemented to minimize variability that may obfuscate true changes in the outcome measure of interest. The test–retest reliability of a drop vertical jump over a 7-week time period showed that peak kinematic and kinetic variables can be collected with acceptable levels of variability when measured within a single site. These data were measured with a single rater at a single institution,21 the findings of which cannot be directly translated to a multi-institution study design.
Additional sources of variance may be observed when extending biomechanical screening studies across multiple institutions. The use of different 3D motion-capture hardware and embedded force plates at multiple sites is an example. However, the variability in peak kinematic variables measured by different motion-capture equipment may be a negligible source of error when compared with the aforementioned sources of variability that are introduced when performing intersession biomechanical data collections. One study investigated the reliability of 2 motion-capture systems simultaneously recording the same drop-vertical-jump task.47 Peak lower-extremity kinematic variables demonstrated excellent reliability (ICC .999 for peak knee flexion, .844 for peak knee abduction; CMC in all planes >.999), indicating that although some variability exists between motion-capture technologies, they may be overcome by instituting replicable methods such as the implementation of standard operating procedures for the preparation and analysis of motion capture and proper task execution by the subject.47
The choice of postprocessing techniques can influence the biomechanical values that are computed and may have particular implications for the ability to reliably screen an athlete for injury risk. The choice of cutoff frequency for low-pass filtering marker-coordinate and ground-reaction-force data can significantly influence the computed peak knee-abduction moment during a run-cut maneuver.48 Roewer et al48,49 noted a similar effect on the peak knee-abduction moment computed during a drop vertical jump but indicated that the choice of marker-coordinate and ground-reaction-force low-pass filtering cutoff frequencies did not significantly affect the order of athletes when they were ranked based on peak knee-abduction moment. These findings underscore the importance of establishing uniform data-processing techniques across institutions. Failure to do so could result in an athlete being identified as at risk for injury when tested at 1 location yet not identified as at risk if they had been screened at a different location using different data-processing techniques.
To establish the reliability of the SLL is critical not only for multicenter prospective biomechanical studies but also for the implementation of rigorous procedures for intervention studies. As evidence mounts that greater frontal-plane knee-abduction angles are linked to non-contact ACL tears and the risk of secondary injury, more attention is devoted to the development of treatments to mitigate this risk.50–52 The advent of the ability to provide real-time feedback on 3D angles provides a powerful tool to train athletes to avoid high-risk knee positions. Kinematic-feedback training alone can alter mechanics, and these alterations can be maintained for at least 1 month after training.53 A limited but growing body of research suggests that kinematic-feedback training may be advantageous to those at risk for an ACL tear, as well.54,55 However, Dempsey et al55 recently showed that, despite 6 weeks of such training, there was a limited effect of improved knee mechanics. While these studies provide valuable insights, they did not focus on adolescent female athletes and did not provide feedback directly on the knee-abduction angle, the reliability of their measurements, or have a follow-up period to assess retention of the new landing mechanics.50,51 Thus, additional study is needed to determine the feasibility of using the same technology to alter landing mechanics in adolescent females at risk for tearing their ACL. Ultimately, such research will require large-scale multisite clinical trials to assess the long-term effect in the reduction in ACL-tear risk. Favorable results for reliability of data-collection techniques demonstrated in the current study serve as a necessary first step before such an ambitious undertaking.
Furthermore, the findings here support the idea that the reliability of the SLL in the frontal and sagittal planes is good across multiple institutions. This particular task is viable due to its reliability and ability to assess an athlete’s return-to-play status after an ACL injury by determining the athlete’s ability to perform a single-leg task. The SLL is a movement that is similar in demand to that of sport-specific movements often performed during play and competition; therefore, it allows clinicians to assess an athlete’s neuromuscular control and side-to-side asymmetries.
Limitations
The most notable limitation to the current data set is the loss of data from study participants who experienced marker dropout during the testing. Specifically, only 12 participants were included in our final analysis due to gaps in 3D motion data collected on some participants at the tertiary research site. Unfortunately, the loss of data was not identified at the time of testing to allow for onsite rectification of marker dropout. Future approaches that employ real-time tracking of each marker with model template approaches will help overcome this limitation between the research sites. Model templates, which are motion-system-dependent and identify markers in real time, can give feedback to the research team about the general quality of each trial and specifically if critical markers are being occluded during important time periods of task execution. If markers are occluded that are necessary for the calculation of joint centers, kinematic and kinetic data cannot be obtained for the time period in which the occlusion occurs. Thus, real-time model template tracking of markers indicates to the research team that they need to collect additional trials if it is observed that markers were occluded during a trial.
While the onsite training was considered a strength to the current report, multicenter data will always be limited by potential differences in marker placement and methods used between the investigative sites. In addition, differences in sampling frequencies of the 3D-motion cameras between sites may have also affected the reliability of the data across each site. However, if the sample rates for marker and force data are high enough not to alias the signal, then filtering those data at a rate of 12 Hz will eliminate all the higher-frequency noise that is captured above that frequency. Therefore, the overall implication is that different sampling frequencies likely had minimal impact on the current study’s results.
Conclusions
The current work is a stepping-stone to establishing a multisite data-collection warehouse that can provide the subject numbers truly needed to study a rare phenomenon such as the ACL injury and associated risk factors. The current results indicate that the SLL task has good reliability in the sagittal and frontal planes, and this is comparable to or better than previous multicenter reports. In addition, the SLL may be a viable task for multicenter study of functional outcomes in ACLR because of the reported reliability, and it replicates sports-specific demands while identifying neuromuscular asymmetries in ACLR populations.13 As noted, multicenter collaborations for prospective, longitudinal studies provide a powerful alternative to address limitations of single-center studies. Documented reliability of 3D data is necessary for multicenter injury-prevention studies. While there are clear benefits to large-scale, multicenter studies, there remain some inherent obstacles. Specifically, the current investigation noted that good communication among investigators is necessary, especially to maintain protocol-administration fidelity. Unfortunately, even with standardized methods, it is inevitable that multicenter testing will lead to increased variability across measures. However, a small decrease in reliability is counterbalanced by increased generalizability and the wealth of information that is able to be gathered—data that would be nearly impossible to obtain otherwise. The current findings indicate that techniques used during the SLL task provide reliable measures that may benefit future large-scale multicenter clinical trials aimed to prevent second ACL injury.
Acknowledgments
Institutional review board approval was granted by Cincinnati Children’s Hospital Medical Center, The Ohio State University, and the University of Kentucky.
The authors would like to acknowledge funding support from National Institutes of Health Grants R01-AR055563 and R21-AR065068. The authors would like to thank the Mason School Volleyball Program, especially Head Coach Tiann Myer and the Mason School Athletic Director Scott Stemple, for their participation in this study.
Footnotes
There is no potential conflict of interest with any authors on this project. Specifically, there are no financial relationships with any manufacturers, including, but not limited to, grants, honoraria, consulting fees, royalty fees, ownership, or support in preparation of the manuscript.
Contributor Information
Gregory D. Myer, Sports Medicine Biodynamics Center, Cincinnati Children’s Hospital Medical Center, Cincinnati, OH
Nathaniel A. Bates, Sports Health & Performance Inst, The Ohio State University, Columbus, OH
Christopher A. DiCesare, Sports Medicine Biodynamics Center, Cincinnati Children’s Hospital Medical Center, Cincinnati, OH
Kim D. Barber Foss, Sports Medicine Biodynamics Center, Cincinnati Children’s Hospital Medical Center, Cincinnati, OH
Staci M. Thomas, Sports Medicine Biodynamics Center, Cincinnati Children’s Hospital Medical Center, Cincinnati, OH
Samuel C. Wordeman, Sports Health & Performance Inst, The Ohio State University, Columbus, OH
Dai Sugimoto, Sports Medicine Biodynamics Center, Cincinnati Children’s Hospital Medical Center, Cincinnati, OH.
Benjamin D. Roewer, Sports Health & Performance Inst, The Ohio State University, Columbus, OH
Jennifer M. Medina McKeon, Div of Physical Therapy, University of Kentucky, Lexington, KY
Stephanie L. Di Stasi, Sports Health & Performance Inst, The Ohio State University, Columbus, OH
Brian W. Noehren, Div of Physical Therapy, University of Kentucky, Lexington, KY
Michael McNally, Sports Health & Performance Inst, The Ohio State University, Columbus, OH.
Kevin R. Ford, Dept of Physical Therapy, High Point University, High Point, NC
Adam W. Kiefer, Sports Medicine Biodynamics Center, Cincinnati Children’s Hospital Medical Center, Cincinnati, OH
Timothy E. Hewett, Sports Health & Performance Inst, The Ohio State University, Columbus, OH
References
- 1.Arendt E, Dick R. Knee injury patterns among men and women in collegiate basketball and soccer. NCAA data and review of literature. Am J Sports Med. 1995;23(6):694–701. doi: 10.1177/036354659502300611. [DOI] [PubMed] [Google Scholar]
- 2.Joseph AM, Collins CL, Henke NM, Yard EE, Fields SK, Comstock RD. A multisport epidemiologic comparison of anterior cruciate ligament injuries in high school athletics. J Athl Train. 2013;48(6):810–817. doi: 10.4085/1062-6050-48.6.03. [DOI] [PMC free article] [PubMed] [Google Scholar]
- 3.Cimino F, Volk BS, Setter D. Anterior cruciate ligament injury: diagnosis, management, and prevention. Am Fam Physician. 2010;82(8):917–922. [PubMed] [Google Scholar]
- 4.Bourke HE, Salmon LJ, Waller A, Patterson V, Pinczewski LA. Survival of the anterior cruciate ligament graft and the contralateral ACL at a minimum of 15 years. Am J Sports Med. 2012;40(9):1985–1992. doi: 10.1177/0363546512454414. [DOI] [PubMed] [Google Scholar]
- 5.Paterno MV, Schmitt LC, Ford KR, et al. Biomechanical measures during landing and postural stability predict second anterior cruciate ligament injury after anterior cruciate ligament reconstruction and return to sport. Am J Sports Med. 2010;38(10):1968–1978. doi: 10.1177/0363546510376053. [DOI] [PMC free article] [PubMed] [Google Scholar]
- 6.Webster KE, Feller JA, Leigh WB, Richmond AK. Younger patients are at increased risk for graft rupture and contralateral injury after anterior cruciate ligament reconstruction. Am J Sports Med. 2014;42(3):641–647. doi: 10.1177/0363546513517540. [DOI] [PubMed] [Google Scholar]
- 7.Oiestad BE, Holm I, Aune AK, et al. Knee function and prevalence of knee osteoarthritis after anterior cruciate ligament reconstruction: a prospective study with 10 to 15 years of follow-up. Am J Sports Med. 2010;38(11):2201–2210. doi: 10.1177/0363546510373876. [DOI] [PubMed] [Google Scholar]
- 8.Oiestad BE, Holm I, Engebretsen L, Risberg MA. The association between radiographic knee osteoarthritis and knee symptoms, function and quality of life 10–15 years after anterior cruciate ligament reconstruction. Br J Sports Med. 2011;45(7):583–588. doi: 10.1136/bjsm.2010.073130. [DOI] [PubMed] [Google Scholar]
- 9.Ortiz A, Olson S, Trudelle-Jackson E, Rosario M, Venegas HL. Landing mechanics during side hopping and crossover hopping maneuvers in noninjured women and women with anterior cruciate ligament reconstruction. PM R. 2011;3(1):13–20. doi: 10.1016/j.pmrj.2010.10.018. [DOI] [PMC free article] [PubMed] [Google Scholar]
- 10.Myer GD, Paterno MV, Ford KR, Quatman CE, Hewett TE. Rehabilitation after anterior cruciate ligament reconstruction: criteria-based progression through the return-to-sport phase. J Orthop Sports Phys Ther. 2006;36(6):385–402. doi: 10.2519/jospt.2006.2222. [DOI] [PubMed] [Google Scholar]
- 11.Adams D, Logerstedt DS, Hunter-Giordano A, Axe MJ, Snyder-Mackler L. Current concepts for anterior cruciate ligament reconstruction: a criterion-based rehabilitation progression. J Orthop Sports Phys Ther. 2012;42(7):601–614. doi: 10.2519/jospt.2012.3871. [DOI] [PMC free article] [PubMed] [Google Scholar]
- 12.Di Stasi S, Myer GD, Hewett TE. Neuromuscular training to target deficits associated with second anterior cruciate ligament injury. J Orthop Sports Phys Ther. 2013;43(11):777–792. A1–A11. doi: 10.2519/jospt.2013.4693. [DOI] [PMC free article] [PubMed] [Google Scholar]
- 13.Ortiz A, Olson S, Libby CL, et al. Landing mechanics between noninjured women and women with anterior cruciate ligament reconstruction during 2 jump tasks. Am J Sports Med. 2008;36(1):149–157. doi: 10.1177/0363546507307758. [DOI] [PMC free article] [PubMed] [Google Scholar]
- 14.Myer GD, Schmitt LC, Brent JL, et al. Utilization of modified NFL Combine testing to identify functional deficits in athletes following ACL reconstruction. J Orthop Sports Phys Ther. 2011;41(6):377–387. doi: 10.2519/jospt.2011.3547. [DOI] [PMC free article] [PubMed] [Google Scholar]
- 15.Myer GD, Martin L, Jr, Ford KR, et al. No association of time from surgery with functional deficits in athletes after anterior cruciate ligament reconstruction: evidence for objective return-to-sport criteria. Am J Sports Med. 2012;40(10):2256–2263. doi: 10.1177/0363546512454656. [DOI] [PMC free article] [PubMed] [Google Scholar]
- 16.Logerstedt DS, Snyder-Mackler L, Ritter RC, et al. Knee stability and movement coordination impairments: knee ligament sprain: clinical practice guidelines linked to the international classification of functioning, disability, and health from the Orthopaedic Section of the American Physical Therapy Association. J Orthop Sports Phys Ther. 2010;40(4):A1–A37. doi: 10.2519/jospt.2010.0303. [DOI] [PMC free article] [PubMed] [Google Scholar]
- 17.Schmitt LC, Paterno MV, Hewett TE. The impact of quadriceps femoris strength asymmetry on functional performance at return to sport following anterior cruciate ligament reconstruction. J Orthop Sports Phys Ther. 2012;42(9):750–759. doi: 10.2519/jospt.2012.4194. [DOI] [PMC free article] [PubMed] [Google Scholar]
- 18.Stensrud S, Myklebust G, Kristianslund E, Bahr R, Krosshaug T. Correlation between two-dimensional video analysis and subjective assessment in evaluating knee control among elite female team handball players [published online ahead of print] Br J Sports Med. 2010 doi: 10.1136/bjsm.2010.078287. [DOI] [PubMed] [Google Scholar]
- 19.Kagaya Y, Fujii Y, Nishizono H. Association between hip abductor function, rear-foot dynamic alignment, and dynamic knee valgus during single-leg squats and drop landings [published online ahead of print] J Sport Health Sci. 2013 doi: 10.1016/j.jshs.2013.08.002. [DOI] [Google Scholar]
- 20.Ford KR, Myer GD, Smith RL, Vianello RM, Seiwert SL, Hewett TE. A comparison of dynamic coronal plane excursion between matched male and female athletes when performing single leg landings. Clin Biomech (Bristol, Avon) 2006;21(1):33–40. doi: 10.1016/j.clinbiomech.2005.08.010. [DOI] [PubMed] [Google Scholar]
- 21.Ford KR, Myer GD, Hewett TE. Reliability of landing 3D motion analysis: implications for longitudinal analyses. Med Sci Sports Exerc. 2007;39(11):2021–2028. doi: 10.1249/mss.0b013e318149332d. [DOI] [PubMed] [Google Scholar]
- 22.Ford KR, Shapiro R, Myer GD, Van Den Bogert AJ, Hewett TE. Longitudinal sex differences during landing in knee abduction in young athletes. Med Sci Sports Exerc. 2010;42(10):1923–1931. doi: 10.1249/MSS.0b013e3181dc99b1. [DOI] [PMC free article] [PubMed] [Google Scholar]
- 23.Kadaba MP, Ramakrishnan HK, Wootten ME, Gainey J, Gorton G, Cochran GV. Repeatability of kinematic, kinetic, and electromyographic data in normal adult gait. J Orthop Res. 1989;7(6):849–860. doi: 10.1002/jor.1100070611. [DOI] [PubMed] [Google Scholar]
- 24.Hopkins WG. Measures of reliability in sports medicine and science. Sports Med. 2000;30(1):1–15. doi: 10.2165/00007256-200030010-00001. [DOI] [PubMed] [Google Scholar]
- 25.Ford KR, Myer GD, Hewett TE. Valgus knee motion during landing in high school female and male basketball players. Med Sci Sports Exerc. 2003;35(10):1745–1750. doi: 10.1249/01.MSS.0000089346.85744.D9. [DOI] [PubMed] [Google Scholar]
- 26.Hewett TE, Myer GD, Ford KR, et al. Biomechanical measures of neuromuscular control and valgus loading of the knee predict anterior cruciate ligament injury risk in female athletes: a prospective study. Am J Sports Med. 2005;33(4):492–501. doi: 10.1177/0363546504269591. [DOI] [PubMed] [Google Scholar]
- 27.Myer GD, Ford KR, Khoury J, Succop P, Hewett TE. Development and validation of a clinic-based prediction tool to identify female athletes at high risk for anterior cruciate ligament injury. Am J Sports Med. 2010;38(10):2025–2033. doi: 10.1177/0363546510370933. [DOI] [PMC free article] [PubMed] [Google Scholar]
- 28.Myer GD, Ford KR, Khoury J, Succop P, Hewett TE. Clinical correlates to laboratory measures for use in non-contact anterior cruciate ligament injury risk prediction algorithm. Clin Biomech (Bristol, Avon) 2010;25(7):693–699. doi: 10.1016/j.clinbiomech.2010.04.016. [DOI] [PMC free article] [PubMed] [Google Scholar]
- 29.Hewett TE, Ford KR, Myer GD, Wanstrath K, Scheper M. Gender differences in hip adduction motion and torque during a single-leg agility maneuver. J Orthop Res. 2006;24(3):416–421. doi: 10.1002/jor.20056. [DOI] [PubMed] [Google Scholar]
- 30.Ford KR, Myer GD, Schmitt LC, Uhl TL, Hewett TE. Preferential quadriceps activation in female athletes with incremental increases in landing intensity. J Appl Biomech. 2011;27(3):215–222. doi: 10.1123/jab.27.3.215. [DOI] [PMC free article] [PubMed] [Google Scholar]
- 31.Bates NA, Ford KR, Myer GD, Hewett TE. Kinetic and kinematic differences between first and second landings of a drop vertical jump task: implications for injury risk assessments. Clin Biomech (Bristol, Avon) 2013;28(4):459–466. doi: 10.1016/j.clinbiomech.2013.02.013. [DOI] [PMC free article] [PubMed] [Google Scholar]
- 32.Bates NA, Ford KR, Myer GD, Hewett TE. Timing differences in the generation of ground reaction forces between the initial and secondary landing phases of the drop vertical jump. Clin Biomech (Bristol, Avon) 2013;28(7):796–799. doi: 10.1016/j.clinbiomech.2013.07.004. [DOI] [PMC free article] [PubMed] [Google Scholar]
- 33.Lawrence RK, 3rd, Kernozek TW, Miller EJ, Torry MR, Reuteman P. Influences of hip external rotation strength on knee mechanics during single-leg drop landings in females. Clin Biomech (Bristol, Avon) 2008;23(6):806–813. doi: 10.1016/j.clinbiomech.2008.02.009. [DOI] [PubMed] [Google Scholar]
- 34.Noonan KJ, Halliday S, Browne R, O’Brien S, Kayes K, Feinberg J. Interobserver variability of gait analysis in patients with cerebral palsy. J Pediatr Orthop. 2003;23(3):279–287. discussion 288–291. [PubMed] [Google Scholar]
- 35.Gorton GE, 3rd, Hebert DA, Gannotti ME. Assessment of the kinematic variability among 12 motion analysis laboratories. Gait Posture. 2009;29(3):398–402. doi: 10.1016/j.gaitpost.2008.10.060. [DOI] [PubMed] [Google Scholar]
- 36.Cook CE. Clinimetrics corner: the minimal clinically important change score (MCID): a necessary pretense. J Man Manip Ther. 2008;16(4):E82–E83. doi: 10.1179/jmt.2008.16.4.82E. [DOI] [PMC free article] [PubMed] [Google Scholar]
- 37.Chang HY, Wang CH, Chou KY, Cheng SC. Could forearm Kinesio Taping improve strength, force sense, and pain in baseball pitchers with medial epicondylitis? Clin J Sport Med. 2012;22(4):327–333. doi: 10.1097/JSM.0b013e318254d7cd. [DOI] [PubMed] [Google Scholar]
- 38.Centre for Evidence Based Medicine. [Accessed September 20, 2013];Levels of evidence 2011. 2011 http://www.cebm.net/index.aspx?o=1025.
- 39.Ossipov MH, Dussor GO, Porreca F. Central modulation of pain. J Clin Invest. 2010;120(11):3779–3787. doi: 10.1172/JCI43766. [DOI] [PMC free article] [PubMed] [Google Scholar]
- 40.Milner CE, Westlake CG, Tate JJ. Test–retest reliability of knee biomechanics during stop jump landings. J Biomech. 2011;44(9):1814–1816. doi: 10.1016/j.jbiomech.2011.04.005. [DOI] [PubMed] [Google Scholar]
- 41.Ferber R, McClay Davis I, Williams DS, 3rd, Laughton C. A comparison of within- and between-day reliability of discrete 3D lower extremity variables in runners. J Orthop Res. 2002;20(6):1139–1145. doi: 10.1016/S0736-0266(02)00077-3. [DOI] [PubMed] [Google Scholar]
- 42.Queen RM, Gross MT, Liu HY. Repeatability of lower extremity kinetics and kinematics for standardized and self-selected running speeds. Gait Posture. 2006;23(3):282–287. doi: 10.1016/j.gaitpost.2005.03.007. [DOI] [PubMed] [Google Scholar]
- 43.Steinwender G, Saraph V, Scheiber S, Zwick EB, Uitz C, Hackl K. Intrasubject repeatability of gait analysis data in normal and spastic children. Clin Biomech (Bristol, Avon) 2000;15(2):134–139. doi: 10.1016/S0268-0033(99)00057-1. [DOI] [PubMed] [Google Scholar]
- 44.Sinclair J, Hebron J, Taylor PJ. The influence of tester experience on the reliability of 3D kinematic information during running. Gait Posture. 2014;40(4):707–711. doi: 10.1016/j.gaitpost.2014.06.004. [DOI] [PubMed] [Google Scholar]
- 45.Pohl MB, Lloyd C, Ferber R. Can the reliability of three-dimensional running kinematics be improved using functional joint methodology? Gait Posture. 2010;32(4):559–563. doi: 10.1016/j.gaitpost.2010.07.020. [DOI] [PubMed] [Google Scholar]
- 46.Ramakrishnan HK, Kadaba MP. On the estimation of joint kinematics during gait. J Biomech. 1991;24(10):969–977. doi: 10.1016/0021-9290(91)90175-M. [DOI] [PubMed] [Google Scholar]
- 47.McNally M, Roewer B, Hewett T. Inter-rater reliability of two commercial 3-dimensional motion capture systems. Paper presented at: American Society of Biomechanics; September 2013; Omaha, NE. [Google Scholar]
- 48.Kristianslund E, Krosshaug T, van den Bogert AJ. Effect of low pass filtering on joint moments from inverse dynamics: implications for injury prevention. J Biomech. 2012;45(4):666–671. doi: 10.1016/j.jbiomech.2011.12.011. [DOI] [PubMed] [Google Scholar]
- 49.Roewer BD, Ford KR, Myer GD, Hewett TE. The ‘impact’ of force filtering cut-off frequency on the peak knee abduction moment during landing: artefact or ‘artifiction’? Br J Sports Med. 2014;48(6):464–468. doi: 10.1136/bjsports-2012-091398. [DOI] [PMC free article] [PubMed] [Google Scholar]
- 50.Paterno MV, Schmitt LC, Ford KR, et al. Biomechanical measures during landing and postural stability predict second anterior cruciate ligament injury after anterior cruciate ligament reconstruction and return to sport. Am J Sports Med. 2010;38(10):1968–1978. doi: 10.1177/0363546510376053. [DOI] [PMC free article] [PubMed] [Google Scholar]
- 51.Hewett TE, Myer GD, Ford KR, et al. Biomechanical measures of neuromuscular control and valgus loading of the knee predict anterior cruciate ligament injury risk in female athletes. Am J Sports Med. 2005;33(4):492–501. doi: 10.1177/0363546504269591. [DOI] [PubMed] [Google Scholar]
- 52.Myer GD, Chu DA, Brent JL, Hewett TE. Trunk and hip control neuromuscular training for the prevention of knee joint injury. Clin Sports Med. 2008;27(3):425–448. ix. doi: 10.1016/j.csm.2008.02.006. [DOI] [PMC free article] [PubMed] [Google Scholar]
- 53.Noehren B, Scholz J, Davis I. The effect of real-time gait retraining on hip kinematics, pain and function in subjects with patellofemoral pain syndrome. Br J Sports Med. 2011;45(9):691–696. doi: 10.1136/bjsm.2009.069112. [DOI] [PubMed] [Google Scholar]
- 54.Dowling AV, Favre J, Andriacchi TP. Inertial sensor-based feedback can reduce key risk metrics for anterior cruciate ligament injury during jump landings. Am J Sports Med. 2012;40(5):1075–1083. doi: 10.1177/0363546512437529. [DOI] [PubMed] [Google Scholar]
- 55.Dempsey AR, Lloyd DG, Elliott BC, Steele JR, Munro BJ, Russo KA. The effect of technique change on knee loads during sidestep cutting. Med Sci Sports Exerc. 2007;39(10):1765–1773. doi: 10.1249/mss.0b013e31812f56d1. [DOI] [PubMed] [Google Scholar]