Abstract
Bombyx mori (BM) silk fibroin is composed of two different subunits; heavy chain and light chain fibroin linked by a covalent disulphide bond. Current methods of separating the two silk fractions is complicated and produces inadequate quantities of the isolated components for the study of the individual light and heavy chain silks with respect to new materials. We report a simple method of separating silk fractions using formic acid. The formic acid treatment partially releases predominately the light chain fragment (soluble fraction) and then the soluble fraction and insoluble fractions can be converted into new materials. The regenerated original (total) silk fibroin and the separated fractions (soluble vs. insoluble) had different molecular weights and showed distinctive pH stabilities against aggregation/precipitation based on particle charging. All silk fractions could be electrospun to give fibre mats with viscosity of the regenerated fractions being the controlling factor for successful electrospinning. The silk fractions could be mixed to give blends with different proportions of the two fractions to modify the diameter and uniformity of the electrospun fibres formed. The soluble fraction containing the light chain was able to modify the viscosity by thinning the insoluble fraction containing heavy chain fragments, perhaps analogous to its role in natural fibre formation where the light chain provides increased mobility and the heavy chain producing shear thickening effects. The simplicity of this new separation method should enable access to these different silk protein fractions and accelerate the identification of methods, modifications and potential applications of these materials in biomedical and industrial applications.
INTRODUCTION
Silks are biocompatible and biodegradable proteins1 that are spun into fibres by silkworms and spiders under ambient, aqueous conditions.2 There are many natural sources of silk, but most silk is obtained from the silkworm Bombyx mori (BM) due to its ease of domestication.1 BM silk has unique properties suitable for biomedical applications, for example, biocompatibility, is nontoxic, non-irritant3–5 and has impressive mechanical properties.6 Silk fibres also function under a wide range of conditions of humidity and temperature.7 Due to its unique properties there is increasing interest in silk for biological applications.8 Silk already has a long history in biomaterial applications as it has been used as a surgical suture material successfully for decades9 and more recently has also been introduced into other biomaterials applications such as tissue engineering scaffolds10–14 and drug delivery.15–17
Structurally, BM silk primarily consists of two types of proteins, sericins and fibroin. Glue-like sericins are glycoproteins of amorphous nature that account for approximately 20–30 wt% of BM silk.18 Sericins are soluble in water due to the presence of a high content of hydrophilic amino acids (~70 %),19 with large sericin peptides soluble in hot water while small peptides can be dissolved in cold water.20 As sericins are involved in inducing allergic and immunological reactions,21–23 it is important that all sericin is removed from fibroin intended for biological applications.
Silk fibroin, the structural protein of BM silk fibres is insoluble in many solvents including water.4 Silk fibroin is a large protein macromolecule constructed of more than 5,000 amino acids24, 25 and accounts for approximately 75 wt.% of total BM silk.18 Silk fibroin is comprised of both crystalline (~66 %) and amorphous (~ 33%) regions.26 The crystalline portion of fibroin is composed of repeating units of the amino acids glycine (G), alanine (A), and serine (S), typically [G-A-G-A-G-S]n and form β-sheet structures in the spun fibres which are responsible for the mechanical properties.26, 27
Shimura et al; 1976,28 demonstrated that silk fibroin was composed of at least two protein subunits. The BM silk fibroin components, heavy chain (H-fibroin) and light chain (L-fibroin) are linked by a disulphide bridge. Another component of silk fibroin is a glycoprotein P25 attached by non-covalent interactions to the covalently bonded heavy and light chain complex.29,30 Quantitatively, H-fibroin, L-fibroin and P25 are present in the silk fibroin in a molar ratio of 6:6:1 respectively29 suggesting that P25 is attached to a set of six (H-L fibroin) dimers [(H-L)6.(P25)]. The glycoprotein P25 has a Mw of ~30 kDa and is secreted with H-fibroin30 and considered important in maintaining the integrity of silk fibres, however, its role in the formation of silk fibroin is not clear. Interestingly, in a few species of silkworms (saturniidae family), the L-chain and P25 are missing and silk is composed of only the H-chain.31
The heavy chain (H-Fibroin, Mw ~391 kDa)32 component has a primary structure formed by highly repetitive sequences of GAGAGS, GAGAGY and GAGAGVGY,24 which are mainly hydrophobic.33 The secondary structure is mainly β-sheet with anti-parallel assembly25,27 resulting in enhanced stability, crystallinity and mechanical properties in the spun fibres. The crystalline domains are separated by 11 highly conserved amorphous regions bracketed by threonine consisting largely of the amino acids glycine (G), serine (S) and tyrosine (Y) comprising 70 mol% between them. Variations within these regions include glutamine (N) and histidine (H) substitutions responsible for subtle charge modifications (determined using sequences retrieved from uniprot and calculations performed at pH 7 using the Scripps Research Institute protein calculator v 3.4). The N and C terminal region charge state of the heavy chain fibroin are similarly controlled by the substitution of arginine (R) with aspartic acid (D) resulting in a switch from acidic at the N terminal to basic at the C terminal. The role of these charged sites is not clearly understood but the additional presence of proline (P) residues has been shown to induce a 180 degree turn and facilitate the formation of the anti-parallel beta sheet structure.34 Light chain (L-Fibroin Mw ~25 kDa)32 has a more undifferentiated amino acid composition, non- repetitive sequence, shows comparatively more hydrophilic properties and is relatively elastic30 with little or no crystallinity.24,32 Both types of fibroin are linked by a single disulphide bond between Cys-c20 of H-fibroin and Cys-172 of L-fibroin32 and mutations which prevent the formation of this disulphide linkage result in reduced in vivo secretion of silk fibroin (the so called naked pupa mutant).36 Heavy chain fibroin is very different to the light chain fibroin and the structural differences in both types of silk proteins affect the physical properties of the individual materials and although the heavy chain character dominates in terms of composition (by mass), the behaviour of the total silk is significantly modified by the presence of the light chain component. Fabrication of materials from silk has been attempted by many methods such as gelation, casting and fibre spinning but recently, and due to the polymeric nature of the natural silk, many researchers, 12–16, 37 have used electro-spinning to generate nano-fibrous silk-based materials for biomedical applications. The most crucial parameters for silk electro-spinning are the viscosity of the electro-spinning dope, voltage supplied, collection plate distance and nature of solvent. For example, very low viscosity solutions may result in electrospray and in contrast, highly viscous solutions form thick fibres at relatively higher electric potential.37
Most studies with silkworm fibroin have utilized the intact fibroin chain to generate useful materials, with only a few publications reporting on the separation of the heavy and light chains and the study of the material features of the resulting fractions. It is important to note that both light chain and heavy chain silk are non toxic and provided good cell adhesion when cells of an exemplar cell line, NIH 3T3 were applied to electrospun mats prepared from these proteins.42 Separation procedures reported previously include chromatographic separation using Sephadex resins (G10037 or G20042) followed by SDS-PAGE for the light chain37 and DEAE-cellulose for the heavy chain,42 although both approaches are unsuitable for scale up. Scaffolds prepared using the isolated fractions showed more hydrophilic character, water uptake, degradation, and cell adhesion for the light chain fraction than either the mixed system or the heavy chain isolate.37 A further issue with the prior isolation methods was the lack of correlation of the percent relative composition of the fractions with respect to the known composition of silk fibroin. In the Wadbua et al. report,37 30% w/w was assigned to light chain isolate and 7% w/w to the heavy chain, even though the ratios are currently understood to be nearer to 10% to 90% w/w (i.e.1:1 mol ratio) suggesting incomplete separation and recovery of the components.
In this study, the goal was to accomplish the separation of silk fibroin fractions with different properties using a ‘simple’ method more suitable for industrial applications and compare their solution and electro spinning behaviour. To address this need, a separation method was developed. The resulting silk-based solutions were characterised for their rheological properties, composition, solution particle radii and charge variation with pH and their solution properties correlated with the morphology of the electro-spun materials generated from the individual fractions and blends.
MATERIALS AND METHODS
Materials
Dewormed silk cocoons from domesticated B. mori silk were supplied by Forest Fibres, UK. Sodium bicarbonate (NaHCO3) 99% was supplied by Sigma Aldrich, (Dorset, UK). Lithium bromide (LiBr 99%+) came from Acros Organics (Loughborough, UK). Cellulose dialysis tubing (12,000–14,000 Da molecular weight cut off) and formic acid (98–100 %) analytical grade (HCOOH) were supplied by Fisher Scientific (Loughborough, UK).
Bovine serum albumin (BSA Mw ~66 kDa), Sodium dodecyl sulphate (SDS) electrophoresis grade (C12H25NaO4S), sample buffer (Laemmli 2x concentrate), Coomassie blue reagent EZBlue™ and Proteosilver™ plus silver staining kit were all supplied by Sigma-Aldrich (Dorset, UK). Pre-cast ready to use tris-HCl (4–15% gradient polyacrylamide) gels and the Bradford protein assay reagent (Quick startTM) were supplied by Bio-Rad (Hertfordshire, UK). The protein marker HiMark pre-stained protein standard (range 30 kDa – 460 kDa) was supplied by Invitrogen (Paisley, UK) and was pre-modified by addition of a 17 kDa myoglobin protein supplied by Sigma-Aldrich (Dorset, UK).
Methods
Degumming
To remove sericin, silk cocoons were boiled (2 × 30 minutes) in 0.5 wt % aqueous solution of NaHCO3 followed by thorough rinsing with warm de-ionized distilled water and air dried at room temperature.
Separation of silk fractions
Degummed silk was weighed and dispersed in 98–100 % formic acid (FA) at a range of concentrations (0.01–8% w/v) for 30 minutes and then centrifuged at 4,000 rpm for half an hour to sediment the un-dissolved material. The supernatant was filtered using glass fibre filters to remove any remaining suspended particles/fibres. The insoluble fraction from each sample was treated twice more with formic acid to ensure all soluble components had been removed and the supernatants were then combined. The insoluble fractions were washed thoroughly using de-ionized distilled water to remove all residual formic acid and air dried. Both the soluble and insoluble fractions were left under a flow of air at room temperature to evaporate to constant weight. Once dried the ratio of each fraction by weight at each concentration was determined.
Silk regeneration
Degummed silk fibroin and the separated fractions were dissolved in aqueous lithium bromide solutions (9.3 M) and heated for 3 hours at 65°C then centrifuged at 4,000 rpm for 30 minutes to sediment any remaining insolubles before dialysis. The supernatants were then dialyzed against deionized distilled water using 12,000–14,000 Da molecular weight cut off cellulose membrane. The deionised water was changed about every 30 minutes to maximize concentration gradients and minimize the time required for dialysis down to a conductivity of <10 μScm−1 in order to reduce the chance of the silk re-precipitating through β sheet reformation. A small sample was taken from each solution at this stage for SDS-PAGE analysis. The solutions were then freeze dried after an initial rapid freeze in liquid nitrogen, care being taken not to allow the silk solution to thaw at any stage.
SDS-PAGE analysis
The final protein concentration of dialyzed silk solutions was estimated using the Bradford protein assay. Sample buffer (Laemmli 2x; pH 6.8), containing 10% of 2-mercaptoethanol 0.004% bromophenol blue was modified according to reported methods,44,45 by adding urea and sodium dodecyl sulphate (SDS) to achieve a final level of 8 M and 10% respectively. All samples were diluted with this modified sample buffer (pH 6.8) in a volumetric ratio of 1:1 and were denatured by heating in a water bath at 50°C for ten minutes. All samples were centrifuged at 2,000 rpm for 30 seconds and were then loaded in the polyacrylamide gel alongside protein markers. Gel electrophoresis was performed in running buffer (pH 8.3) containing SDS (0.1%), trizma base buffer (25 mM), glycine 192 (mM) and HCl (to adjust pH) at a fixed voltage of 120 v until all samples approached the bottom of the gel.
Gel staining
After electrophoresis, each gel was washed thoroughly with de-ionized distilled water to remove all residual SDS and running buffer. A double staining technique i.e. Coomassie blue stain followed by more sensitive Sigma Proteo silver plus staining kit which can detect as little protein as 20 ng was used according to the manufacturer’s instructions.
Amino acid analysis
Amino acid analysis was carried out on 100 – 300 pmol samples of the isolates hydrolysed for 20 hours at 110°C in 6M hydrochloric acid. The individual amino acids were resolved by ion exchange chromatography (Ultropac 8 cation exchange resin) and post column derivatised with ninhydrin for quantification at 440 and 570 nm using a Biochrom 30 analyser (Biochrom, Cambridge UK). For cysteine analysis the proteins were oxidised with performic acid pre hydrolysis and then quantified as cysteic acid. The amino acids glutamine (Q) and asparagine (N) both hydrolyse to glutamic (E) and aspartic acid (D) respectively during the acid hydrolysis and were subsequently reported as the combined sum of the acid and acid hydrolysate.
Mass spectrometry
Spectra of digested and undigested silk fractions were obtained using a Ultraflextreme MALDI-Tof/Tof (Brüker Daltonics, Germany) instrument operating in positive ion reflection and linear modes respectively. Digests were prepared through overnight incubation of each silk fraction at 37°C with 0.4% Pepsin (Sigma Aldrich, UK) in 10 mM HCl. Undigested samples were dissolved in either 10 mM HCl or 0.1% trifluoroacetic acid. Prior to analysis samples were concentrated and desalted using C18 Supel-Tips reverse phase columns as per the manufacturer’s instructions (Sigma, UK) and spotted 1:1 with either α-cyano-4-hydroxycinnamic acid or sinapinic acid (digested and undigested fractions respectively). MS and MS/MS spectra of digested fractions were submitted to the MASCOT database search (Matrix Science) for protein identification.
Photon correlation spectroscopy and zeta potential measurements
Measurements were made using a Malvern nanoS Zetasizer (Malvern instruments, UK). Dispersed phase properties of latex and a dispersion phase of water were chosen for a compatible refractive index, viscosity, and dielectric constant. Measurement of particle size required the use of silk fractions dialysed against potassium hydroxide (1 × 10⁻⁵ M) to postpone aggregation of the fractions and allow data collection. For measurement of the solution zeta potentials, five separate measurements were made at each pH, and the results were averaged (any outliers, typically caused by thermal turbulence or spurious dust particles, were removed where necessary but not more than one allowed per data set). The pH was adjusted for subsequent measurement by the addition of measured amounts of 0.01M hydrochloric acid, and the measurements were repeated to give zeta potential and particle size data over a pH range 3–9.
Viscosity measurements
Solutions of silk fraction isolates and blends were prepared at 5 – 20% total protein content in formic acid (98–100%) and viscosity measured over a range of shear stresses of 0.05 to 10 Pa at 25°C using a Carri-med cone and plate rheometer and data analysed with TA instruments Rheology Solutions Software Data Module, Version DATA V123u.
Electro-spinning
Natural B. mori silk and the separated silk fractions were regenerated as described and the dried silk was dissolved in 98–100% formic acid at room temperature to up to 20% w/w clear solutions. The flow rate of silk solutions was adjusted to 0.9 ml/hour before electrospinning using a potential gradient of 2.5 kVcm−1 and the earthed aluminium target set at a distance of 10 cm.
Scanning Electron Microscopy (SEM)
The morphology and size of the electrospun fibres was assessed using scanning electron microscopy. Small amounts of sample were cut out and attached to on to electrically conducting carbon sticky patch and mounted on aluminium stubs and then gold-coated using an argon gold plasma at 1.2 kV for 2 min (estimated to provide a gold coating of 5–10 nm). Images were collected using a Jeol 840 scanning electron microscope with a tungsten filament and a beam acceleration voltage of 20 kV. Fibre diameter analysis was carried out by averaging the diameter of 50+ fibres and uniformity measured as the diameter relative standard deviation.
RESULTS AND DISCUSSION
L-fibroin and H-fibroin have different structural and physical properties that could be attractive for biomedical applications29, 30, 33. The major problem in using H and L-fibroin is their separation and purification from silk cocoons without protein degradation and at a scale and cost which makes the process amenable to scale up. In vivo, silk fibroin is water soluble and converts to a tough, insoluble and organized form on spinning and dehydration.38, 39 The mechanism of silk fibroin assembly in animals and how they convert water soluble protein into tough and insoluble fibres by spinning is only partially understood.39 The process which is challenging to reverse appears to be accomplished through changes in ionic strength, water removal and the application of chain alignment and/or shear forces. Different approaches such as column chromatography28, 37 and genetic engineering42,43, have been used to separate or synthesise H and L-fibroins, but these are not commercially practical in terms of cost and scale up.
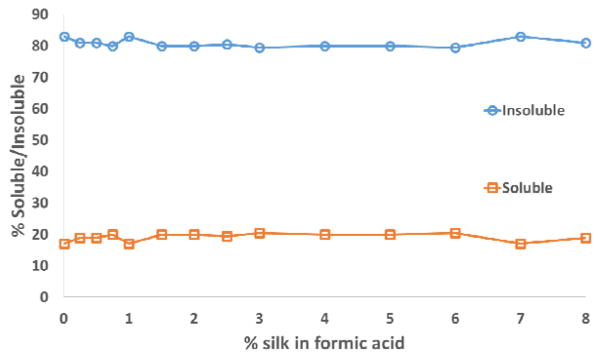
In this study the two fractions were separated based on formic acid solubility while minimizing changes in MW. After degumming the silk fibroin was dissolved partially by repeat treatment with formic acid washes. The soluble and insoluble fractions were separated and air dried (Figure 1). At all levels of silk:formic acid studied, consistently 14 – 16 % by weight of the silk fibroin was formic acid soluble (Figure 2) indicating that the achieved separation was not merely due to limitations of solubility. This level of soluble fraction also indicates that it consists of more than just the light chain, which constitutes only ~7% of the total mass.
Figure 1.
Condition of silk a). After degumming b). Formic acid insoluble c). Formic acid soluble.
Figure 2.
Percent soluble and insoluble silk fractions over a range of 0.01 – 8% total silk in formic acid.
Both isolates (soluble, insoluble) were regenerated by dissolving in lithium bromide solution (9.3M) to disrupt their secondary structures and then rapidly dialysed against water and freeze dried to prevent β sheet formation. SDS-PAGE analysis of the fractions and regenerated total silk fibroin (Figure 3) supported the view that some thermal or chemical degradation occurred to the heavy fraction during the degumming process or formic acid dissolution as no discrete band at ~391 kDa was observed in the formic acid insoluble fraction with only general staining above 100 kDa was visible, indicative of heavy chain fragments. The presence of the isolated band correlating to a mass of 27 kDa in the formic acid soluble fractions and its absence in the insoluble fraction indicated that the light chain fragment was removed by the acid treatment. Formic acid is a polar protic solvent and intermolecular hydrogen bonding between molecules of formic acid occurs. Although these are not as extensive as in water they are individually stronger (resulting in raised boiling point and other physical properties) so, as with water, species with hydrogen bonding sites will be favoured in terms of solvation and therefore solubility. An expected consequence of this would be the favoured solubilty of the light chain fragment of silk fibroin with its more hydrophillic side chains compared with the more non polar side chains (glycine/alanine) of the heavy chain fraction. The low molecular weight fraction was relatively unaffected by the regeneration treatment since its non regenerated form showed similar solution viscosity properties and electrospun fibre characteristics (Supplementary data).
Figure 3.
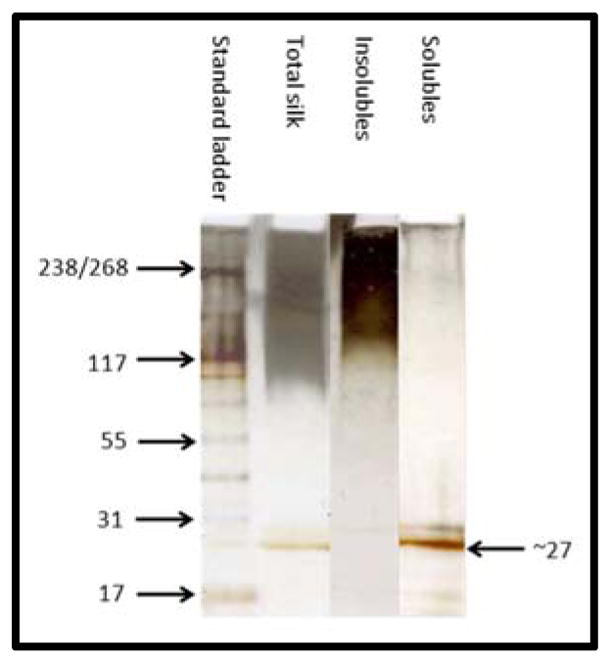
SDS-PAGE analysis of regenerated fibroin and fractions
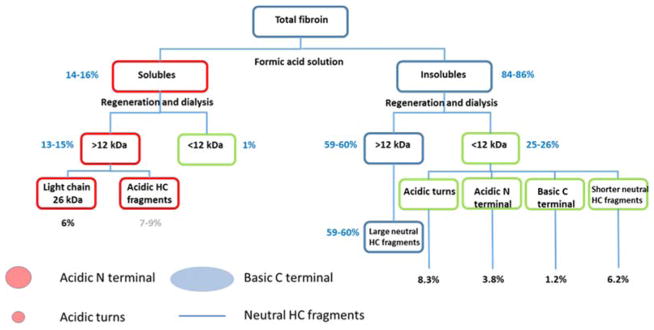
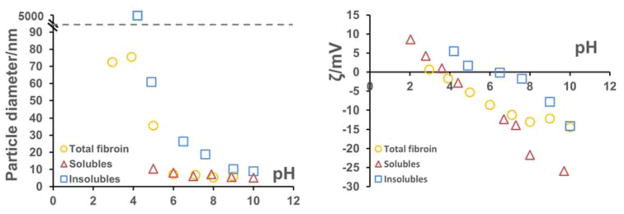
Photon correlation spectrosopy was used to assess the size of the molecules present in the isolated silk fractions. Due to the rapid formation of aggregates when the isolated silk fractions were redissolved in water, initial photon correlation spectroscopy data collected from water based solutions was inconclusive. To counteract this problem, silk fractions were prepared, dialysed against potassium hydroxide (10−5 M) solution at pH 9.0 and then measured by photon correlation spectroscopy directly. Conducting the dialysis at pH 9.0 generated sufficient charge on the silk fractions to postpone aggregation of the fractions and gave particles of hydrodynamic radius 2.4, 4.2 and 7.8 nm for the soluble, insoluble and total silk fractions (Figure 4) consistent with molecular weights of ~26, 97 and 411 kDa respectively assuming globular shaped particles (using MW (kDa) = (1.68RH)2.3394).46 These values correlate with the light chain (2.4 nm), what might be expected for fragmented heavy chain sections (4.2 nm) and total silk fibroin (7.8 nm). Additionally the peak observed for the insoluble fractions showed some broadening indicative of mixed mass fragments. However, as the soluble fraction had already been shown to consist of more than merely the light chain fibroin, (based on mass ratios observed for each of the fractions)., it appears to be a combination of the light chain fibroin and shorter heavy chain fragments of 17 – 30 KDa (indicated by SDS-PAGE Figure 3 solubles lane). Formic acid is known to cleave peptides at the C terminal side of aspartyl residues.47 If this process was complete, the light chain fraction would be digested to fragments entirely less than 10 kDa and it should be removed during dialysis. Its presence in the formic acid solubles fraction (27 kDa band observed by SDS-PAGE) shows that this did not happen. Mass balance analysis of the soluble fraction showed 94% retention after processing indicating that the majority of this fraction to be made up of > 12–14 kDa macromolecules. By mass the light chain component represents ~ 6% of the total so the soluble fraction contains an additional 8 – 10 % of other fibroin componants (i.e., only 30 – 40 % of the soluble fraction is the light chain sequence –Figure 7).
Figure 4.
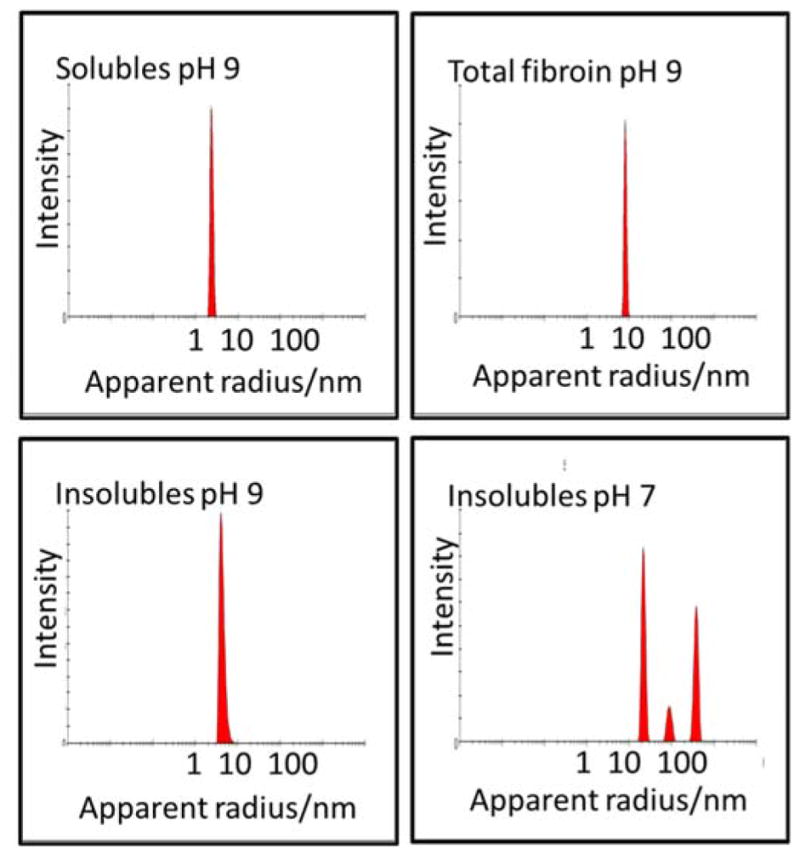
Photon correlation spectroscopy number size distribtion analysis of the isolated fractions and combined fibroin at stable (pH 9) and insolubles aggregating pH (pH 7).
Figure 7.
Flow chart of fractions generated based on SDS-PAGE, zeta potential, mass balance and calculations using peptide calculator and the known amino acid sequences. Red boxes refer to formic acid solubles isolated, blue boxes insoluble isolates, green boxes fragments lost through dialysis. Blue values are absolute % of original mass and based on weight measurements, black values refer to content calculated from known amino acid sequences and the grey value represents an estimate based on the difference between mass found and known light chain content. The key refers back to Figure 6.
Measurement of zeta potential and particle size conducted over a range of pH 4 – 9 (Figure 5) showed differences between the major fractions as can be expected with the hydrophilic light chain containing fraction stabilised as a monomer under charged conditions, but the hydrophobic heavy chain containing fraction expected to show a preference to aggregate due to the lack of charged side chains and imposed entropic pressures (Figure 5, pH 7 data). This was observed in the corresponding isolates and supported the conclusion that the soluble fraction was predominately light chain silk and similarly sized heavy chain fibroin fragments, while the insoluble fraction consisted mostly of heavy chain fragments. The regenerated total silk, by comparison showed considerably less tendency to aggregate than the insoluble fraction (apparent particle size only increasing at pH values below 6) with particle diameters similar to that expected for ~ 400 kDa proteins. Thesoluble fraction shows little tendency to aggregate at a pH above 5. All of these observations correlated with the zeta potential measurements obtained over the same pH range where the soluble fraction was shown to maintain significant negative charge over the whole range and therefore remain a stable colloid. The insoluble fraction showed little charge below pH 8 resulting in aggregation (observed as particle radius increase) and the total fibroin exhibiting intermediate behaviour between the two with apparent particle growth only at lower pH.
Figure 5.
Photon correlation spectroscopy (left) and corresponding zeta potential data (right).
The charged sites on total silk fibroin were analysed and pKa’s estimated based on isolated subsections (Figure 6). It is noteworthy that the highly conserved sequences in the heavy chain fragment are all acidic in nature and therefore would be expected to hold a small positive charge at pH 7. This could produce some electrostatic resistance to the formation of anti-parallel _ sheet structure both within and between protein strands. Attempts to utilize amino acid analysis of the isolated fractions proved challenging due to the limitations of the technique to distinguish the various fractions and the similarity in sizes and sequences of the different domains. The repetetive nature of the heavy chain quickly dominates the amino acid analysis so the retention of fragments of the crystalline heavy chain domains can result in profiles which are in many ways indistinguishable from the amino acid profile of total silk. Mass spectrometry methods were used to obtain sequence information but these proved even more challenging due in part to the repetetive nature of the sequence, side chain modifications during the separation process (eg formate adducts) and non typsinised fragmentation which can confuse digest fragment recognition software such as Mascot, and aggregation/gelation reducing the level of matrix desorption.
Figure 6.
Calculated pKa’s (upper black numbers) and charge states at pH 7 (lower red numbers) for heavy chain and light chain components of silk fibroin as determined by software made available by the Scripps Research Institute,48 blue zones denote basic properties (+ve at neutral pH) and red zones acidic properties (−ve at neutral pH). Amino acid residue numbers in green.
Further information on the isolated fractions came from the zeta potential data (Figure 5). None of the regenerated fractions gave a positive zeta potential at pH 7. This finding suggested that the basic heavy chain C terminal section could not be present in isolation and therefore remained bound to other fragments through their acidic side groups either through covalent bonding or strong electrostatic interactions. This results in the neutralisation of the positive charge or alternatively the charge sites are hidden inside the folded protein structure although the latter is unlikely in aqueous medium. A further alternative is that this segment is cleaved at an earlier point and was lost during dialysis. Since formic acid is known to cleave both at the N- and C-terminal of aspartyl residues (preferentially the C terminal)47 and the first post c20 cys-cys disulphide bridge aspartyl residue on the heavy chain fibroin is at c30, cleavage here would result with the light chain being detectable in a segment with a mass of 29,326 Da. This may be represented by the higher mass band observed in the SDS-PAGE (Figure 3) and be a result of incomplete reduction of the di-sulphide bridge during sample preparation. However this fragment would have a pI of 7.0 and therefore a net charge of zero at pH 7, features absent from the zeta potential data of the soluble fraction. The indication is then that the origin of this 31 kDa band is from another source, most likely a cleaved heavy chain repreat fragment with still attached acidic linker. By comparison, the insoluble fraction showed an isoelectric point a little below pH 7 indicating no significant acidic (or basic) composition. Dynamic light scattering, zeta potential measurement and SDS-PAGE in combination indicate this insoluble fraction to be composed mainly of uncharged repetetive crystalline sequence residues. Mass balance analysis of the formic acid insoluble fraction showed 70 % retention after regeneration and dialysis representing a loss of 25% of the original silk fibroin due to removal of smaller fragments by dialysis. A combination of the basic C terminal domain, the conserved charged linkers from the heavy chain sequence, the shorter crystalline fragments and the N terminal acidic domain all which are < 12 kDa would comprise approximately 21% of the original fibroin mass and may be the explanation for the observed recovery values. The removal of these charged species would also explain why the insoluble fraction was found to have an isoelectric point at pH 6–7 and be relatively more resistant to charging. In summary the compositions of the fractions based on DLS, zeta potential, SDS-PAGE and recoveries indicate that the formic acid soluble part to be a combination of the light chain sequence and some crystalline (GXG)n with the acidic linkers attached. The insoluble isolate appears to largely consist of uncharged crystalline (GXG)n segments with removal of smaller charged and uncharged fragments by the dialysis process. Figure 7 is an explanatory flow chart describing the fate and quantities of the component fractions with regard to the characterisation data collected and the properties calculated using known sequence data. During the processing the light chain fibroin appears to be more resistant to degradation than the heavy chain fibroin.
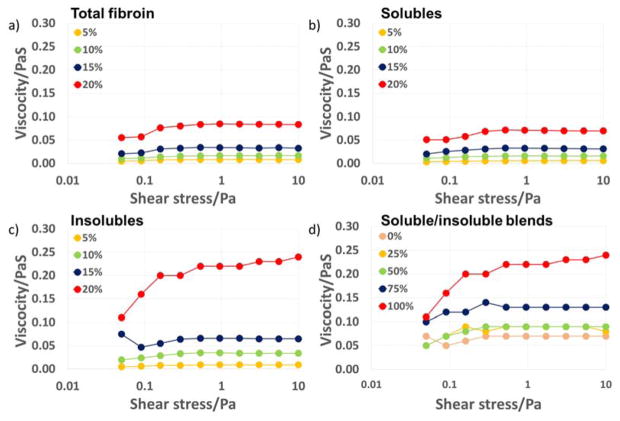
Viscosity measurements on formic acid solutions of the isolated fractions performed at a range of solution concentrations (5–20 wt%) were able to provide clear evidence for further differences in the solution behaviour of the different fractions (Figure 8). The insoluble isolates were less mobile than the soluble fraction and surprisingly less mobile than the intact regenerated fibroin, suggesting that either degradation in the heavy chain of the insolubles during processing was the cause or the covalently bonded light component in the intact fibroin has a role in maintaining its solution mobility. The soluble fraction showed no significant differences in behaviour before or after regeneration, indicating no damage during processing (supplementary data). Shear rheometry of all fractions at all concentrations (Figure 8) showed some non-Newtonian behaviour at low stress in the form of shear thickening. This effect stabilised at shear stresses above 1 Pa. indicative of weak interactions between molecules of the dispersed phase that are overcome as more energy is introduced into the system. Measurements on total silk fibroin were similar to those of the soluble fraction with increases in viscosity under shear of ~40%, the insoluble fraction by comparison more than doubled its viscosity over the same shear range. In addition this fraction showed continuing shear thickening that may be a result of the re-alignment of the crystalline domains which are also thought to be in part responsible for the rapid conversion from water soluble to insoluble forms reported to occur in the natural spinning process.49 The observed low shear viscosity increases can be associated with molecular alignment of the silk chains in the direction of shear which has been reported previously for aqueous solutions of silk.50
Figure 8.
Shear rheology of silk fibroin fractions and mixtures. a) Total silk fibroin regenerated, b) soluble fraction regenerated (and formic acid blank), c) Insoluble fraction regenerated, d) Soluble/insoluble blends (total silk concentration 20%). The legends in a)–c) show silk content and d) percentage contribution of the insoluble fraction.
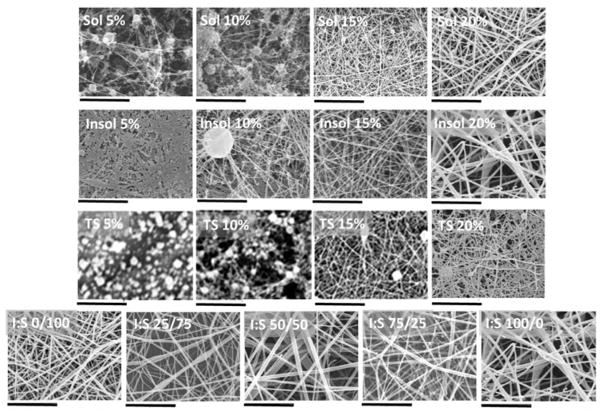
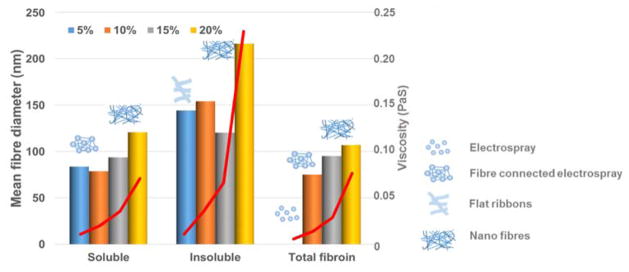
Non-woven mats were prepared by electro-spinning using solutions of the silk fibroin and isolated soluble and insoluble fractions with the level of success determined by analysis of the materials formed using SEM (Figures 9 and 10). The soluble fraction and total silk fibroin were only able to produce principally fibres at concentrations above 15 wt% whilst the heavy chain fraction produced fibres even at 5 wt% although these were flattened ribbons indicating incomplete removal of solvent at the point of deposition. At low viscosities the fractions tended to electrospray rather than generate fibres but continuous fibres of the total silk and soluble fraction could be spun by increasing the concentration to a point where viscosity increased above 0.03 PaS (~15% w/v). At 20% protein levels the isolated fractions and blends (Figures 9, 11b) produced continuous fibres of diameter ~120 nm (soluble fractions), ~320 nm (insoluble fraction) and ca. 100nm (total silk fibroin).
Figure 9.
Mats produced by electrospinning of solutions of the regenerated fibroin isolates, total fibroin and blends. Individual isolates and total fibroin solutions were 5 – 20% formic acid solutions. Blends were 20% by weight silk protein comprising 0 – 100% insoluble fraction by composition All scale bars represent 5μm
Figure 10.
Correlation of fraction and concentration with viscosity (red line), mean fibre diameter and electrospin character.
Figure 11.
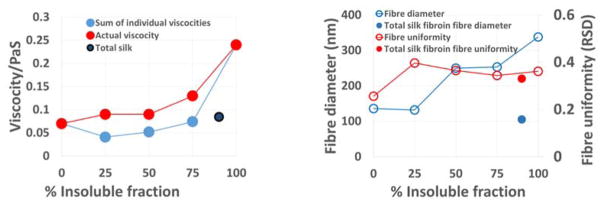
Comparison of insoluble and soluble blends a) viscosity at shear stress above 1 Pa and b) fibre diameter and uniformity with that of total silk fibroin.
As it was possible to isolate significant quantitites of the ‘soluble’ and ‘insoluble’ fractions it was also possible to study the effect of non-natural ratios of the fractions on solution and materials properties as well as being able to compare their behaviour with regenerated silk fibroin (light chain:heavy chain; 10:90 wt%). The silk blends (0–100% insoluble fraction) showed viscosity behaviour more simular to the behaviour of the insoluble fraction alone (Figure 8) but when the viscosities of the individual components were taken into account, all samples containing a blend of the two fractions exhibited a greater viscosity than the sum of their individual components possibly indicating interaction between the light and heavy chain fragments present in the isolated fractions (Figure 11a). Similarly, analysis of electropun mats prepared from solutions containing both soluble and insoluble fractions showed that it was possible to vary fibre diameter with solution composition in a rational manner. Average fibre diameter increased as a function of insoluble fraction content (and therefore viscosity). For a given solution concentration it was possible to generate materials with tunable diameter.
Although extensive investigation into the properties and fabrication of silk materials has been conducted over many years very little effort has focused on the fractionation of the fibroin beyond isolation of small quantites of light and heavy chain for sequence elucidation and fibroin composition studies. A number of studies on the degradation rates and mechanisms51,52 have been carried out but with the exception of Wadbua et al37 these have been conducted on the total silk fibroin and not isolated fractions. These silk fractions may offer a less expensive more readily available source of biopolymers with contrasting stability profiles especially as these formic acid soluble/insoluble fractions are likely to be composed of different levels of light/heavy chain and also variously degraded sub-units of the latter that are, as we have shown, amenable to blending with conserved control of properties. The desire for implant materials with good biocompatibility and controllable stabilities which mirror tissue regeneration or drug release rates makes these silk isolates a potentially plentiful source of such materials.
CONCLUSIONS
Successful isolation of silk fractions with different properties was achieved by separating the formic acid soluble and insoluble fractions after an initial degumming process. SDS-PAGE analysis indicated the soluble fraction to be predominately the light chain component with some additional acid terminated (GXG)n fragments and the insoluble fraction to contain fragments predominately from the heavy chain component. Further evidence was provided by photon correlation spectroscopy which supported the SDS-PAGE data with colloidal particle sizes corresponding to light chain from the soluble fraction, total fibroin from the formic acid untreated material and fragmented heavy chain segments from the insoluble fraction. The zeta potential measurements showed aggregation of the silk fractions in solution to be controlled by charge levels with stable colloids only formed in aqueous media under conditions of relatively high charge (ζ > 8 mV). The potential to deposit electro-spun mats from formic acid solutions was feasible at concentrations which produced viscosities above 0.03 PaS for any of the isolated fractions or blends thereof and fibre diameters and uniformity could be controlled by overall concentration or blending of the protein fractions. Mixtures of the isolated fractions showed interaction of the components with higher viscosities than would be expected for the sum of their individual constituents. In contrast, the total silk fibroin produced significantly more mobile solutions however fibre production was still controlled by the viscosity of the solution rather than concentration. We have shown the ability of these isolates to produce non-woven mats with controlled morphologies where the contrasting chemistries of the protein sequences will have implications in functions such as protein/cell adhesion and cell proliferation. In addition these materials can be easily further modified chemically to include other functional sequences to enhance mineral formation for either biomedical implant or other industrial applications.
Acknowledgments
The authors are grateful for the support of NIH funding (RO1-DE017207), and to Graham Hickman for Mass spectrometry analysis.
References
- 1.Numata K, Kaplan DL. Adv Drug Deliv Rev. 2010;62:1497–1508. doi: 10.1016/j.addr.2010.03.009. [DOI] [PMC free article] [PubMed] [Google Scholar]
- 2.Jin HJ, Kaplan DL. Nature. 2003;424:1057–1061. doi: 10.1038/nature01809. [DOI] [PubMed] [Google Scholar]
- 3.Zuo B, Dai L, Wu Z. J Mater Sci. 2006;41:3357–3361. [Google Scholar]
- 4.Mondal M, Trivedy K, Nirmal Kumar S. Caspian J Env Sci. 2007;5(2):63–76. [Google Scholar]
- 5.Kim K, Jeong L, Park H, Shin S, Park W, Lee S, Kim T, Park Y, Seol Y, Lee Y, Ku Y, Rhyu I, Han S, Chung C. J Biotechnol. 2005;120:327–339. doi: 10.1016/j.jbiotec.2005.06.033. [DOI] [PubMed] [Google Scholar]
- 6.Omenetto FG, Kaplan DL. Science. 2010;329:528–531. doi: 10.1126/science.1188936. [DOI] [PMC free article] [PubMed] [Google Scholar]
- 7.Agarwal N, Hoagland DA, Farris RJ. J Appl Polym Sci. 1997;18:401–410. [Google Scholar]
- 8.Altman GH, Diaz F, Jakuba C, Calabro T, Horan RL, Chen J, Lu H, Richmond J, Kaplan DL. Biomaterials. 2003;24(3):401–416. doi: 10.1016/s0142-9612(02)00353-8. [DOI] [PubMed] [Google Scholar]
- 9.Ahmad A, O’Leary JP. Am Surg. 1997;63(11):1027–8. [PubMed] [Google Scholar]
- 10.Gellynck K, Verdonk PCM, Van Nimmen E, Almqvist KF, Gheysens T, Schoukens G, Van Langenhove L, Kiekens P, Mertens J, Verbruggen GJ. Mater Sci-Mater M. 2008;19:3399–3409. doi: 10.1007/s10856-008-3474-6. [DOI] [PubMed] [Google Scholar]
- 11.Kim HJ, Kim U, Kim HS, Li C, Wada M, Leisk GG, Kaplan DL. Bone. 2008;42:1226–1234. doi: 10.1016/j.bone.2008.02.007. [DOI] [PMC free article] [PubMed] [Google Scholar]
- 12.Peh RF, Suthikum V, Goh CH, Toh SL. IFMBE Proc. 2007;14:3287–3290. [Google Scholar]
- 13.Nair LS, Bhattacharyya S, Laurencin CT. Expert Opin Biol Th. 2004;4:659–668. doi: 10.1517/14712598.4.5.659. [DOI] [PubMed] [Google Scholar]
- 14.Damrongrungruang T, Siritapetawee M, Kamanarong K, Limmonthon S, Rattanathongkom A, Maensiri S, Nuchdamrong S. J Oral Tissue Eng. 2007;5:1–6. [Google Scholar]
- 15.Wenk E, Wandrey AJ, Merkle HP, Meinel L. J Control Release. 2008;132:26–34. doi: 10.1016/j.jconrel.2008.08.005. [DOI] [PubMed] [Google Scholar]
- 16.Li W, Mauck RL, Tuan RS. J Biomed Nanotechnol. 2005;1(17):259–275. [Google Scholar]
- 17.Hardy JG, Römer LM, Scheibel TR. Polymer. 2008;49:4309–4327. [Google Scholar]
- 18.Kodama K. Biochem J. 1926;20:1208–1222. doi: 10.1042/bj0201208. [DOI] [PMC free article] [PubMed] [Google Scholar]
- 19.Takasu Y, Yamada H, Tsubouchi K. Biosci biotech bioch. 2002;6:2715–2718. doi: 10.1271/bbb.66.2715. [DOI] [PubMed] [Google Scholar]
- 20.Zhang Y. Biotechnol Adv. 2002;20:91–100. doi: 10.1016/s0734-9750(02)00003-4. [DOI] [PubMed] [Google Scholar]
- 21.Dewair M, Baur X, Ziegler K. J Allergy Clin Immun. 1985;76:537–542. doi: 10.1016/0091-6749(85)90772-9. [DOI] [PubMed] [Google Scholar]
- 22.Panilaitis B, Altman GH, Chen J, Jin H, Karageorgiou V, Kaplan DL. Biomaterials. 2003;24(18):3079–3085. doi: 10.1016/s0142-9612(03)00158-3. [DOI] [PubMed] [Google Scholar]
- 23.Wray LS, Hu X, Gallego J, Georgakoudi I, Omenetto FG, Schmidt D, Kaplan DL. J Biomed Mater Res B. 2011;99(1):89–101. doi: 10.1002/jbm.b.31875. [DOI] [PMC free article] [PubMed] [Google Scholar]
- 24.Yamaguchi K, Kikuchi Y, Takagi T, Kikuchi A, Oyama F, Shimura K, Mizuno S. J Mol Biol. 1989;210:127–139. doi: 10.1016/0022-2836(89)90295-7. [DOI] [PubMed] [Google Scholar]
- 25.Zhou C, Confalonieri F, Jacquet M, Perasso R, Li Z, Janin J. Proteins: Structure, Function, and Genetics. 2001;44:119–122. doi: 10.1002/prot.1078. [DOI] [PubMed] [Google Scholar]
- 26.Zhang Y, Shen W, Xiang R, Zhuge L, Gao W, Wang W. J Nanopart Res. 2007;9:885–900. [Google Scholar]
- 27.Mita K. J Mol Evol. 1994;38:583. doi: 10.1007/BF00175878. [DOI] [PubMed] [Google Scholar]
- 28.Shimura K, Kikuchi A, Ohtomo K, Katagata Y, Hyodo A. J Biochem. 1976;80:693–702. doi: 10.1093/oxfordjournals.jbchem.a131328. [DOI] [PubMed] [Google Scholar]
- 29.Inoue S, Tanaka K, Arisaka F, Kimura S, Ohtomo K, Mizuno S. J Biol Chem. 2000;275:40517–40528. doi: 10.1074/jbc.M006897200. [DOI] [PubMed] [Google Scholar]
- 30.Tanaka K, Inoue S, Mizuno S. Insect Biochem Molec. 1999;29:269–276. doi: 10.1016/s0965-1748(98)00135-0. [DOI] [PubMed] [Google Scholar]
- 31.Takei F, Oyama F, Kimura K, Hyodo A, Mizuno S, Shimura K. J Cell Biol. 1984;99(6):2005–2010. doi: 10.1083/jcb.99.6.2005. [DOI] [PMC free article] [PubMed] [Google Scholar]
- 32.Tanaka K, Kajiyama N, Ishikura K, Waga S, Kikuchi A, Ohtomo K, Takagi T, Mizuno S. BBA protein Struct M. 1999;1432:92–103. doi: 10.1016/s0167-4838(99)00088-6. [DOI] [PubMed] [Google Scholar]
- 33.Garel J. Trends Biochem Sci. 1982;7:105–108. [Google Scholar]
- 34.Ha SW, Gracz HS, Tonelli AE, Hudson SM. Biomacromolecules. 2005;6(5):2563–9. doi: 10.1021/bm050294m. [DOI] [PubMed] [Google Scholar]
- 35.Zhang Y, Lim CT, Ramakrishna S, Huang ZM. J Mater Sci Mater-M. 2005;16:933–946. doi: 10.1007/s10856-005-4428-x. [DOI] [PubMed] [Google Scholar]
- 36.Mori K, Tanaka K, Kikuchi Y, Waga M, Waga S, Mizuno S. J Mol Biol. 1995;251:217–228. doi: 10.1006/jmbi.1995.0429. [DOI] [PubMed] [Google Scholar]
- 37.Wadbua P, Promdonkoy B, Maensiri S, Siri S. Int J Biol Macromol. 2010;46:493–501. doi: 10.1016/j.ijbiomac.2010.03.007. [DOI] [PubMed] [Google Scholar]
- 38.Taddei P, Monti P. Biopolymers. 2005;78(5):249–258. doi: 10.1002/bip.20275. [DOI] [PubMed] [Google Scholar]
- 39.Foo CW, Bini E, Hensman J, Knight DP, Lewis RV, Kaplan DL. Appl Phys A. 2006;82:223–233. [Google Scholar]
- 40.Chen C, Chuanbao C, Xilan M, Yin T, Hesun Z. Polymer. 2006;47:6322–6327. [Google Scholar]
- 41.Chen Z, Shao NS, Marinkovic LM, Miller P, Zhou MR. Biophys Chem. 2001;89:25–34. doi: 10.1016/s0301-4622(00)00213-1. [DOI] [PubMed] [Google Scholar]
- 42.Oyama F. J biochem. 1984;96:1689. doi: 10.1093/oxfordjournals.jbchem.a135001. [DOI] [PubMed] [Google Scholar]
- 43.Kojima K, Kuwana Y, Sezutsu H, Kobayashi I, Uchino K, Tamura T, Tamada Y. A New Biosci Biotech Bioch. 2007;71:2943–2951. doi: 10.1271/bbb.70353. [DOI] [PubMed] [Google Scholar]
- 44.Takagi T, Kubo K. Biochim Biophys Acta. 1979;578:68–75. doi: 10.1016/0005-2795(79)90114-4. [DOI] [PubMed] [Google Scholar]
- 45.Swank RT. Anal Biochem. 1971;39:462. doi: 10.1016/0003-2697(71)90436-2. [DOI] [PubMed] [Google Scholar]
- 46.Creighton TE. Proteins: Structures and Molecular Properties. W. H. Freeman & Co; New York: 1993. [Google Scholar]
- 47.Li A, Sowder RC, Henderson LE, Moore SP, Garfinkle DJ, Fisher RJ. Anal Chem. 2001;73:5395–5402. doi: 10.1021/ac010619z. [DOI] [PubMed] [Google Scholar]
- 48.Putnam C. Protein calculator v 3.4. The Scripps Research Institute; USA: [accessed May 20th 2014]. available at http://protcalc.sourceforge.net. [Google Scholar]
- 49.Rammensee S, Slotta U, Schiebel T, Bausch AR. PNAS. 2008;105(18):6590–6595. doi: 10.1073/pnas.0709246105. [DOI] [PMC free article] [PubMed] [Google Scholar]
- 50.Holland C, Urbach JS, Blair DL. Soft Matter. 2012;8:2590–2594. [Google Scholar]
- 51.Wang Y, Rudym DD, Walsh A, Abrahamsen L, Kim HJ, Kim HS, Kirker-Head C, Kaplan DL. Biomaterials. 2008;29(24–25):3415–3428. doi: 10.1016/j.biomaterials.2008.05.002. [DOI] [PMC free article] [PubMed] [Google Scholar]
- 52.Li M, Li J. In: Silk Biomaterials for Tissue Engineering and Regenerative Medicine. Khundu SC, editor. 2014. pp. 330–348. [Google Scholar]


