

Abstract
‘Gain’ of supernumerary copies of the 8q24.21 chromosomal region has been shown to be common in many human cancers1–13 and is associated with poor prognosis7,10,14. The well-characterized myelocytomatosis (MYC) oncogene resides in the 8q24.21 region and is consistently co-gained with an adjacent ‘gene desert’ of approximately 2 megabases that contains the long non-coding RNA gene PVT1, the CCDC26 gene candidate and the GSDMC gene. Whether low copy-number gain of one or more of these genes drives neoplasia is not known. Here we use chromosome engineering in mice to show that a single extra copy of either the Myc gene or the region encompassing Pvt1, Ccdc26 and Gsdmc fails to advance cancer measurably, whereas a single supernumerary segment encompassing all four genes successfully promotes cancer. Gain of PVT1 long non-coding RNA expression was required for high MYC protein levels in 8q24-amplified human cancer cells. PVT1 RNA and MYC protein expression correlated in primary human tumours, and copy number of PVT1 was co-increased in more than 98% of MYC-copy-increase cancers. Ablation of PVT1 from MYC-driven colon cancer line HCT116 diminished its tumorigenic potency. As MYC protein has been refractory to small-molecule inhibition, the dependence of high MYC protein levels on PVT1 long non-coding RNA provides a much needed therapeutic target.
To determine whether low copy-number gain of MYC and/or other genetic element(s) in the 8q24.21 region (PVT1, CCDC26 and GSDMC; Fig. 1a and Extended Data Fig. 1) promotes cancer, chromosome engineering15 (Extended Data Fig. 2) was used to derive mice bearing single-copy gain of (1) Myc alone (Fig. 1b and Extended Data Fig. 2a), (2) Pvt1, Ccdc26 and Gsdmc (Fig. 1c and Extended Data Fig. 2b) and (3) the entire 2-Mb Myc,Pvt1,Ccdc26,Gsdmc syntenic region (Fig. 1d and Extended Data Fig. 2c). All three strains were viable and fertile and showed no overt developmental defect. In human breast and ovarian cancers, gain of 8q24 is often accompanied by ERBB2 amplification16,17. Accordingly, each mutant line was bred to MMTVneu transgenic mice18 and mammary tumour latency was examined. gain(Myc), MMTVneu mice developed mammary tumours at essentially the same median latency (345 days) as MMTVneu mice (Fig. 1e), indicating that a single supernumerary Myc gene is insufficient to promote MMTVneu-driven cancer. Tumour latency of gain(Pvt1, Ccdc26, Gsdmc), MMTVneu mice was also indistinguishable from MMTVneu mice (316 days; Fig. 1e). In contrast, gain(Myc, Pvt1, Ccdc26, Gsdmc), MMTVneu mice showed shorter mammary tumour latency (224 days; Fig. 1e) and increased penetrance (90%) compared with the other three genotypes (40–60%). Compared with age-matched MMTVneu adenomas, gain(Myc, Pvt1, Ccdc26, Gsdmc), MMTVneu tumours presented a high mitotic index involving locally invasive solid masses that invaded adjacent thin-walled blood vessels, consistent with adenocarcinomas (Extended Data Fig. 3a–c). Three out of ten gain(Myc, Pvt1, Cdc26, Gsdmc) mice, but none of gain(Myc), gain(Pvt1, Cdc26, Gsdmc) and wild-type mice (n = 10 for each genotype), developed metastasis in the absence of MMTVneu in a limited-lifespan study (500 days), indicating that gain(Myc, Pvt1, Cdc26, Gsdmc) contributes to spontaneous metastasis in older mice, albeit with low penetrance (Extended Data Fig. 3d, e). These data demonstrate that gain of a single copy of Myc cooperates with one or more genetic element(s) in the Pvt1/Ccdc26/Gsdmc region to promote mammary tumorigenesis.
Figure 1. Gain of Myc promotes tumorigenesis only if downstream sequence is co-gained.
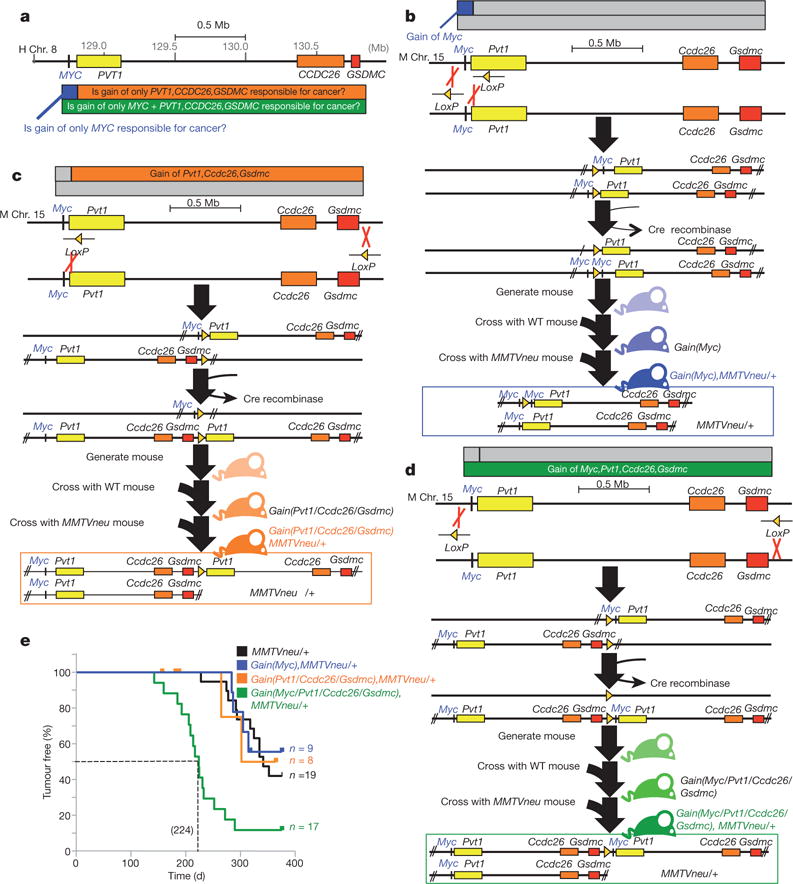
a, Map of an approximately 2 Mb genomic region in 8q24.21 commonly gained in human tumours. Chr., chromosome. b–d, Generation of mice containing gain of Myc (b), gain of Pvt1, Ccdc26 and Gsdmc (c) and gain of Myc, Pvt1, Ccdc26, Gsdmc (d). WT, wild type. e, Mammary tumour-free survival analysis of the different genotypes (***P<0.001, log-rank test, compared with MMTVneu).
The mammary epithelium of 10-week-old gain(Myc, Pvt1, Ccdc26, Gsdmc) mice showed pre-cancerous properties in the absence of MMTVneu, including elevated levels of γ-H2AX (a marker of DNA damage; Fig. 2a), p53 (a key mediator of cellular stress response) and phospho-ERK1/2 (a pro-survival signaling molecule; Extended Data Fig. 4a, b). Accordingly, gain(Myc, Pvt1, Ccdc26, Gsdmc) mammary epithelium showed increased DNA replication (Fig. 2b), reduced oestrogen receptor-α expression19 (Extended Data Fig. 4c) and 5.5 times more lateral ductal branching than wild type (Fig. 2c). gain(Myc) glands showed a more modest twofold increase in branching compared with wild type. Furthermore, gain(Myc, Pvt1, Ccdc26, Gsdmc) mice showed aberrant differentiation, including a precocious alveolar-like phenotype and co-expression of keratin-14 (a myoepithelial marker) with keratin-8, in luminal epithelial cells (Extended Data Fig. 4d, e). Crossing gain(Myc, Pvt1, Ccdc26, Gsdmc) mice with mice carrying a deletion of precisely the same region resulted in mice with two copies of this region on one chromosome 15 homologue and no copy on the other, which completely abolished aberrant cellular proliferation (Fig. 2d) and excessive branching (Fig. 2e). Three copies of the Myc/Pvt1/Ccdc26/Gsdmc region, therefore, produced pre-cancerous phenotypes.
Figure 2. Pre-cancerous phenotypes in mouse gain(Myc, Pvt1, Ccdc26, Gsdmc) mammary glands.
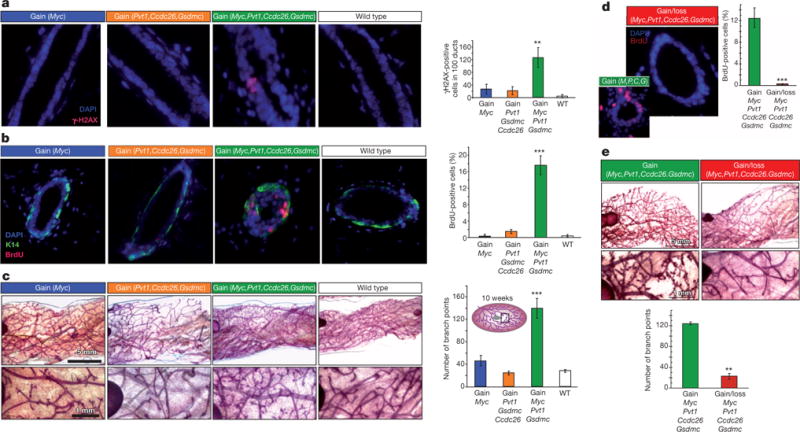
a, b, Fluorescence images and quantification of γ-H2AX foci (a) and BrdU-incorporation (b) in mammary ducts of indicated genotype (n = 3). c, Wholemount analysis of mammary glands (higher magnification, bottom). Inset, schematic of mammary gland. Branch points were enumerated at a 25-mm2 area near the lymph node (n = 3). d, e, Rescue of aberrant proliferation (d), and enhanced lateral branching (e) in the gain(Myc, Pvt1, Ccdc26, Gsdmc) mammary ducts by corresponding loss allele. M, Myc; P, Pvt1; C, Ccdc26; G, Gsdmc (n = 3). Results are shown as mean ± s.e.m. (*P<0.05, **P<0.01, ***P<0.001, two-tailed Student’s t-test). Scale bar on a, b, d, 10 μm; c, e, 1 mm (top), 5 mm (bottom); error bars, s.e.m.
We next sought to identify genetic elements driving gain(Myc, Pvt1, Ccdc26, Gsdmc) neoplasia. Ccdc26 transcript has not been detected in mouse, and Gsdmc expression was low in mouse mammary tissue with no differences in Gsdmc2–4 transcript levels across genotypes (Extended Data Fig. 5). Consequently, we focused on Myc and Pvt1. Cells from two independent gain(Myc, Pvt1, Ccdc26, Gsdmc), MMTVneu mammary tumours were transfected with short interfering RNAs (siRNAs) to knockdown Myc (siMyc), Pvt1 (siPvt1) or both, and grown in three-dimensional culture. siMyc had no effect on Pvt1 RNA levels, and siPvt1 had no effect on Myc messenger RNA (mRNA) (Fig. 3a). Depletion of either Myc or Pvt1 RNA resulted in approximately 60% reduction in proliferation as measured by Ki67 staining (Fig. 3b). Surprisingly, simultaneous knockdown of both Myc and Pvt1 failed to reduce proliferation below individual knockdown of either gene (Fig. 3b), suggesting that Myc and Pvt1 promote proliferation through the same pathway.
Figure 3. Pvt1/PVT1 co-gained with Myc/MYC elevates Myc/MYC protein levels.
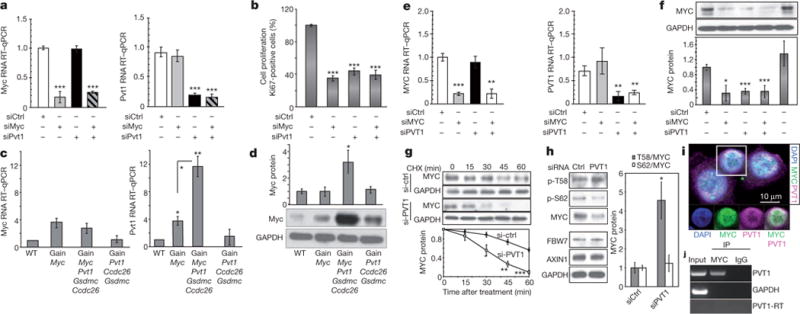
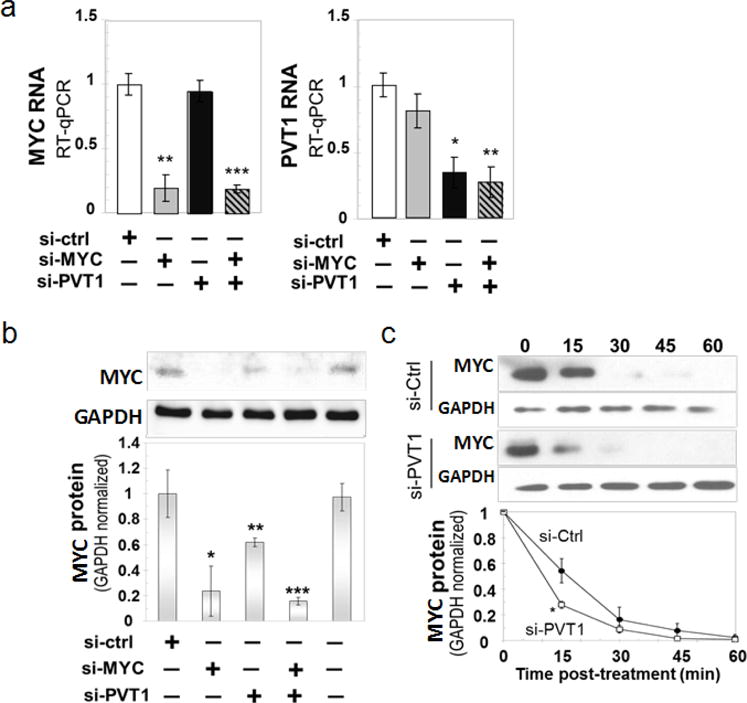
a, RT–qPCR measurement of Myc (left) and Pvt1 (right) RNA levels in gain(Myc, Pvt1, Ccdc26, Gsdmc), MMTVneu/+ mammary tumour cells transfected with indicated siRNAs (n = 3). b, Proportions of primary tumour cells positive for Ki-67 after the indicated siRNA treatments (n = 3). c, RT–qPCR of Myc (left) and Pvt1 (right) transcript levels (n = 3), and d, western blot analysis (top) and quantification (bottom) of Myc protein in mammary tissue (n = 3). GAPDH, Glyceraldehyde 3-phosphate dehydrogenase. e–h, Analyses of human breast cancer cell line SK-BR-3. e, RT–qPCR measurement of MYC (left) and PVT1 (right) transcripts in cells 48 h after transfection with the indicated siRNA(s) (n = 3). f, g, Western blot analysis of the MYC protein in SK-BR-3 after siRNA transfection (n = 3) (f), and siRNA transfection and cycloheximide (CHX) treatment for times indicated (n = 3) (g). h, Western blot analysis of MYC(p-T58), MYC(p-S62), MYC, FBW7 and AXIN1 protein levels in SK-BR-3 treated with siRNAs (left). Ratios of T58/total MYC and p-S62/total MYC (right) (n = 3). i, Immunofluorescence staining of MYC (green) and RNA FISH of PVT1 (magenta) showing nuclear co-localization of MYC and PVT1 (white). 4′,6-Diamidino-2-phenylindole (DAPI) is shown in blue. The marked cell in the upper panel is shown in the lower panels in single channels and MYC + PVT1 overlay. j, RT–PCR using PVT1 and GAPDH specific primers of total SK-BR-3 RNA (input), immunoprecipitated using MYC antibody (IP MYC) and IgG (IP IgG). PVT1–RT indicates samples not treated with reverse transcriptase. Results are shown as mean ± s.e.m. (*P<0.05, **P<0.01, ***P<0.001, two-tailed Student’s t-test). Scale bar, 10 μm; error bars, s.e.m.
Analysis of Myc and Pvt1 expression showed that both gain(Myc) and gain(Myc, Pvt1, Ccdc26, Gsdmc) mammary glands showed approximately 3.5-fold more Myc mRNA than wild type or gain(Pvt1, Ccdc26, Gsdmc) (Fig. 3c). Pvt1 mRNA levels were approximately 1.5 times higher in gain(Pvt1, Ccdc26, Gsdmc) than wild type, as expected, but were surprisingly tenfold elevated in gain(Myc, Pvt1, Ccdc26, Gsdmc) and fourfold increased in gain(Myc) mammary glands (Fig. 3c). Because MYC protein is a transcriptional activator of PVT1 (refs 20, 21), this result suggested higher levels of Myc protein and/or activity in gain(Myc, Pvt1, Ccdc26, Gsdmc). Threefold higher Myc protein levels were observed in gain(Myc, Pvt1, Ccdc26, Gsdmc) mammary gland compared with the other three strains (Fig. 3d). Thus, a third copy of Myc + Pvt1 increased Pvt1 transcription and Myc protein in mice.
To extend these findings to high-8q24.21 copy cancers, we examined human breast-cancer cell lines SK-BR-3 and MDA-MB-231, which harbour high copy gains3. siMYC and siPVT1 had no effect on PVT1 and MYC RNA, respectively (Fig. 3e), but reduced proliferation to similar extents with combined siMYC + siPVT1 failing to reduce proliferation further (Extended Data Fig. 6a, b). Furthermore, siPVT1 led to suppression of MYC protein levels (Fig. 3f), verifying that MYC protein levels are dependent upon PVT1 mRNA in high-copy 8q24-gain cancer cells. Knockdown of individual microRNAs (miRNAs) encoded in the human PVT1 introns had no detectable effect on proliferation (Extended Data Fig. 6c, d).
The half-life of MYC protein is increased in SK-BR-3 and MDA-MB-231 cells compared with non-transformed breast epithelial cells22. To determine whether MYC protein stability is PVT1-RNA dependent, SK-BR-3 and MDA-MB-231 cells were transfected with siPVT1 or control siRNA and exposed to cycloheximide. PVT1 depletion resulted in more rapid loss of MYC protein than control cells (Fig. 3g and Extended Data Fig. 7). MYC protein degradation is promoted by phosphorylation at threonine 58 (ref. 23), and mice expressing MycT58A show enhanced mammary gland density, and mammary carcinoma24. Although siPVT1-mediated reduction of MYC protein levels was not accompanied by changes in levels of FBW7 and AXIN1, which are key downstream components of MYC degradation, T58 phosphorylation was increased fivefold (Fig. 3h). Thus, MYC is protected from phosphorylation at the T58 residue and subsequent degradation in a PVT1-RNA-dependent manner, raising the possibility of a MYC/PVT1 ribonucleoprotein complex. Simultaneous RNA fluorescence in situ hybridization (FISH) to detect PVT1 and immunofluorescence for MYC showed nuclear co-localization in 85.1% of SK-BR-3 cells (Fig. 3i and Extended Data Fig.8). Furthermore, immunoprecipitation using anti-MYC followed by PCR with reverse transcription (RT–PCR) identified PVT1 RNA in the immunoprecipitates (Fig. 3j), suggesting that PVT1 and MYC physically interact directly or indirectly. Whether specific PVT1 isoform(s), CCDC26 and GSDMC promote malignancy remains to be investigated. Together, these results indicate that gain of the Myc/MYC gene alone fails to increase MYC protein levels but that co-gain of the Pvt1/PVT1 gene disrupts Myc/MYC instability, resulting in increased protein levels and enhanced proliferation.
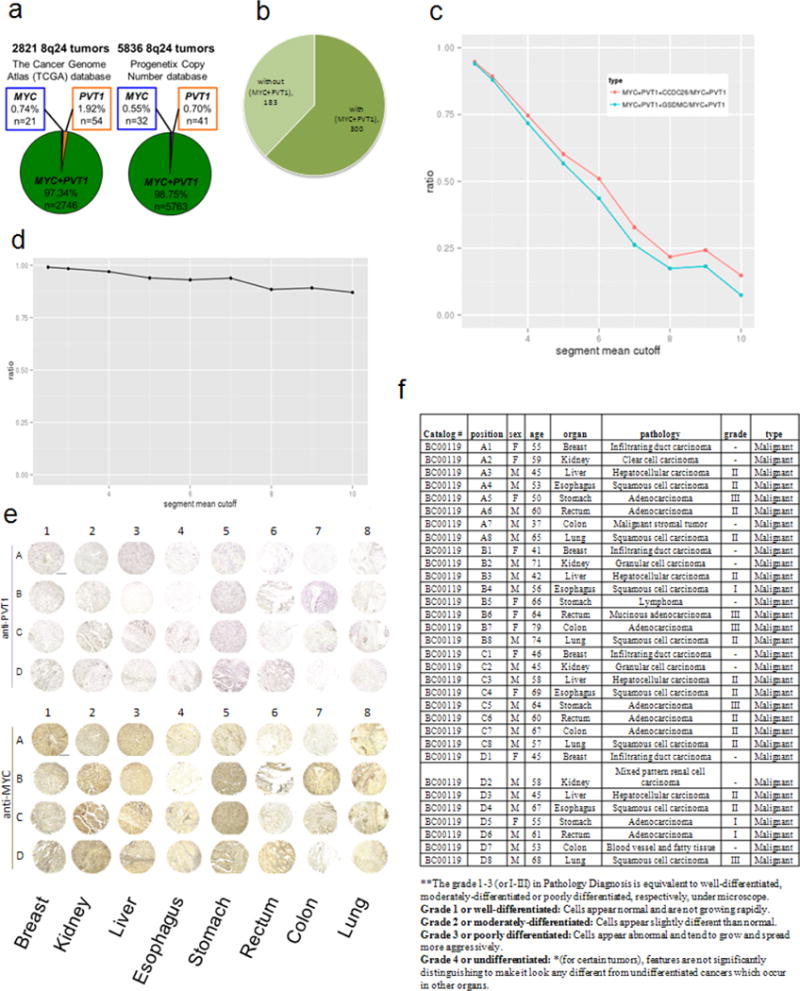
If PVT1 copy increase is critical for high MYC protein levels, then co-gain of PVT1 should be mandatory in MYC-driven cancer. Analysis of 30,681 tumours from the Progenetix copy-number database showed that 18.8% (5,836 tumours) showed increased 8q24 copy number and 5,763 out of 5,836 of these tumours (98.7%) had increased copy number of both MYC and PVT1 genes. Similarly, analysis of 15,241 tumours from The Cancer Genome Atlas (TCGA) database showed that 18.02% (2,821 tumours) showed 8q24 copy-number increase and that 2,746 out of 2,821 tumours (97.34%) showed co-gain of both MYC and PVT1 whereas fewer than 0.15% of tumours showed increased copy number of MYC but not PVT1 (Fig. 4a and Extended Data Fig. 9a). Sorting TCGA tumours by cancer type showed differences in the incidence of 8q24 copy-number increase in individual cancer types ranging from MYC + PVT1 increase in almost half of ovarian and oesophageal carcinomas to essentially no MYC and/or PVT1 increase among papillary thyroid tumours (Fig. 4b). Gain of MYC and PVT1 was observed in 62% of 483 HER2+ breast cancer samples (Extended Data Fig. 9b). Unlike mouse, GSDMC orthologues are expressed in human mammary tissue (http://www.genecards.org/cgi-bin/carddisp.pl?gene5GSDMC). Although gain of MYC + PVT1 + CCDC26 + GSDMC prevailed in low copy-number gain of 8q24 segments, co-gain of MYC + PVT1 (but not CCDC26 or GSDMC) prevailed in high copy amplifications (Extended Data Fig. 9c, d). Co-gain of MYC and PVT1, therefore, dominated over gain of MYC alone across all cancer types showing 8q24 copy-number increases.
Figure 4. PVT1 dependence in MYC-driven tumours.
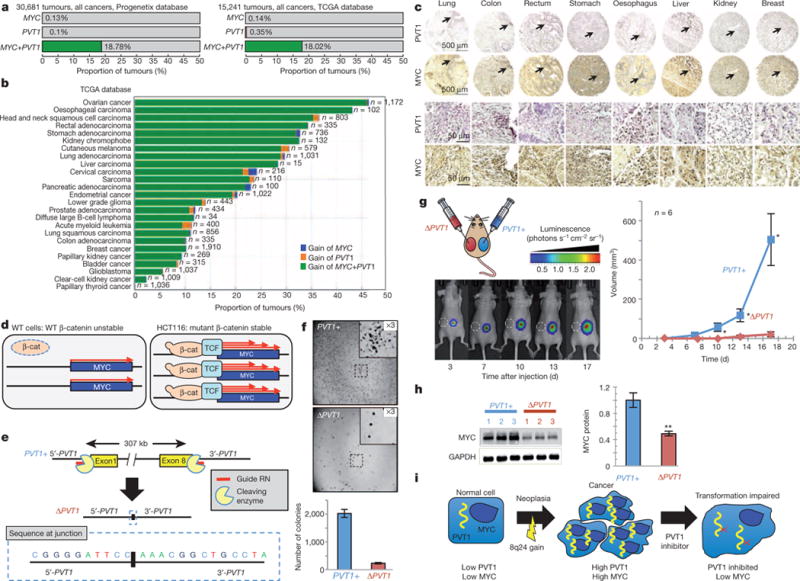
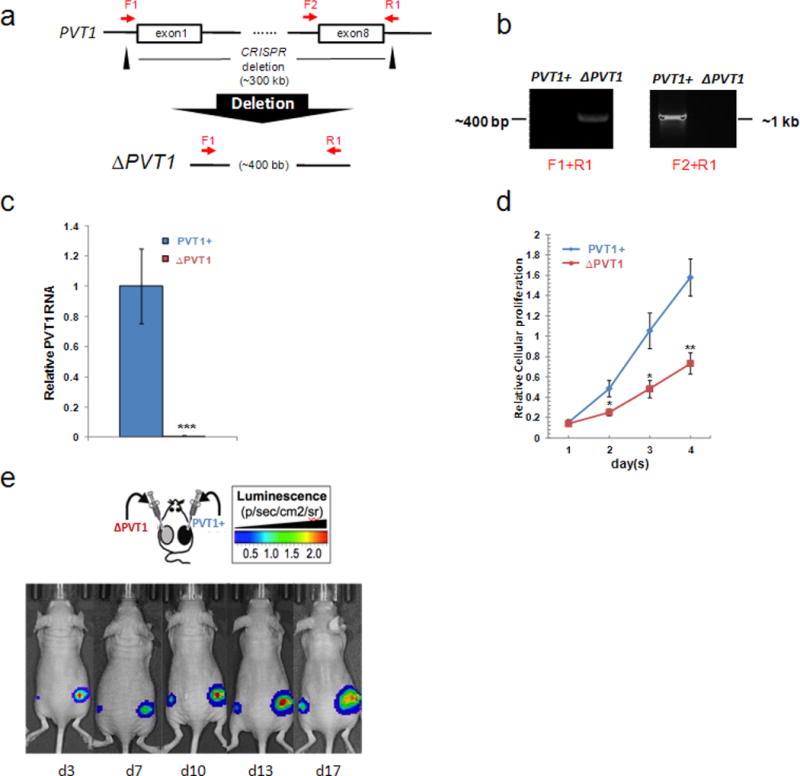
a, b, Proportion of all tumours harbouring gain of MYC but not PVT1 (blue), PVT1 but not MYC (orange) and MYC + PVT1 (green) in the Progenetix (left) and TCGA databases (right) (a) and among different cancer types in the TCGA database (b). c, Tissue microarray analysis showing nuclear expression of PVT1 (dark purple) and MYC (dark brown) in primary human tumours. Lower panels represent × 10 magnification of regions shown by arrow in the upper panel. d, Cartoons showing that stabilized mutant β-catenin (β-cat) upregulates MYC transcription through the recruitment of T-cell factor (TCF) in human colorectal cancer line HCT116. e, Schematic of CRISPR-mediated excision of PVT1 to obtain the ΔPVT1 allele. DNA sequence of a PCR amplicon containing the junction sequence of the deletion product is shown. f, Images of colonies formed by PVT1+ and ΔPVT1 HCT116 cells in soft agar assay (top). The insets are ×3 magnification of the areas marked in each plate. Quantification of the respective colonies (bottom, n = 3). g, Tumour volume measurements from xenograft transplants of PVT1+ and ΔPVT1 HCT116 cells. Bioluminescent imaging at 3, 7, 10, 13 and 17 days after inoculation (left). ΔPVT1 HCT116 inoculation at the left flank where the tumour failed to grow is designated by white circle (dashed). Mean tumour volumes are quantified (n = 6) (right). h, Western blot of MYC and GAPDH protein in three PVT1+ and ΔPVT1 HCT116 clones. Quantification of relative MYC protein levels in PVT11 and PVT1D HCT116 cells is shown (n = 3). i, Predicted outlook for an 8q24 cancer patient after inhibition of PVT1. Results are shown as mean ± s.e.m. (*P<0.05, **P<0.01, ***P<0.001, two-tailed Student’s t-test). Scale bar, 500 μm (c, top two rows of panels), 50 μm (c, bottom two rows of panels); error bars, s.e.m.
To verify these findings, we examined tissue microarrays for PVT1 RNA using in situ hybridization and MYC protein using immunohistochemistry on serial sections of human lung, colon, rectum, stomach, oesophagus, liver, kidney and breast tumours. Concurrent PVT1 RNA and MYC protein expressions were found in all eight cancers (Fig. 4c and Extended Data Fig. 9e, f), confirming that PVT1 RNA and the MYC protein are correlated in primary tumours.
Finally, effects of PVT1 loss on MYC-driven tumours were assessed using HCT116 human colorectal carcinoma cells, which harbour low copy-number 8q24 gain and stable mutant β-catenin leading to MYC overexpression (Fig. 4d)25. CRISPR-associated nuclease (Cas9) was used to excise precisely all copies of the PVT1 gene (Fig. 4e and Extended Data Fig. 10a, b) generating PVT1-null (ΔPVT1) HCT116 cell lines (Extended Data Fig. 10c). ΔPVT1 lines demonstrated reduced proliferation (Extended Data Fig. 10d) and impaired colony formation in soft agar compared with PVT1 + HCT116 cells (232.2 ± 23.8 versus 2,022.3 ± 140.7 colonies; Fig. 4f). In xenograft studies, ΔPVT1 HCT116 cells either failed to formtumours (three out of six xenografts; Fig.4g) or showed markedly reduced volume (three out of six xenografts; Extended Data Fig. 10e) compared with PVT1+ counterparts (Fig. 4g). Finally, MYC protein was significantly reduced (49.1% ± 3.4) in ΔPVT1 HCT116 clones compared with PVT11 HCT116 cells (Fig. 4h). PVT1 therefore regulates MYC protein level, and bestows tumorigenic potential to an MYC-driven non-breast cancer line.
Targeting MYC directly with therapeutic interventions has proved challenging26–28; thus regulation of high MYC protein levels by the PVT1 long non-coding (lncRNA) bears considerable implications for therapeutic treatment of MYC-driven cancers. Because MYC is an important transcription factor and an essential protein27, direct inhibition may have severe effects on patients. Our findings indicate that PVT1 lncRNA increases MYC protein levels in 8q24-gain cancers and that loss of PVT1 RNA reduces MYC protein to more normal levels. PVT1, therefore, may be a more accessible and less deleterious target than MYC itself for curtailing MYC-driven cancers (Fig. 4i). Future studies on the role of PVT1 on the MYC protein level in cancers without supernumerary 8q24 and illuminating the molecular details of MYC/PVT1 cooperation may lead to rational drug discovery specifically targeting the MYC/PVT1 axis in human cancers.
METHODS SUMMARY
Chromosome engineering on mouse AB2.2 embryonic stem cells was as previously described29 (Extended Data Fig. 2). Mouse mammary glands were analysed as described30. Tissue microarray slides of human multiple-organ tumours (BC00119) were obtained from US Biomax. For copy-number analysis of TCGA tumours, data were derived from the Affymetrix Genome Wide Human SNP Array 6.0 platform from the open-access directory of TCGA (https://tcga-data.nci.nih.gov/tcgafiles/ftp_auth/distro_ftpusers/anonymous/tumor/). CRISPR-mediated ΔPVT1 HCT116 cells were generated using piggyBac co-transposition enrichment.
METHODS
Mouse strains and tumour analysis
Correctly targeted df/dp embryonic stem clones were injected into C57BL/6J blastocysts to establish chimaeric mice. The F1 dp/+ progeny generated from chimaera crossed with C57BL/6J were genotyped by PCR and backcrossed three times to FVB/N mice. For tumour analysis, dp/+ mouse strains were crossed with FVB/N-Tg (MMTVneu) 202Mul/J transgenic mice (purchased from The Jackson Laboratory) to generate the control (hemizygous MMTVneu) and experimental (gain, hemizygous MMTVneu) animals. After 4 months, these mice were monitored weekly by palpation for tumour induction. Tumours were documented in a double-blinded manner. Animal protocols were approved by the Institutional Animal Care and Use Committee of University of Minnesota and were conducted in accordance with the procedures in the Guide for Care and Use of Laboratory Animals (IACUC code number 1206A16225). We calculated our sample size for a power of 0.80 of a significance level of 0.05 for pre-specific effect size. The occurrence of spontaneously developing mammary tumour in a group of MMTVneu transgenic mice was 70% (pc = 0.7) and we wished to test whether a group of gain(Myc, Pvt1, Ccdc26, Gsdmc), MMTVneu mice could reduce the tumour latency by at least 20% (pe = 0.20), with a power of 80% and a significance level of 5%. Then d = 0.5 and C = 7.85 (formula: n = [C(pc × qc + pe × qe)/d2 + 2/d + 2], where qc = 1 − pc, qe = 1 − pe and d = |pc − pe|β). All animals were included. Each animal was assigned to its cohort as determined by its genotype. The animals were housed randomly and monitored for tumour induction in a double-blinded fashion. The tumour latency study was done in a double-blinded fashion, where the animals were assigned numbers instead of their genotypes. After the tumour study, the numbers were replaced with their respective genotypes.
Mammary gland isolation, wholemounts and measurement of mammary ductal branching
Ten-week-old virgin mice were killed for dissecting mammary glands. Mammary glands from at least three mice per genotype were analysed. For the mammary ductal branching studies, inguinal (No. 4) mammary glands were spread out, fixed in 4% paraformaldehyde (Merck) for 2 h, then stained.Images were acquired using Leica Application Suite software on a Leica dissecting microscope and analysed using Adobe Photoshop and ImageJ software. The number of ductal branch points was measured from the 25-mm2 area near the lymph node of the mammary gland. All experimental mice and control mice were littermates with matching oestrous cycles.
Histological analysis and tissue immunofluorescence staining
We analysed paraffin sections of paraformaldehyde-fix (4%) mammary glands and tumours stained with haematoxylin and eosin. For immunofluorescence analyses, 5-μm sections were de-paraffinized and rehydrated, and antigens were retrieved using the Antigen Unmasking Solution (Vector Laboratories). Section samples were washed with PBS and blocked using M.O.M. Basic Kit (Vector Laboratories) or 10% normal goat serum for 1 h. Primary antibodies were incubated for overnight at 4 °C. For proliferation assays, mice were injected with 100 mg kg−1 BrdU drug (Sigma) 2 h before being killed, tissues were stained with anti-BrdU (Abcam, ab1893) at 1:300 dilution as described previously31 and sections were counterstained with DAPI (Invitrogen). Other primary antibodies were diluted with M.O.M. diluent using the following conditions: cytokeratin 8 (1:100, Epitomics, 2032-1), cytokeratin 14 (1:150, Covance, PRB-155P), oestrogen receptor alpha (ERα) (1:50, Santa Cluz Biotechnology, sc-542) and γ-H2AX (1:100, Cell Signaling, 2577). Each staining was performed in mammary gland sections dissected from at least three mice of experimental groups and the control group. Fluorescent images were acquired using fluorescence microscopy (Carl Zeiss Axio Obersever.Z1).
Cell culture and reagents
Primary mouse tumour cells or primary mouse mammary epithelial cells were dissociated from mammary tumours or mammary glands by incubation with collagenase type I (Invitrogen) for 3 h and then plated on fetuin (Sigma) in growth media (DMEM/F12 containing 10% fetal bovine serum (FBS, Gibco), 5 μg ml−1 insulin (Sigma), 1 μg ml−1 hydrocortisone (Sigma), 5 ng ml−1 EGF (Sigma) and 200 U ml−1 penicillin/streptomycin (Invitrogen)) as described previously30. After 3 days, mammary epithelial cells and tumour cells were collected and stored at −80 °C for further experiments. Only early passages of tumour cells were used for advanced assays. Human breast cancer cell lines SK-BR-3 and MDA-MB-231 were obtained from the American Type Culture Collection. SK-BR-3 was short tandem repeat profiled (https://www.atcc.org/Products/All/HTB-30.aspx#A7931A04156C4C7FA40828AEF707302F) and Mycoplasma tested. MDA-MB-231 was also short tandem repeat profiled and Mycoplasma tested (https://www.atcc.org/Products/All/HTB-26.aspx#A7931A04156C4C7FA40828AEF707302F) SK-BR-3 and MDA-MB-231 cells were cultured in McCoys5A (Lonza) containing 10% FBS and DMEM (Invitrogen) containing 10% FBS respectively. Human colorectal cancer cell line HCT116 was a gift from D. Largaespada. These cells were cultured in ATCC-formulated McCoy’s 5a Medium Modified (catalogue number 30–2007) supplemented with 10% FBS.
RNA isolation, reverse transcription and RT–qPCR analysis
Mouse mammary glands were removed at 6 and 10 weeks of age and immediately stored in the liquid nitrogen. Frozen mammary tissue lysates were prepared in Trizol Reagent (Invitrogen) by using the SHREDDER SG3 system (Pressure BioSciences) as described by the manufacturer. Cell lysates were collected from six-well plates. RNA was isolated from the Trizol Reagent (Invitrogen), including a DNase digestion step (Qiagen), as described by the manufacturer. Total RNA was quantified by NanoDrop (Thermo Fisher). RNA quality was estimated by running RNA on agarose gels. Complementary DNA (cDNA) was synthesized from equal amounts of total RNA and followed the manufacturer’s protocol using SuperScript III reverse transcriptase (Invitrogen) with Random Hexamer primers. For qPCR, the 50 ng of cDNA was added in reactions performed on an ep realplex S machine (Eppendorf) using SYBR Green Master Mix (Promega) and gene-specific primers (Supplementary Table 4). Primers for all amplification were designed the location on exon–exon borders by using Primer3 software. We used melting curve analysis to confirm the specificity of primers. Amplifications were done as technical duplicates and biological triplicates in 96-well plates.
Western blot analysis
Mouse mammary tissues were collected as above and protein extracted by using the SHREDDER SG3 system (Pressure BioSciences) in RIPA lysis buffer (50 mM Tris-HCl pH 7.5; 150 mM NaCl; 1 mM EDTA; 1% Triton-X-100; 0.5% sodium deoxycholate; 0.1% SDS) with Complete Protease Inhibitor Cocktail (Roche Applied Science). Cell lysates were also prepared in RIPA buffer at the indicated time points. Lysates were centrifuged at 18,620g at 4 °C for 30 min, supernatants were collected, and protein was quantified with a Bio-Rad protein assay kit. Equal amounts of protein were loaded and analysed by SDS–polyacrylamide gel electrophoresis. Immunoblotting was done using the following: c-Myc (Abcam, ab32), T58 (Abcam, ab85380), S62 (Abcam, ab51156), FBW7 (Novus Biologicals NBP1-59631), AXIN1 (Cell Signaling, 2087), GAPDH (Cell Signaling, 5174), pERK1/2 (Cell Signaling, 4370), ERK1/2 (Cell Signaling,4695) and P53(Cell Signaling, 2524).
siRNAtransfections and three-dimensional culture
siRNA against human PVT1 and MYC as well as mouse Pvt1 and Myc were designed and purchased from FlexiTube siRNA (Qiagen). Two siRNAs located different parts of the PVT1/Pvt1 mRNA sequence (Hs_PVT1_5 FlexiTube siRNA and Hs_PVT1_6 FlexiTube siRNA; Mm_Pvt1_1 FlexiTube siRNA and Mm_Pvt1_4 FlexiTube siRNA) and two siRNAs located different parts of the MYC/Myc mRNA sequence (Hs_MYC_5 FlexiTube siRNA and Hs_MYC_7 FlexiTube siRNA; Mm_Myc_1 FlexiTube siRNA and Mm_Myc_4 FlexiTube siRNA) were used in this study. A predesigned siRNA (All Stars Negative Control siRNA, Qiagen) was used for the negative control and conjugated with Alexa Fluor 488 to confirm the transfection efficiency. Approximately 2 × 10⁵ cells were plated to each well of a six-well plate 24 h before the transfection procedure; the cell confluency of each well was 50%. siRNA transfection was applied with DharmaFECT 4 (Thermo Scientific) following the manufacturer’s protocol. Cells were collected for RNA isolation 48 h after transfection and for protein extraction 72 h after transfection. siRNA (5 μM) was tranfected into cells. Each experiment was repeated at least three times. For the Ki67 proliferation assay, cells were trypsinized from the well of a six-well plate 24 h after transfection, and 1 × 10⁴ cells were re-plated in the three-dimensional on-top culture system to grow for 72 h. For the three-dimensional culture procedure, a total 1 × 10⁴ cells were plated on growth-factor reduced matrigel (BD Bioscience) in the eight-well chamber slide as described previously32. Mouse mammary epithelial cells were maintained in growth media with 2% matrigel for observing the morphology and measuring the size of acinus-like structures.
Ki67 proliferation assay
We performed cell proliferation assays in breast cancer cell lines as previously described33. In brief, cells were directly fixed in eight-well chamber slides with 4% paraformaldehyde after siRNA treatments for 96 h. Cells were blocked and stained with Ki67 antibody (1:500, Vector Laboratories) and then counterstained with DAPI for the total number of cells as described previously32. Ki67 index was assessed by counting the proportion of Ki67-positive cells. The number of Ki67-positive cells was scored by eye and divided by the total number of cells. The number of total nuclei counted per well was above 500 for each experimental assay.
Double fluorescent detection of MYC protein and PVT1 mRNA in SK-BR-3 cells
SK-BR-3 cells were fixed with 4% paraformaldehyde overnight, washed with PBS and then dehydrated. After rehydration, in situ hybridization was performed with fluorescein-labelled PVT1 probe (cDNA clone IMAGE:5517530, Open Bio-systems) according to a standard procedure34, followed by goat anti-MYC antibody (AF3696, 10 μg ml−1, R&D Systems) reaction at 4 °C overnight. The samples were treated with Alexa Fluor 594 anti-Fluorescein/Oregon Green (Invitrogen; A11091, 1:100) and Alexa Fluor 488 anti-goat IgG (Invitrogen; A11055, 1:1,000), and counterstained with DAPI. Fluorescent signals were detected using a Zeiss LSM 710 laser scanning microscope system (Carl Zeiss Microscopy) and analysed by ZEN2009 software (Carl Zeiss Microscopy). Because the sense PVT1 probe detected some nuclear signal, albeit much weaker than the antisense probe, it is possible that the observed PVT1 FISH staining could have contained some non-specific nuclear staining.
Tissue microarray analysis
Human multiple organ tumour tissue microarray slides (BC00119) were obtained from US Biomax. In situ hybridization used digoxigenin-labelled PVT134 probe according to a standard procedure34 and counterstaining with nuclear fast red. MYC immunohistochemistry was done using anti-MYC antibodies HRP-conjugated rabbit anti-goat IgG (Bio-Rad, 172-1034, 1:500), and visualized by a peroxidase substrate kit (Vector Laboratories, SK-4105).
RNA-immunoprecipitation analysis
RNA-immunoprecipitation analysis using anti-MYC or preimmune IgG (negative control) antibody was performed as described before35 using Immunoprecipitation Kit Dynabeads Protein G (Invitrogen). Twenty million SK-BR-3 cells were used to generate 2–5 mg of total protein per RNA-immunoprecipitation.
MYC and PVT1 gain across human cancers
Copy-number gain of MYC, PVT1 or MYC 1 PVT1 in human tumours was assessed by examining the copy-number data from the TCGA and Progenetix genomic copy-number aberration databases. For TCGA, the copy-number variation results (level 3) derived from Affymetrix Genome Wide Human SNP Array 6.0 platform for 15,888 tumour samples were downloaded from TCGA’s open-access HTTP directory (https://tcga-data.nci.nih.gov/tcgafiles/ftp_auth/distro_ftpusers/anonymous/tumor/). For Progenetix, the chromosomal regions with copy-number aberration derived from chromosomal comparative genomic hybridization and array comparative genomic hybridization for 30,681 tumour samples were downloaded from the Progeneix website (http://www.progenetix.org/). For each sample, we cross-compared the loci of three MYC exons (chromosome 8: 128748314–128748868, chromosome 8: 128750493–128751264 and chromosome 8: 128752641–128753679) and eight PVT1 exons (chromosome 8: 128902873–128903243, chromosome 8: 128951753–128951921, chromosome 8: 128996149–128996449, chromosome 8: 129001407–129001536, chromosome 8: 129082405–129082517, chromosome 8: 129108763–129108899, chromosome 8: 129111615–129111818 and chromosome 8: 129113225–129113498), with chromosomal regions having copy gains. For TCGA, segmentation mean value was greater than 0.22; and for chromosomal comparative genomic hybridization and array comparative genomic hybridization data from Progenetix, the regions with segvalue 1 were considered as copy gains. Overlapped exon(s) were recorded.
Co-gain of MYC + PVT1 + CCDC26 + GSDMC in low versus high copy-number gain of 8q24
We investigated the relationship between ratio of MYC + PVT1 + CCDC26 or MYC + PVT1 + GSDMC co-amplification on MYC + PVT1 co-amplification at different amplification levels on TCGA data. The level 3 copy-number variation data from TCGA provided a log-ratio-based mean copy-number estimate of segments covering genomic regions (inferred from the Affymetrix Genome Wide Human SNP Array 6.0 platform). We used segment mean 0.32 (2.5 copies) as a cutoff for copy gains. The Progenetix database did not provide such a distinction between amplification levels.
Generating ΔPVT1 HCT116 cells
The human-codon-optimized Cas9 cDNA and chimaeric guide RNA (gRNA) were acquired from Addgene (41815 and 41824). Cas9 was PCR amplified and cloned into pENTR221 using SnaBI and XbaI sites engineered into the PCR primers. pENTR221 was then transferred to pT3.5-CAG-DEST by standard LR Clonase (Invitrogen) reaction, following the manufacturer’s instructions. The chimaeric gRNA was PCR amplified and cloned into pENTR221 using SnaBI and XbaI. gRNAs targeting the 5′ and 3′ ends of PVT1 were designed using Zfit software (http://zifit.partners.org/ZiFiT/). gRNAs targeting PVT1 were generated using inverse PCR of pENTR221-gRNA using the common reverse primer 5′-CGGTGTTTCGTCCTTTCCAC-3′, and target specific forward primer for the 5′ end (5′-CATCACCGGGGATTCCCTCGTTTTAGAGCTAGAAATA GC-3′) and 3′ end (5′-GCCTGGAGGCCAGCTCAAAGTTTTAGAGCTAGAAATAGC-3′) of PVT1 using Accuprime Pfx Supermix (Invitrogen), following the manufacturer’s instructions. Purified PCR products were then treated with polynucleotide kinase and T4 Ligase (New England Biolabs), following the manufacturer’s instructions. New gRNAs were sequence verified by standard Sanger sequencing.
CRISPR-mediated ΔPVT1 HCT116 cells were then generated using piggyBac co-transposition enrichment as described36. Briefly, cells were NEON electroporated with 2 μg each of hCas9 and the 5′ and 3′ PVT1 gRNA in addition to the 500 ng each of PB7 transposase and PB-CAG-Luc (puro) transposon vector. CRISPR treated cells were then incubated at 37 °C for 3 days. Cells were then seeded at varying densities (100–1000 cells per well) in 96-well plates with Puromycin containing DMEM media. Wells that produced single colonies were expanded and DNA extracted. Clones were then genotyped for deletion of PVT1 using standard PCR genotyping (primer sequences are provided). Identified wild-type clones were used as controls.
Proliferation, soft agar and xenograft assay for PVT1+ and ΔPVT1 HCT116 cells
The proliferation assay used CellTiter 96 AQueous One Solution Cell Proliferation Assay (MTS) (Promega G3580) according to the manufacturer’s instructions. Two thousand cells were seeded per well. Three independent clones for each genotype were used for the study in triplicate (n = 3).
Soft agar and xenograft assays for PVT1+ and ΔPVT1 HCT116 cells were performed using established protocol37. For the soft-agar anchorage-independent colony-formation assay, experiments were performed intriplicate. Three independent clones from each genotype were used. Three thousand cells per plate were seeded in soft agar. Colonies were allowed to grow for 2 weeks and then fixed in 10% formalin containing 0.005% crystal violet for 1 h at 25 °C. After removing formalin, colonies were imaged on a Leica S8 AP0 microscope. Twelve images for each plate were taken and the colonies counted by using ImageJ software.
For xenograft assay, 2 × 10⁶ ΔPVT1 HCT116 and approximately equal numbers of PVT1 + HCT116 were injected subcutaneously on the left and the right flank of a nude mouse respectively. Six nude mice were used for the study. Tumour growth was monitored on the indicated days by bioluminescence using a Xenogen IVIS spectrum system, after delivering 100 μl of 28.5 mg ml−1 luciferin by intraperitoneal injection. The tumour volumes were measured by using electronic calliper (length × width × height).
Eliminating bias by blinded analysis
All analyses were in a double-blinded fashion.
Statistical analysis
For tumour-free survival curves, statistical analyses used Prism 4 (GraphPad Software), and P values were calculated by the log-rank test. All other P values were calculated using Student’s t-test (unpaired, two-tailed, P<0.05 was considered significant). Results are reported as mean ± s.e.m. or mean ± s.d. The biological replicates for each experiment are represented in the figure legends. All technical replicates were performed three times.
Oligonucleotide sequences
Linker: GsdmcR-linker-F: CGGCCAATGCGGCC GCTATG; GsdmcR-linker-R: CTAGCATAGCGGCCCGCATTGGCCGA; Gene targeting: GsdmcR-5S1: GGAAGAGCGCCCAATACGCAA; GsdmcR-gap-S1′: GTAACCGTACCCACTCATGCAA; GsdmcR-5S2: GGACAGTTTCCACCACT GTCAA; GsdmcR-gap-S2′: GTGGGTACGGTTACAGTGATGAA; MycL-3S1: A GGCTGCGCAACTGTTGGGAA; MycL-gap-S1′: GGAATACTGGTCACATCT GCCTT; MycL-3S2: GTTGCCAGCCATCTGTTGTT; MycL-gap-S2′: AGCTTC TCATTTACTAACGGCAA;MycR-3S1:AGGCTGCGCAACTGTTGGGAA;MycR-gap-S1′: TGAAGCCTGGGCTAGAGATG; MycR-3S2: GTTGCCAGCCATCTG TTGTT; MycR-gap-S2′: GGAAGGGGAAGTGGATAGGA; MycL-5S1: GGAA GAGCGCCCAATACGCAA; MycL-gap-S1′: GGAATACTGGTCACATCTGC CTT; MycL-5S2: GGACAGTTTCCACCACTGTCAA; MycL-gap-S2′: AGCTTC TCATTTACTAACGGCAA; Mouse genotyping: Myc-Gsdmc-dp-F: AACTGGC TGAGTGACGCCCTTTAT; Myc-Gsdmc-dp-R: TGAGACGTGCTACTTCCA TTTGTC; Myc-Gsdmc-df-F: ATCCAGCAGGTCAGCAAAGA; Myc-Gsdmc-df-R: CTGGCGTCGTGATTAGTGATG; Myc-dp-F: ATCCAGCAGGTCAGCAAAGA; Myc-dp-R: CTGGCGTCGTGATTAGTGATG; Pvt1-Gsdmc-dp-F: AAC TGGCTGAGTGACGCCCTTTAT; Pvt1-Gsdmc-dp-R: TGAGACGTGCTACT TCCATTTGTC; qPCR: Mus-Myc-F: GCATGAGGAGACACCGCCCA; Mus-Myc-R: GGTTTGCCTCTTCTCCACAGA; Mus-Pvt1-F: CTCAGCAGATGTCA CACAGACG; Mus-Pvt1-R: AGGGTCAGTATCATGGCTGGAT; Mus-Gsdmc-F: CCAGTTGGATTTACCCTTCTGC; Mus-Gsdmc-R: GCCTTCAGTTTCTGGG ATATGG; Mus-Gsdmc2F: GTCCAGTATCCTGTCCATGCTC; Mus-Gsdmc2R: TATGCCCCAACTGATTCAACTC; Mus-Gsdmc3F: TCTGCATGACCTGATG AAAATG; Mus-Gsdmc3R: AGAATCCTTTCGAAGCTCATCC; Mus-Gsdmc4F: AAAGGATTCTAGCACCCCACAT; Mus-Gsdmc4R: CCAGCAGACAGAGTT GGGTATC; Mus-β-actin-F: AGAGCTATGAGCTGCCTGACG; Mus-β-actin-R: GTTTCATGGATGCCACAGGAT; Hu-c-MYC-F: AGCTGCTTAGACGCTGGATTTT; Hu-c-MYC-R: TCGAGGTCATAGTTCCTGTTGG; Hu-PVT1-F: GCC CCTTCTATGGGAATCACTA; Hu-PVT1-R: GGGGCAGAGATGAAATCGTAAT; Hu-GSDMC-F: TCAGAGACAGAGGGGCTCTACA; Hu-GSDMC-R: GT TGGAAGTCACTCAGCACCAT; Hu-B-ACTIN-F: GGTGAAGGTGACAGCA GTCG; Hu-B-ACTIN-R: TTTAGGATGGCAAGGGACTTC; CRISPR/HCT116 genotyping; F1: AAGAGGCGCTCAGATCACTG; F2: GTCATCCCCTCTCTCATCCA; R1: GGCTTCGACCAAGAAGTGAG.
Extended Data
Extended Data Figure 1.
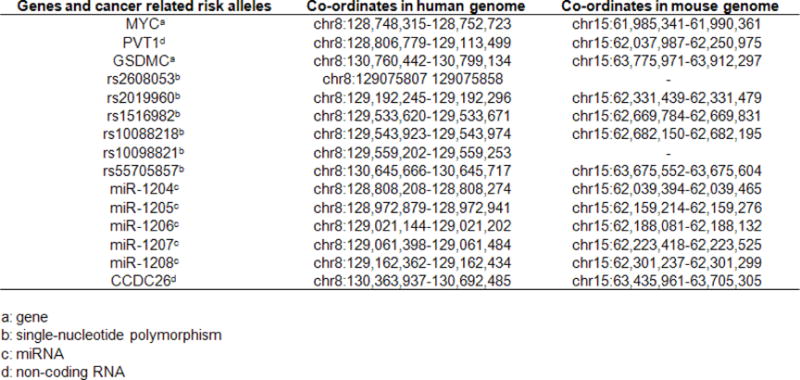
Genetic elements shared between human and mouse in the MYC–GSDMC interval.
Extended Data Figure 2. Generating the mouse strains.
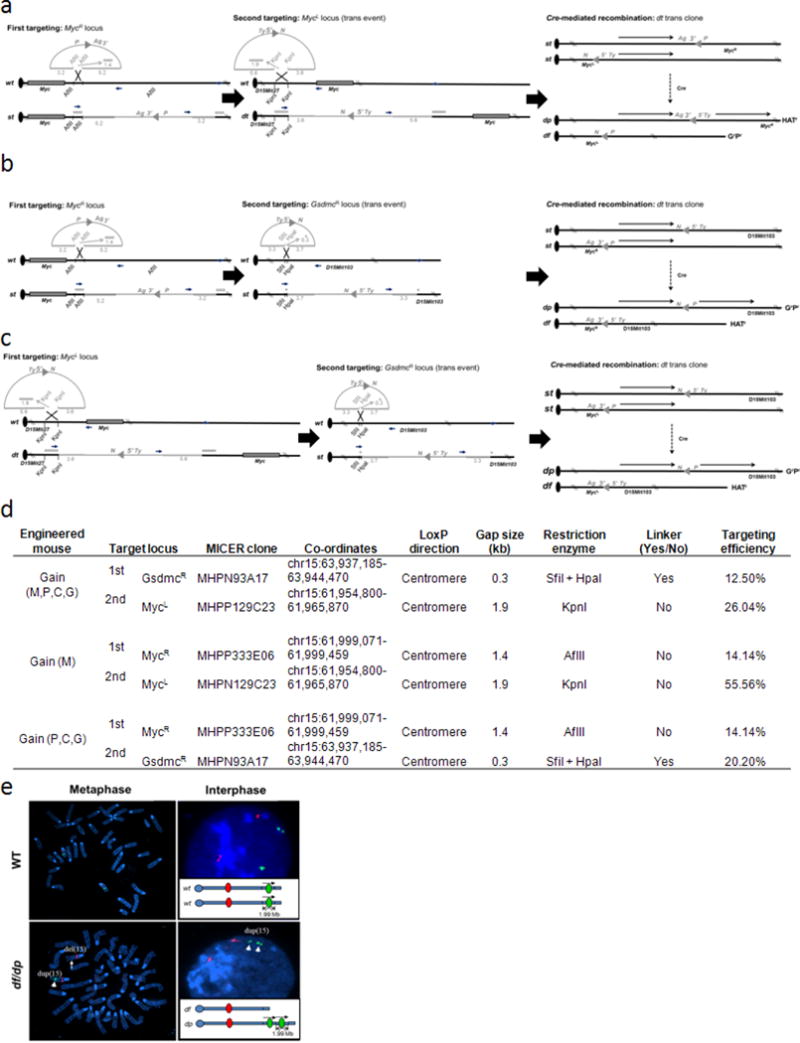
a–c, Chromosome engineering of Hprt-deficient mouse AB2.2 embryonic stem cells was used to develop mouse strains containing an extra copy of Myc (gain(Myc)) (a), Pvt1/Ccdc26/Gsdmc (gain(Pvt1,Ccdc26,Gsdmc)) (b) and Myc/Pvt1/Ccdc26/ Gsdmc (gain(Myc,Pvt1,Ccdc26,Gsdmc)) (c). Gene targeting was performed in AB2.2 with targeting vectors obtained from the Mutagenic Insertion and Chromosome Engineering Resource (MICER) that were modified to facilitate detection of correctly targeted clones by PCR. These electroporated embryonic stem cells were cultured in G418 (G, 180 µg ml−1) or puromycine (P, 3 µg ml−1) for 7–10 days. Correctly targeted clones were identified by PCR analysis. Double-targeted embryonic stem cells were electroporated with the transient Cre-recombinase expression vector pOG231. After subsequent selection of recombinants by using hypoxanthine aminopterin thymidime (H) media for 7 days and then recovery of recombinants by using hypoxanthines and thymidine media for 2 days, the HRGRPR clones containing one mouse chromosome 15 with the targeted region duplication (dp) and the other mouse chromosome 15 with the targeted region deletion (df) were identified. d, Summary of gene targeting of mouse genome at the MycL, MycR and GsdmcR loci. e, FISH analysis of gain/loss Myc,Pvt1,Ccdc26,Gsdmc embryonic stem cells with balanced allele for the Myc/Pvt1/Ccdc26/Gsdmc region. Metaphase and interphase preparations from the engineered cells were probed with BAC clone specific for chromosome 15 and located outside (RP23-18H8, red) and within (RP24-78D24, green) the engineered region. The alleles containing the deletion and the duplication are marked.
Extended Data Figure 3. Histopathology of mammary adenocarcinomas and lung metastasis in gain(Myc,Pvt1, Ccdc26,Gsdmc), MMTVneu/+ and gain(Myc,Pvt1,Ccdc26,Gsdmc) respectively.
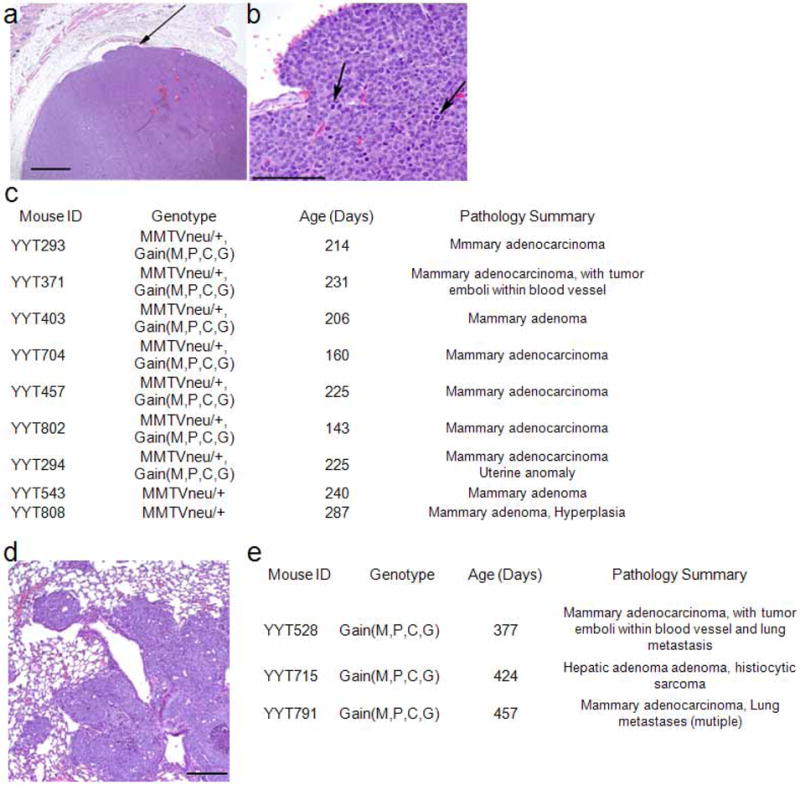
a, b, Mammary adenocarcinoma in gain(Myc,Pvt1,Ccdc26,Gsdmc),MMTVneu/+ mice. Representative histopathology of mammary tumours from gain(Myc,Pvt1,Ccdc26,Gsdmc),MMTVneu/+ mice. Image shows a solid, expansile tumour that is invading a small blood vessel (arrow; bar, 1000 µm) (a), and numerous mitotic figures (arrows; bar, 100 µm) (b). c, Summary of histopathology showing early onset of mammary adenocarcinoma in gain(Myc,Pvt1,Ccdc26,Gsdmc),MMTVneu/+ mice compared with MMTVneu/+ mice. d, Image of lung metastasis in gain(Myc,Pvt1,Ccdc26,Gsdmc) with spontaneous mammary adenocarcinoma (YYT 528,). e, Histopathology summary of spontaneous, low-penetrance tumour onset in gain(Myc,Pvt1,Ccdc26,Gsdmc) mice.
Extended Data Figure 4. Abnormal oncogenic stress, proliferation and differentiation in gain(Myc,Pvt1,Ccdc26, Gsdmc) mammary ducts.
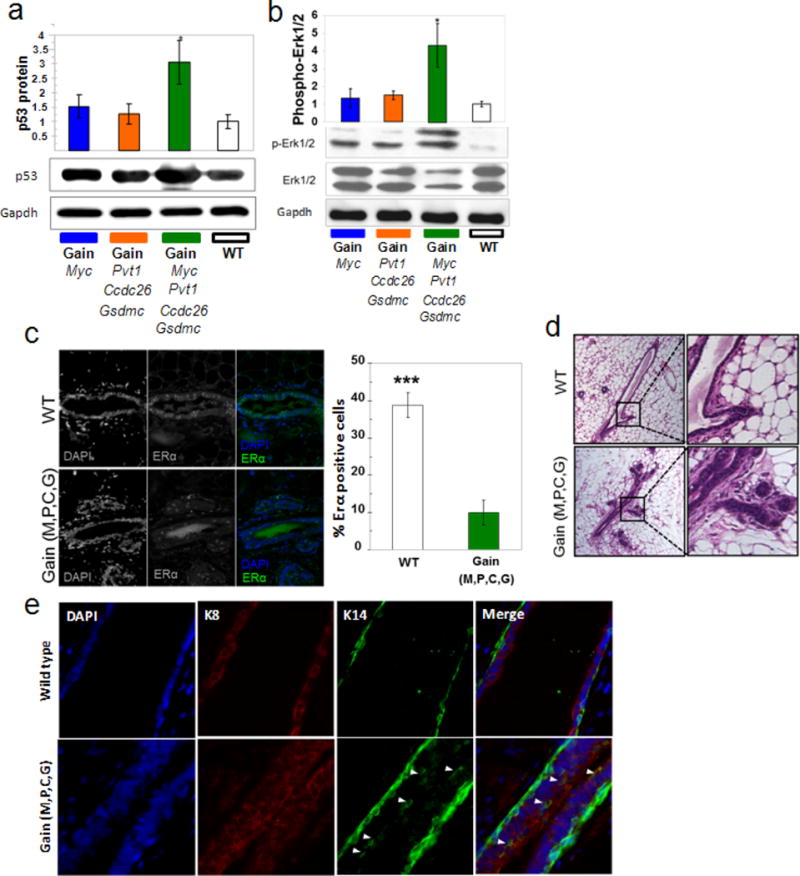
a, b, Western blot analysis of p53 (a) and phospho-Erk1/2 (b) in total protein lysates from mammary glands of indicated genotypes. The relative densities of p53 and p-ERK1/2 were calculated by normalizing against the GAPDH and total ERK1/2 protein levels respectively. c, Immunofluorescence analysis of ERα (green) on sections of mammary ducts. Cell nuclei positive for ERα are presented as the percentage of total epithelial cell nuclei (DAPI, blue). Images shown are representative three mice per genotype. d, Haematoxylin and eosin staining of the mammary ducts from wild type and gain (M,P,C,G) mice showed precocious alveolar-like phenotype in the latter. This aberrant structure is shown at higher magnification in the right row. e, Immunofluorescence co-staining for DAPI (blue), luminal marker K8 (red) and myoepithelial marker K14 (green) in mice. Arrowheads indicate co-expression of K8 and K14. DAPI-stained nuclei in blue. Mean ± s.e.m. for a–c (n = 3). *P < 0.05, ***P < 0.001 by two-tailed Student’s t-test; error bars, s.e.m.
Extended Data Figure 5. Gasdermin expression in mouse mammary tissues.
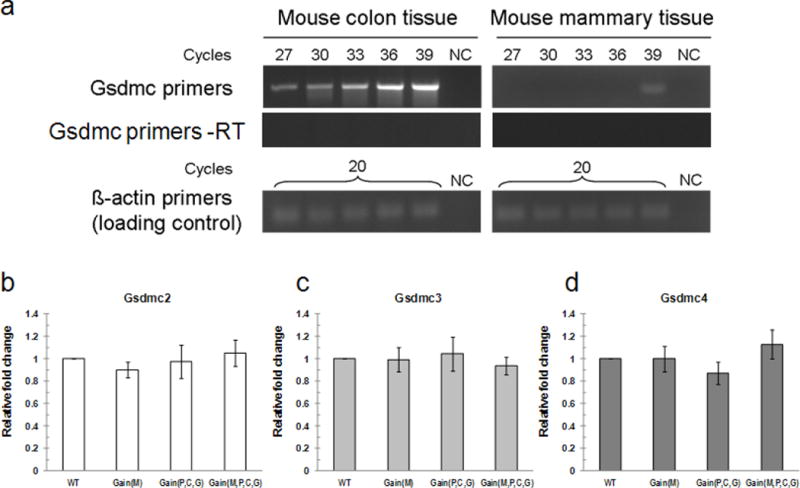
a, Gsdmc is not expressed in mouse mammary tissue. Semi-quantitative RT–PCR of Gsdmc transcript in mouse colon and mammary tissues. PCR was performed using equal amount of cDNAs derived from colon and mammary tissues, for cycles as indicated. –RT indicates samples treated without reverse transcriptase. β-actin used as a loading control. NC, negative control (water). b–d, Representative RT–qPCR analysis of Gsdmc2 (b), Gsdmc3 (c) and Gsdmc4 (d) mRNA in 10-week-old virgin mouse mammary tissues of all genotypes. Mean ± s.e.m. for b–d (n = 3); error bars, s.e.m.
Extended Data Figure 6. PVT1 depletion results into reduction in proliferation in SK-BR-3 and MDA-MB-231 breast cancer cell lines.
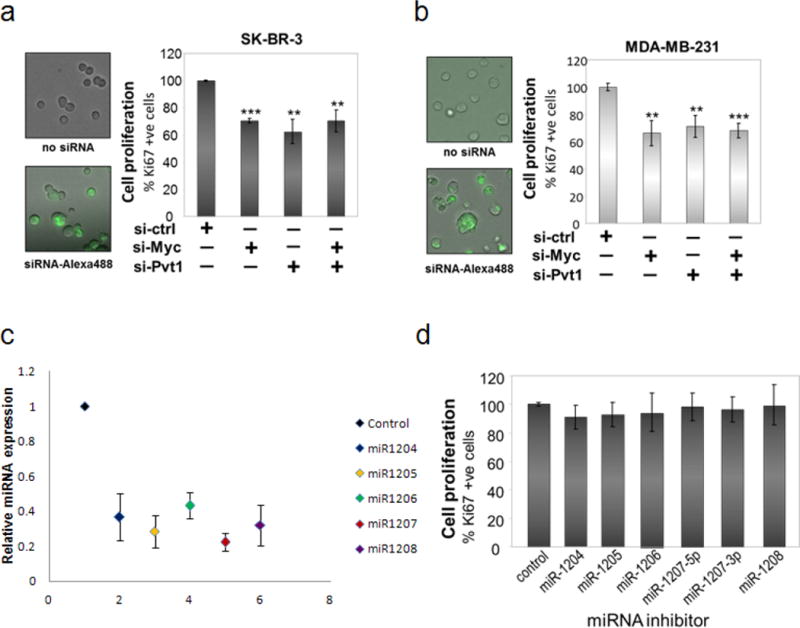
a, b, Proliferation assay of human breast cancer cell lines SK-BR-3 (a) and MDA-MB-231 (b) growing in three-dimensional culture after the cell lines were transfected with siCtrl, siMYC, siPVT1 and both (siMYC + siPVT1). Transfection efficiency in each cell line was confirmed as mentioned in the text. Mean ± s.e.m. for a and b (n = 3). **P < 0.01, ***P < 0.001 by two-tailed Student’s t-test. c, d, Inhibition of miRNA expression coded by the PVT1 locus shows no loss of proliferation in SK-BR-3 cells. SK-BR-3 cells transfected with antisense miRNAs were grown in three-dimensional culture as described before. c, Relative expression of individual miRNA in cells treated with its corresponding inhibitor, normalized to the control experiments Each data point represents the mean ± s.e.m. (n = 3, except for miR-1207, where n = 6). d, Percentage of Ki-67 positive cells denotes the proliferation index. Bar graph, mean ±.e.m. (n = 3); error bars, s.e.m.
Extended Data Figure 7. PVT1 regulates MYC protein level in MDA-MB-231 breast cancer cells.
a, RT–qPCR measurement of MYC (left) and PVT1 (right) RNA levels in MDA-MB-231 cells 48 h after transfection with the indicated siRNAs. b, Reduction in MYC protein in PVT1-depleted MDA-MB-231. Western blot analysis for MYC protein in the total lysates obtained from the MDA-MB-231 cell line transfected with different siRNAs. The relative density for each category was determined by normalizing against the intensity of the GAPDH band. c, Stability assay for MYC protein in MDA-MB-231 cells. Cells were transfected with siCtrl and siPVT1 and then treated with 10 μM cycloheximide for different time points (top panel). The relative density was determined by comparing against the GAPDH level (bottom panel). Mean ± s.e.m. for a–c (n = 3). *P < 0.05, **P < 0.01, ***P < 0.001 by two-tailed Student’s t-test. Error bars, s.e.m.
Extended Data Figure 8. PVT1 and MYC co-localize in the SK-BR-3 nuclei.
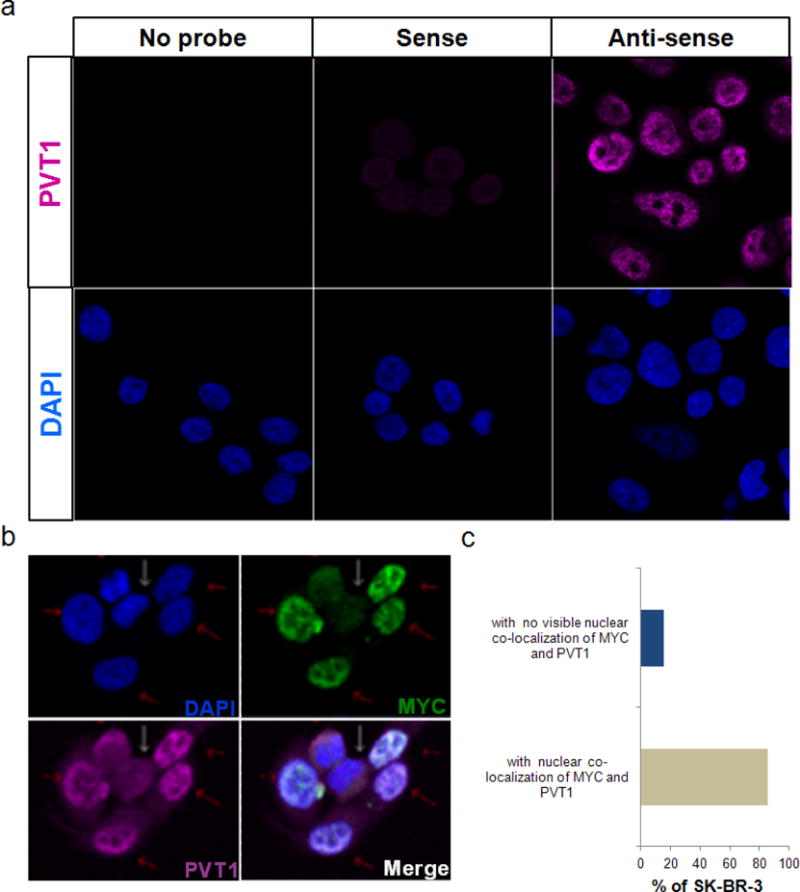
a, Specificity of fluorescent-labelled anti-PVT1 RNA probe in SK-BR-3 cells. Fluorescent images of SK-BR-3 cells treated with no probe, sense and anti-sense PVT1 RNA probe. DAPI (blue) stain is shown in the lower panel. b, c, Expression and co-localization of MYC and PVT1 in SK-BR-3 nuclei. Representative fluorescent images of SK-BR-3 cells treated with fluorescently labelled anti-MYC antibody (green) and anti-PVT1 RNA (magenta) (b). DAPI indicating cell nuclei is shown in blue. Cells expressing MYC and PVT1 are indicated by red arrows whereas those expressing low levels of MYC and PVT1 are indicated by white arrows. Merge panel represents overlapping images of DAPI, MYC and PVT1 panels. The nuclei with co-localization of MYC and PVT1 are shown by red arrows. c, Quantification of SK-BR-3 nuclei with co-localization of MYC and PVT1 (n = 87).
Extended Data Figure 9. Incidence MYC and PVT1 co-gain in human cancers.
a, Number of 8q24 gain-associated human cancers showing gain of MYC but not PVT1 (blue), gain of PVT1 but not MYC (orange) and co-gain of MYC + PVT1 (green) in TCGA (left) and Progenetix copy-number database (right). b, Pie chart showing breast cancer samples in TCGA expressing high HER2 transcript with or without co-gain of MYC + PVT1. c, The ratio of MYC + PVT1 + CCDC26 and MYC + PVT1 + GSDMC co-amplification among MYC + PVT1 co-gained TCGA samples at different amplification levels (segment mean cutoff). d, The ratio of MYC + PVT1 co-amplification among MYC-gained cancers on different segment mean cutoffs. e, f, Tissue microarray analysis of PVT1 RNA and MYC protein expression in primary human tumours. Images of 32 primary human tumours showing in situ hybridization using digoxigenin-labelled PVT1 probe (purple, top panel) and MYC immunohistochemistry using anti-MYC antibody (brown, bottom panel) (e). f, Specification of multiple organ normal and diseased tissue microarray, single core per case, eight types of tumour (breast, colon, oesophagus, kidney, liver, lung, rectum, stomach) (BC00119).
Extended Data Figure 10. Generating the ΔPVT1 HCT116.
a, Schematic representation of CRISPR-mediated deletion of 307 kilobase PVT1 gene in HCT116. Black triangles denote CRISPR specific for upstream of exon 1 and downstream of exon 8 of PVT1. PCR primers F1, F2 and R1 are denoted. b, A CRISPR-mediated deletion of PVT1 (ΔPVT1) can be detected by PCR amplicon using primers F1 and R1, whereas the control with PVT1 locus intact (PVT1+) can be screened by using F2 and R1. c, RT–qPCR analysis of PVT1 transcript in PVT1+ and ΔPVT1 HCT116 cells (n = 3). d, Relative cellular proliferation abilities of PVT1+ and ΔPVT1 HCT116 cells were evaluated by MTS assays. Data are mean ± s.e.m. for c and d (n = 3). *P < 0.05, **P < 0.01, ***P < 0.001 by two-tailed Student’s t-test. Error bars, s.e.m. e, Luciferase-based images of the presence of tumour lesions detected 3–17 days after subcutaneous implantation of PVT1+ and ΔPVT1 HCT116 cells in nude mice.
Acknowledgments
We thank A. T. Vogel for writing statistical analysis scripts; Research Animal Resources, University of Minnesota, for maintaining the mouse colony; S. Horn and L. Oseth for embryonic stem cell blastocyst injection and FISH analysis respectively. This work was supported by Masonic Cancer Center Laboratory start-up funds (to A.B.), and by grants from the Masonic Scholar Award (to A.B.), the Karen Wyckoff Rein in Sarcoma Fund (to A.B.), Translational Workgroup Pilot Project Awards by the Institute of Prostate and Urologic Cancer, University of Minnesota (to A.B.) and an American Cancer Society Institutional Research Grant (award 118198-IRG-58-001-52-IRG92, to A.B.). A.T. was supported by an Indo-US fellowship from the Indo-US Science and Technology Forum.
Footnotes
Online Content Methods, along with any additional Extended Data display items and Source Data, are available in the online version of the paper; references unique to these sections appear only in the online paper.
Author Contributions Y.Y.T. and A.B. conceptualized the research programme and designed the experiments; Y.Y.T., B.S.M., H.K., A.T., R.A., P.R., B.R., K.G., T.C.B., J.E., Y.K. and A.B. performed the experiments. Y.Y.T. and W.G. analysed the data; M.G.O. and Y.Y.T. performed the histological analyses; K.L.S., D.A.L., Y.M., Y.K. and A.B. supervised experiments and data analysis; A.B. and Y.M. wrote the manuscript.
The authors declare no competing financial interests.
Readers are welcome to comment on the online version of the paper.
References
- 1.Huppi K, Pitt JJ, Wahlberg BM, Caplen NJ. The 8q24 gene desert: an oasis of non-coding transcriptional activity. Front Genet. 2012;3:69. doi: 10.3389/fgene.2012.00069. [DOI] [PMC free article] [PubMed] [Google Scholar]
- 2.Haverty PM, Hon LS, Kaminker JS, Chant J, Zhang Z. High-resolution analysis of copy number alterations and associated expression changes in ovarian tumors. BMC Med Genomics. 2009;2:21. doi: 10.1186/1755-8794-2-21. [DOI] [PMC free article] [PubMed] [Google Scholar]
- 3.Guan Y, et al. Amplification of PVT1 contributes to the pathophysiology of ovarian and breast cancer. Clin Cancer Res. 2007;13:5745–5755. doi: 10.1158/1078-0432.CCR-06-2882. [DOI] [PubMed] [Google Scholar]
- 4.van Duin M, et al. High-resolution array comparative genomic hybridization of chromosome 8q: evaluation of putative progression markers for gastroesophageal junction adenocarcinomas. Cytogenet Genome Res. 2007;118:130–137. doi: 10.1159/000108293. [DOI] [PubMed] [Google Scholar]
- 5.Borg A, Baldetorp B, Ferno M, Olsson H, Sigurdsson H. c-myc amplification is an independent prognostic factor in postmenopausal breast cancer. Int J Cancer. 1992;51:687–691. doi: 10.1002/ijc.2910510504. [DOI] [PubMed] [Google Scholar]
- 6.Kim YH, et al. Combined microarray analysis of small cell lung cancer reveals altered apoptotic balance and distinct expression signatures of MYC family gene amplification. Oncogene. 2006;25:130–138. doi: 10.1038/sj.onc.1208997. [DOI] [PubMed] [Google Scholar]
- 7.Sato K, et al. Clinical significance of alterations of chromosome 8 in high-grade, advanced, nonmetastatic prostate carcinoma. J Natl Cancer Inst. 1999;91:1574–1580. doi: 10.1093/jnci/91.18.1574. [DOI] [PubMed] [Google Scholar]
- 8.Lapointe J, et al. Genomic profiling reveals alternative genetic pathways of prostate tumorigenesis. Cancer Res. 2007;67:8504–8510. doi: 10.1158/0008-5472.CAN-07-0673. [DOI] [PubMed] [Google Scholar]
- 9.Douglas EJ, et al. Array comparative genomic hybridization analysis of colorectal cancer cell lines and primary carcinomas. Cancer Res. 2004;64:4817–4825. doi: 10.1158/0008-5472.CAN-04-0328. [DOI] [PubMed] [Google Scholar]
- 10.Zitterbart K, et al. Low-level copy number changes of MYC genes have a prognostic impact in medulloblastoma. J Neurooncol. 2011;102:25–33. doi: 10.1007/s11060-010-0289-3. [DOI] [PubMed] [Google Scholar]
- 11.Yamada T, et al. Frequent chromosome 8q gains in human small cell lung carcinoma detected by arbitrarily primed-PCR genomic fingerprinting. Cancer Genet Cytogenet. 2000;120:11–17. doi: 10.1016/s0165-4608(99)00240-x. [DOI] [PubMed] [Google Scholar]
- 12.Le Beau MM, Bitts S, Davis EM, Kogan SC. Recurring chromosomal abnormalities in leukemia in PML-RARA transgenic mice parallel human acute promyelocytic leukemia. Blood. 2002;99:2985–2991. doi: 10.1182/blood.v99.8.2985. [DOI] [PubMed] [Google Scholar]
- 13.Chin K, et al. Genomic and transcriptional aberrations linked to breast cancer pathophysiologies. Cancer Cell. 2006;10:529–541. doi: 10.1016/j.ccr.2006.10.009. [DOI] [PubMed] [Google Scholar]
- 14.Jain AN, et al. Quantitative analysis of chromosomal CGH in human breast tumors associates copy number abnormalities with p53 status and patient survival. Proc Natl Acad Sci USA. 2001;98:7952–7957. doi: 10.1073/pnas.151241198. [DOI] [PMC free article] [PubMed] [Google Scholar]
- 15.Ramirez-Solis R, Liu P, Bradley A. Chromosome engineering in mice. Nature. 1995;378:720–724. doi: 10.1038/378720a0. [DOI] [PubMed] [Google Scholar]
- 16.Al-Kuraya K, et al. Prognostic relevance of gene amplifications and coamplifications in breast cancer. Cancer Res. 2004;64:8534–8540. doi: 10.1158/0008-5472.CAN-04-1945. [DOI] [PubMed] [Google Scholar]
- 17.Park K, Kwak K, Kim J, Lim S, Han S. c-myc amplification is associated with HER2 amplification and closely linked with cell proliferation in tissue microarray of nonselected breast cancers. Hum Pathol. 2005;36:634–639. doi: 10.1016/j.humpath.2005.04.016. [DOI] [PubMed] [Google Scholar]
- 18.Guy CT, et al. Expression of the neu protooncogene in the mammary epithelium of transgenic mice induces metastatic disease. Proc Natl Acad Sci USA. 1992;89:10578–10582. doi: 10.1073/pnas.89.22.10578. [DOI] [PMC free article] [PubMed] [Google Scholar]
- 19.Saji S, et al. Estrogen receptors α and β in the rodent mammary gland. Proc Natl Acad Sci USA. 2000;97:337–342. doi: 10.1073/pnas.97.1.337. [DOI] [PMC free article] [PubMed] [Google Scholar]
- 20.Carramusa L, et al. The PVT-1 oncogene is a Myc protein target that is overexpressed in transformed cells. J Cell Physiol. 2007;213:511–518. doi: 10.1002/jcp.21133. [DOI] [PubMed] [Google Scholar]
- 21.Lin M, et al. RNA-Seq of human neurons derived from iPS cells reveals candidate long non-coding RNAs involved in neurogenesis and neuropsychiatric disorders. PLoS ONE. 2011;6:e23356. doi: 10.1371/journal.pone.0023356. [DOI] [PMC free article] [PubMed] [Google Scholar]
- 22.Zhang X, et al. Mechanistic insight into Myc stabilization in breast cancer involving aberrant Axin1 expression. Proc Natl Acad Sci USA. 2012;109:2790–2795. doi: 10.1073/pnas.1100764108. [DOI] [PMC free article] [PubMed] [Google Scholar]
- 23.Yeh E, et al. A signalling pathway controlling c-Myc degradation that impacts oncogenic transformation of human cells. Nature Cell Biol. 2004;6:308–318. doi: 10.1038/ncb1110. [DOI] [PubMed] [Google Scholar]
- 24.Wang X, et al. Phosphorylation regulates c-Myc’s oncogenic activity in the mammary gland. Cancer Res. 2011;71:925–936. doi: 10.1158/0008-5472.CAN-10-1032. [DOI] [PMC free article] [PubMed] [Google Scholar]
- 25.Morin PJ, et al. Activation of β-catenin-Tcf signaling in colon cancer by mutations in β-catenin or APC. Science. 1997;275:1787–1790. doi: 10.1126/science.275.5307.1787. [DOI] [PubMed] [Google Scholar]
- 26.Delmore JE, et al. BET bromodomain inhibition as a therapeutic strategy to target c-Myc. Cell. 2011;146:904–917. doi: 10.1016/j.cell.2011.08.017. [DOI] [PMC free article] [PubMed] [Google Scholar]
- 27.Darnell JE., Jr Transcription factors as targets for cancer therapy. Nature Rev Cancer. 2002;2:740–749. doi: 10.1038/nrc906. [DOI] [PubMed] [Google Scholar]
- 28.Nair SK, Burley SK. X-ray structures of Myc-Max and Mad-Max recognizing DNA. Molecular bases of regulation by proto-oncogenic transcription factors. Cell. 2003;112:193–205. doi: 10.1016/s0092-8674(02)01284-9. [DOI] [PubMed] [Google Scholar]
- 29.Bagchi A, et al. CHD5 is a tumor suppressor at human 1p36. Cell. 2007;128:459–475. doi: 10.1016/j.cell.2006.11.052. [DOI] [PubMed] [Google Scholar]
- 30.Schwertfeger KL, et al. A critical role for the inflammatory response in a mouse model of preneoplastic progression. Cancer Res. 2006;66:5676–5685. doi: 10.1158/0008-5472.CAN-05-3781. [DOI] [PubMed] [Google Scholar]
- 31.Reed JR, et al. Fibroblast growth factor receptor 1 activation in mammary tumor cells promotes macrophage recruitment in a CX3CL1-dependent manner. PLoS ONE. 2012;7:e45877. doi: 10.1371/journal.pone.0045877. [DOI] [PMC free article] [PubMed] [Google Scholar]
- 32.Lee GY, Kenny PA, Lee EH, Bissell MJ. Three-dimensional culture models of normal and malignant breast epithelial cells. Nature Methods. 2007;4:359–365. doi: 10.1038/nmeth1015. [DOI] [PMC free article] [PubMed] [Google Scholar]
- 33.Kenny PA, et al. The morphologies of breast cancer cell lines in three-dimensional assays correlate with their profiles of gene expression. Mol Oncol. 2007;1:84–96. doi: 10.1016/j.molonc.2007.02.004. [DOI] [PMC free article] [PubMed] [Google Scholar]
- 34.Itou J, et al. Migration of cardiomyocytes is essential for heart regeneration in zebrafish. Development. 2012;139:4133–4142. doi: 10.1242/dev.079756. [DOI] [PubMed] [Google Scholar]
- 35.Keene JD, Komisarow JM, Friedersdorf MB. RIP-Chip: the isolation and identification of mRNAs, microRNAs and protein components of ribonucleoprotein complexes from cell extracts. Nature Protocols. 2006;1:302–307. doi: 10.1038/nprot.2006.47. [DOI] [PubMed] [Google Scholar]
- 36.Moriarity BS, et al. Simple and efficient methods for enrichment and isolation of endonuclease modified cells. PloS One. 2014;9:e96114. doi: 10.1371/journal.pone.0096114. [DOI] [PMC free article] [PubMed] [Google Scholar]
- 37.Rahrmann EP, et al. Forward genetic screen for malignant peripheral nerve sheath tumor formation identifies new genes and pathways driving tumorigenesis. Nature Genet. 2013;45:756–766. doi: 10.1038/ng.2641. [DOI] [PMC free article] [PubMed] [Google Scholar]