Abstract
Background
Paracetamol protein adducts (PPA) are a biomarker of paracetamol exposure. PPA are quantified as paracetamol–cysteine (APAP‐CYS), and concentrations above 1.1 μmol l–1 have been suggested as a marker of paracetamol‐induced hepatotoxicity. However, there is little information on the range of concentrations observed during prolonged therapeutic dosing.
Aim
The aim of the present study was to describe the concentration of PPA in the serum of subjects taking therapeutic doses of paracetamol for at least 16 days.
Methods
Preplanned secondary aim of a prospective randomized controlled (placebo vs. 4g day–1 paracetamol) trial. We measured subjects' serum PPA concentrations every 3 days for a minimum of 16 days. We also measured concentrations on study days 1–3 and 16–25 in subsets of patients. PPA were quantified as APAP‐CYS after gel filtration and protein digestion using liquid chromatography/mass spectrometry.
RESULTS
Ninety per cent of subjects had detectable PPA after five doses. Median APAP‐CYS concentrations in paracetamol‐treated subjects increased to a plateau of 0.1 μmol l–1 on day 7, where they remained. The highest concentration measured was 1.1 μmol l–1 and two subjects never had detectable PPA levels. PPA were detected in the serum of 78% of subjects 9 days after their final dose.
Conclusions
PPA are detectable in the vast majority of subjects taking therapeutic doses of paracetamol. While most have concentrations well below the threshold associated with hepatotoxicity, concentrations may approach 1.1 μmol l–1 in rare cases. Adducts are detectable after a few doses and can persist for over a week after dosing is stopped.
Keywords: APAP‐CYS, paracetamol, protein adducts
What is Already Known About This Subject
Paracetamol protein adducts can be detected in serum following paracetamol overdose and when therapeutic doses are administered for several days.
The course of adduct concentrations during therapeutic doses of paracetamol over time are not described.
What This Study Adds
Adducts can be detected in most subjects after five 1 g doses of paracetamol.
Adduct concentrations peak after approximately 4 days.
Most subjects will have adduct concentrations around 0.1 μmol l–1 but some subjects will not have detectable adducts and a few subjects develop serum adduct concentrations approaching 1 μmol l–1.
Introduction
Paracetamol (acetaminophen) protein adducts (PPA) are formed when paracetamol is oxidized to the reactive metabolite N‐acetyl‐p‐benzoquinoneimine (NAPQI) and NAPQI binds to cysteine residues in proteins. These adducts can be quantified in serum by measuring the concentration of paracetamol–cysteine (APAP‐CYS), and they provide a biomarker of paracetamol exposure 1.
Early work on PPA in animals showed that adducts are rapidly detectable in liver following overdose, and released into the serum as hepatic necrosis occurs 2. However, there were many technical limitations to quantification and it was not until the last decade that the methods developed to the point where they could be considered for clinical application.
The first large study describing the clinical application of PPA as a biomarker was published in 2006 3. This study described a series of patients with acute liver failure and demonstrated that patients with paracetamol‐induced liver failure had higher APAP‐CYS concentrations than paracetamol‐overdose patients without liver injury, and that APAP‐CYS was not detected in patients with liver failure from other causes. The study also noted that a significant minority of patients with liver failure of indeterminate cause had APAP‐CYS concentrations similar to patients with paracetamol‐induced liver failure, suggesting occult paracetamol poisoning as the cause of their illness. This initial adult study was followed by a paediatric study that had similar overall findings but described two cases of liver failure due to haemophagocytic syndrome and ischaemic liver where the APAP‐CYS concentrations were similar to those reported in the acetaminophen‐induced liver failure group 4.
Recently, an APAP‐CYS concentration of 1.1 μmol l–1 has been suggested as diagnostic of paracetamol‐induced liver injury 5. Using this threshold, the authors suggested that occult paracetamol overdose is the cause of liver failure in a significant minority of cases of liver failure of unknown cause 6. The vast majority of published reports using APAP‐CYS as a diagnostic tool have focused on acute liver failure, and only three reports (one an abstract) described APAP‐CYS concentrations when paracetamol was administered at therapeutic doses 7, 8, 9. These therapeutic dose studies have measured APAP‐CYS during single dose or short courses of treatment in healthy volunteers and have reported mean serum levels approximately 10% of the concentration used as a diagnostic threshold for paracetamol‐induced liver injury. However, a few subjects had concentrations approaching the threshold of 1.1 μmol l–1. Furthermore, the studies were limited by a maximum dosing period of 10 days.
We recently reported the results of a placebo‐controlled, randomized trial with the primary objective of describing the effects of paracetamol on serum alanine aminotransferase (ALT) during prolonged dosing (a minimum of 16 days) 10. A secondary objective of the current study was to measure serum APAP‐CYS concentrations during the course of the study.
Methods
Design
Samples were collected during a randomized, placebo‐controlled trial (NCT00743093). The design and results of that trial have already been published 10.
Subjects
Subjects were healthy volunteers, aged 18 years and older, who responded to advertisements and who did not have any of the following exclusion criteria: a history of any paracetamol ingestion on any of the 4 days preceding study enrolment or a measurable serum paracetamol concentration at the time of enrolment; biochemical evidence of active viral hepatitis A, B or C infection; any of the following tests greater than the upper limit of normal at screening: serum ALT or total bilirubin, International Normalized Ratio (INR) or alkaline phosphatase activity; platelet count less than 125,000 ml–1; a positive pregnancy test; a history of cholelithiasis (without cholecystectomy); a history of consuming more than an average of three alcohol‐containing drinks daily or three or more alcohol‐containing drinks on any given day in the 2 weeks prior to study enrolment; new prescription medication started within the previous 30 days; taking isoniazid or warfarin; current anorexia nervosa or reporting a fasting‐type diet; clinically intoxicated, psychiatrically impaired or unable to give informed consent for any reason; known hypersensitivity or allergy to paracetamol.
Interventions
The details of the flow of patients through the study have been previously published 10. Briefly, subjects were randomized to either paracetamol (1 g every 4 h four times daily) or placebo. The allocation ratio was four paracetamol : one placebo subject. All subjects receive the study drug until day 16. At day 16, subjects who had a serum ALT ≤47 IU l–1 (the upper limit of the reference range for our laboratory) and who were within 10 IU l–1 of their baseline measurements stopped study medication. Subjects who did not meet these criteria continued dosing in the extended dosing period. Once a subject entered the extended dosing period, the resolution criteria changed slightly. If the subject had a day 16 ALT >10 IU l–1 above baseline, resolution occurred when they had two consecutive non‐increasing ALT measurements ≤47 IU l–1. If the day 16 ALT elevation was less than 10 IU l–1 above the baseline value but >47 IU l–1, we required two consecutive ALT values ≤47 IU l–1 for resolution. This protocol is shown as a flow chart in our prior publication 10.
Measurements
Serum samples were collected for ALT measurements from all enrolled subjects at study day 0 and then every 3 days until the subject completed the trial. In addition, we collected samples on study days 1, 2 and 3 in a subset of patients (early detection phase). This group included paracetamol and placebo subjects. Finally, in a subset of paracetamol‐treated patients who completed the intervention phase on day 16, we collected samples every 3 days, starting on study day 19, up to day 25 (resolution phase days 0 to 9). During the resolution phase, subjects were not administered study drug, were instructed to avoid paracetamol and maintained study diaries documenting medication use, to verify that no paracetamol was consumed.
Sample analysis
Serum PPA were measured using a previously described technique 11. Briefly, serum samples were gel filtered to remove APAP‐CYS not bound to proteins. After filtering, the proteins in the samples were digested to release APAP‐CYS bound to serum protein. APAP‐CYS concentrations were then measured using liquid chromatography/mass spectrometry. The limit of quantification was 0.01 μmol l–1, and the intra‐ and inter‐assay imprecisions were determined to be less than 10% across the range of the calibration curve 12.
Statistical analysis
APAP‐CYS concentrations are shown as a median and range for each day. APAP‐CYS concentrations over time were compared with baseline using repeated measures analysis of variance for paracetamol subjects for days 1–16. We also report proportions of subjects having detectable PPA concentrations for days 1–3 in the early detection group and days 19–25 in the resolution phase. As APAP‐CYS concentrations were non‐normally distributed, concentrations were compared using nonparametric testing. Correlation of PPA concentration and serum ALT was assessed using least‐squares regression and adjusted for repeated observations on subjects. Analyses were performed using SAS 9.3 (SAS Institute, Carey NC, USA) and Prism 6 (Graphpad Software, San Diego, CA, USA).
Results
A total of 252 subjects were enrolled and completed the study protocol, 208 in the paracetamol arm and 47 in the placebo arm. The characteristics of each study group are shown in Table 1.
Table 1.
Demographics of paracetamol‐ and placebo‐treated subjects who had serum paracetamol–cysteine concentrations measured during the study
| Placebo | Paracetamol | |
|---|---|---|
| Age, years [median (range)] | 32 (19–64) | 34 (18–74) |
| Male | 12 (25%) | 57 (28%) |
| Race | ||
| African | 4 (9%) | 13 (6%) |
| Asian | 1 (2%) | 5 (2%) |
| Caucasian | 35 (74%) | 142 (69%) |
| Hispanic | 4 (9%) | 33 (16%) |
| Other | 3 (6%) | 12 (6%) |
| Nondrinker | 12 (25%) | 38 (19%) |
| Nonsmoker | 37 (79%) | 174 (85%) |
| Paracetamol use | ||
| Never | 14 (30%) | 31 (15%) |
| <1 day per week | 6 (13%) | 24 (12%)_ |
| 1–2 days per week | 26 (55%) | 145 (71%) |
| >2 days per week | 1 (2%) | 5 (2%) |
Low APAP‐CYS concentrations (<0.03 μmol l–1) were detected in 15 paracetamol and two placebo subjects at baseline. All but one of these subjects reported at least rare paracetamol use prior to study initiation (but none within 4 days of starting the trial). In the paracetamol group, the median PPA concentration increased up to day 7 and levelled off at approximately 0.1 μmol l–1 for days 7 to 16 (Figure 1). Over the course of the study, the median peak APAP‐CYS concentration for paracetamol subjects was 0.14 μmol l–1 and the maximum observed concentration among all subjects was 1.06 μmol l–1.
Figure 1.
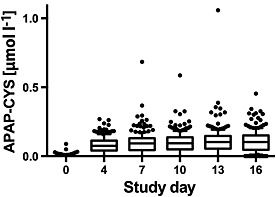
Serum paracetamol–cysteine (APAP‐CYS) concentrations of subjects administered 4 g day–1 of paracetamol during the main study period. The line in each figure represents the median value; the box includes the 25th–75th percentile; the ‘whiskers’ include the 10–90th percentile and the dots represent values outside the 10th–90th percentile
We had 124 samples in 63 paracetamol subjects with no detectable APAP‐CYS at some point between study day 4 and study day 16 (Table 2). Two subjects did not have detectable PPA at any time point. Review of the study diaries for the two subjects who had no PPA detected suggested that these subjects were compliant with taking the study medication, and one subject had paracetamol detected in the serum during one of his visits (sampling was not timed specifically around dosing, so it is possible to be compliant with dosing and still have an undetectable paracetamol concentration if the samples were obtained more than a few hours after the most recent dose). Undetectable serum PPA concentrations were observed on all study days and there was no clear temporal pattern (Table 3).
Table 2.
Number of subjects who had undetectable serum paracetamol protein adduct concentrations in 0, 1, 2, 3, 4 or 5 samples while taking 4 g day–1 paracetamol
| Number of samples with undetectable adducts | 0 Samples | 1 Sample | 2 Samples | 3 Samples | 4 Samples | 5 Samples |
|---|---|---|---|---|---|---|
| Subjects | 142 | 29 | 16 | 11 | 5 | 2 |
Table 3.
Number of subjects with no detectable serum paracetamol protein adducts in subjects taking 4 g day–1 paracetamol for each study day
| Study day | 4 | 7 | 10 | 13 | 16 |
|---|---|---|---|---|---|
| Subjects with undetectable adducts | 28 | 26 | 28 | 23 | 19 |
For subjects who entered the extended dosing period (study days 16–40), the total number of subjects who provided samples at each time point decreased from 50 on day 19 to two on day 40 as subjects met resolution criteria for the primary study outcome and their participation was complete. Median PPA concentrations were generally between 0.12 μmol l–1 and 0.15 μmol l–1 for subjects in this part of the study (Figure 2).
Figure 2.
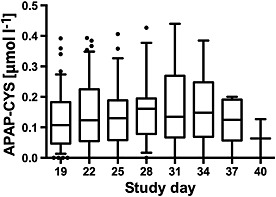
Serum paracetamol–cysteine (APAP‐CYS) concentrations during the extended dosing period (days 17–40) in subjects administered 4 g day–1 paracetamol during the study. The line in each figure represents the median value; the box includes the 25th–75th percentile; the ‘whiskers’ include the 10th–90th percentile and the dots represent values outside the 10th–90th percentile. The number of subjects for each day were: day 19, n = 47; day 22, n = 47; day 25, n = 25; day 28, n = 17; day 31, n = 13; day 34, n = 6; day 37, n = 5; and day 40, n = 2
We investigated several patient characteristics to determine if they were associated with maximum PPA concentrations in the paracetamol group. The maximum PPA concentrations were higher for women than men (median 0.15 μmol l–1 vs. 0.11 μmol l–1; P = 0.001 by the Wilcoxon rank‐sum test). Compliance was similar for men and women (Median percentage of days taking four doses 100% for both groups). The maximum PPA concentration was not correlated with age (r 2 = 0.003), average number of daily drinks (r 2 = 0.003) or weight (r 2 = 0.002). Median PPA concentrations did not differ between smokers and nonsmokers (median 0.13 μmol l–1 vs. 0.14 μmol l–1; P = 0.17) or by self‐reported prior paracetamol use (median PPA concentrations: never use = 0.13 μmol l–1, rare use = 0.15 μmol l–1, occasional use = 0.13 μmol l–1 and frequent use = 0.16 μmol l–1; P = 0.56, Wilcoxon rank‐sum test).
In cases of paracetamol hepatotoxicity, PPA concentrations have been found to be strongly correlated with serum ALT (R = 0.73, r 2 = 0.53) 5. However, we found only a very weak correlation during therapeutic dosing (Figure 5; r 2 = 0.02).
Figure 5.
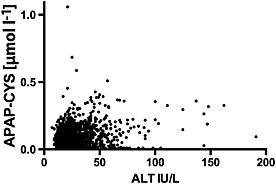
Correlation of serum alanine aminotransferase (ALT) with serum paracetamol–cysteine (APAP‐CYS) in subjects taking 4 g day–1 paracetamol. Samples were obtained every 3 days for days 4–16
Early detection subgroup
Sixty‐four subjects had serum PPA concentrations measured on days 1–3 in addition to the standard protocol. The course of PPA for these study days is shown in Figure 3. Ninety per cent of the subjects had detectable PPA after five doses of paracetamol.
Figure 3.
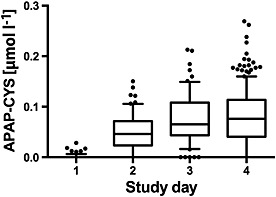
Serum paracetamol–cysteine (APAP‐CYS) concentrations in subjects during the first 4 days of receiving 4 g day–1 paracetamol. The line in each figure represents the median value; the box includes the 25th–75th percentile; the ‘whiskers’ include the 10th–90th percentile and the dots represent values outside the 10th–90th percentile
PPA resolution
A total of 54 subjects had serial PPA concentrations measured after stopping paracetamol on day 16 (PPA resolution group). Once the study drug had been stopped, median PPA concentrations decreased steadily through the observation period (Figure 4). The median concentration on resolution days 0 (last day of dosing), 3, 6 and 9 were 0.11 μmol l–1, 0.05 μmol l–1, 0.036 μmol l–1 and 0.028 μmol l–1, respectively. PPA concentrations were still detectable in 42 (78%) subjects 9 days after stopping paracetamol (Figure 5)
Figure 4.
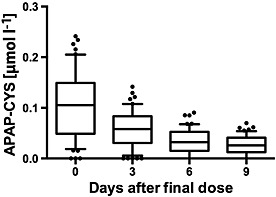
Serum paracetamol–cysteine (APAP‐CYS) concentrations in subjects during the resolution phase administration of 4 g day–1 paracetamol for 16 days. Subjects did not take paracetamol during this phase of the study. Day 0 of the resolution phase was day 16 of the baseline study. The line in each figure represents the median value; the box includes the 25th–75th percentile; the ‘whiskers’ include the 10th–90th percentile and the dots represent values outside the 10th–90th percentile
Discussion
Paracetamol–PPA are detectable in the serum during therapeutic dosing. When therapeutic doses of paracetamol are consumed, PPA are formed and detectable in the majority of subjects within 2 days. As dosing is continued, serum concentrations plateau at around day 7, at a concentration approximately 1–10% of the concentration expected with paracetamol‐induced hepatotoxicity, and remain detectable in some patients for more than 9 days after the final dose.
In our population, we found no subject taking therapeutic doses of paracetamol who had a PPA concentration in excess of the diagnostic threshold of 1.1 μmol l–1. While this supports the use of the threshold, it is important to recognize that we excluded subjects with liver disease. Prior studies in chronic alcoholic patients have not reported significantly higher PPA concentrations 7. However, it is possible that subjects with other liver disease who take therapeutic doses of paracetamol may have higher PPA concentrations than those observed in the present study.
While PPA concentrations did not differ by age, race or tobacco use, median PPA concentrations were approximately 35% higher for women than for men. No previous studies have noted this finding. As men in our study weighed approximately 10% more than women, we do not believe that this is simply due to differences in weight‐based dosing. Prior work has demonstrated that cytochrome P450 (CYP) 2E1 activity is higher in men than in women 13, so it is unlikely that increased metabolism is responsible for this finding. Future studies should evaluate differences in the clearance of PPA between the genders.
We also investigated ethanol intake and body weight, two factors that may alter CYP‐2E1 activity. Ethanol has a biphasic effect on CYP‐2E1 activity. Acute ethanol ingestion inhibits CYP‐2E1 activity and decreases the oxidation of paracetamol. Once the ethanol is metabolized, CYP‐2E1 activity is increased 14, so more paracetamol is oxidized and more PPA could be formed. One prior report found that ethanol users had slightly lower PPA concentrations than nondrinkers 7. However, in the current study, PPA concentrations were similar for drinkers and nondrinkers, suggesting that moderate ethanol consumption has no impact on PPA formation. CYP‐2E1 has also been found to be increased by obesity 15 but we found no relationship between body weight and PPA in the present study.
As described in the introduction, the vast majority of studies reporting serum paracetamol PPA concentrations have involved patients who presented following paracetamol overdose. In these populations, a serum APAP‐CYS concentration of 1.1 μmol l–1 performs well for differentiating paracetamol‐induced hepatic injury from paracetamol overdose without hepatic injury 5. As PPA concentrations are being used to diagnose paracetamol as a cause of liver injury 6, it is important to understand the range of concentrations in other populations. We had one subject taking 4 g day–1 paracetamol who had a peak serum concentration of 1 μmol l–1. This is very near the threshold suggested as diagnostic of paracetamol‐induced liver injury, and suggests that patients taking repeated daily doses in the 4–6 g range could have serum PPA concentrations that could be mistaken as an acute overdose.
While only one subject's PPA concentration approached the threshold associated with paracetamol‐induced liver injury, the concentrations observed in the present study overlapped with the range of concentrations observed in overdose patients who are treated early with acetylcysteine and do not develop hepatotoxicity 7, 16. A simulated paracetamol overdose model of (80 mg kg–1), reported a mean PPA concentration of approximately 0.1 μmol l–1 9. These observations demonstrate that PPA concentrations alone cannot be used to differentiate paracetamol overdose from therapeutic use. Clinical interpretation will be needed.
The present study had several limitations. We did not measure paracetamol concentrations systematically and relied on subject report to assure compliance. It is possible that some subjects may have reported paracetamol use but not actually taken the study drug. A second limitation was that we only measured transaminase activity and did not use newer biomarkers such as miR 122. However, recent studies have shown that newer markers strongly correlated with ALT in subjects taking therapeutic doses of paracetamol 17.
One novel observation in the present trial was that PPA concentrations can fall to undetectable levels during therapeutic dosing and subsequently return to detectable levels with continued dosing. We observed this in approximately 30% of subjects during the 16‐day dosing period. Subjects with undetectable concentrations reported compliance with study drug ingestion, so we conclude that these concentrations were not likely due to noncompliance. This pattern of samples with undetectable levels followed by samples with detectable concentrations was also noted during the PPA resolution phase, where subjects had PPA concentrations measured after stopping paracetamol and therefore compliance was no longer an issue. The fall in PPA concentrations to undetectable concentrations with a subsequent return to delectable concentrations suggests that PPA are formed or released in an irregular pattern. The fall to undetectable concentrations and subsequent return to detectable concentrations with no further dosing is also not consistent with the reported half‐life of approximately 24 h reported for patients who took a single supratherapeutic dose 9. We considered laboratory error and sample handling as a cause for the undetectable samples. However, the concentrations of samples obtained before and after the undetectable samples were well above the limits of detection for our laboratory (0.010 μM). Our laboratory also has demonstrated that concentrations are stable under the storage and handling conditions encountered in the present study 12. Future studies should be designed specifically to measure the kinetics of PPA in patients taking therapeutic doses of paracetamol. Finally, two of our subjects never develop detectable serum PPA concentrations. These findings demonstrate that the absence of PPA in the serum does not exclude therapeutic paracetamol use.
Competing Interests
All authors have completed the Unified Competing Interest form at www.icmje.org/coi_disclosure.pdf (available on request from the corresponding author) and declare: no support from any organization for the submitted work; no financial relationships with any organizations that might have an interest in the submitted work in the previous 3 years; no other relationships or activities that could appear to have influenced the submitted work.
Heard, K. , Green, J. L. , Anderson, V. , Bucher‐Bartelson, B. , and Dart, R. C. (2016) Paracetamol (acetaminophen) protein adduct concentrations during therapeutic dosing. Br J Clin Pharmacol, 81: 562–568. doi: 10.1111/bcp.12831.
References
- 1. Bond GR. Acetaminophen protein adducts: a review. Clin Toxicol 2009; 47: 2–7. [DOI] [PubMed] [Google Scholar]
- 2. Muldrew KL, James LP, Coop L, McCullough SS, Hendrickson HP, Hinson JA, Mayeux PR. Determination of acetaminophen‐protein adducts in mouse liver and serum and human serum after hepatotoxic doses of acetaminophen using high‐performance liquid chromatography with electrochemical detection. Drug Metab Dispos 2002; 30: 446–51. [DOI] [PubMed] [Google Scholar]
- 3. Davern TJ 2nd, James LP, Hinson JA, Polson J, Larson AM, Fontana RJ, Lalani E, Munoz S, Shakil AO, Lee WM. Measurement of serum acetaminophen‐protein adducts in patients with acute liver failure. Gastroenterology 2006; 130: 687–94. [DOI] [PubMed] [Google Scholar]
- 4. James LP, Alonso EM, Hynan LS, Hinson JA, Davern TJ, Lee WM, Squires RH. Detection of acetaminophen protein adducts in children with acute liver failure of indeterminate cause. Pediatrics 2006; 118: e676–81. [DOI] [PubMed] [Google Scholar]
- 5. James LP, Letzig L, Simpson PM, Capparelli E, Roberts DW, Hinson JA, Davern TJ, Lee WM. Pharmacokinetics of acetaminophen‐protein adducts in adults with acetaminophen overdose and acute liver failure. Drug Metab Dispos 2009; 37: 1779–84. [DOI] [PMC free article] [PubMed] [Google Scholar]
- 6. Khandelwal N, James LP, Sanders C, Larson AM, Lee WM. Unrecognized acetaminophen toxicity as a cause of indeterminate acute liver failure. Hepatology 2011; 53: 567–76. [DOI] [PMC free article] [PubMed] [Google Scholar]
- 7. Heard KJ, Green JL, James LP, Judge BS, Zolot L, Rhyee S, Dart RC. Acetaminophen‐cysteine adducts during therapeutic dosing and following overdose. BMC Gastroenterol 2011; 11: 20. [DOI] [PMC free article] [PubMed] [Google Scholar]
- 8. James L, Simpson P, Rahman S, Russo M, Watkins P. Detection of acetaminophen protein adducts in serum during therapeutic dosing of acetaminophen in healthy volunteers (Abstract). Hepatology 2007; 46: 812A. [Google Scholar]
- 9. James LP, Chiew A, Abdel‐Rahman SM, Letzig L, Graudins A, Day P, Roberts D. Acetaminophen protein adduct formation following low‐dose acetaminophen exposure: comparison of immediate‐release vs. extended‐release formulations. Eur J Clin Pharmacol 2013; 69: 851–7. [DOI] [PMC free article] [PubMed] [Google Scholar]
- 10. Heard K, Green JL, Anderson V, Bucher‐Bartelson B, Dart RC. A randomized, placebo‐controlled trial to determine the course of aminotransferase elevation during prolonged acetaminophen administration. BMC Pharmacol Toxicol 2014; 15: 39. [DOI] [PMC free article] [PubMed] [Google Scholar]
- 11. McGill MR, Yan HM, Ramachandran A, Murray GJ, Rollins DE, Jaeschke H. HepaRG cells: a human model to study mechanisms of acetaminophen hepatotoxicity. Hepatology 2011; 53: 974–82. [DOI] [PMC free article] [PubMed] [Google Scholar]
- 12. Cook SF, King AD, Chang Y, Murray GJ, Norris HR, Dart RC, Green JL, Curry SC, Rollins DE, Wilkins DG. Quantification of a biomarker of acetaminophen protein adducts in human serum by high‐performance liquid chromatography–electrospray ionization–tandem mass spectrometry: clinical and animal model applications. J Chromatogr B Analyt Technol Biomed Life Sci 2015; 985: 131–41. [DOI] [PubMed] [Google Scholar]
- 13. Kim RB, O'Shea D. Interindividual variability of chlorzoxazone 6‐hydroxylation in men and women and its relationship to CYP2E1 genetic polymorphisms. Clin Pharmacol Ther 1995; 57: 645–55. [DOI] [PubMed] [Google Scholar]
- 14. Thummel KE, Slattery JT, Ro H, Chien JY, Nelson SD, Lown KE, Watkins PB. Ethanol and production of the hepatotoxic metabolite of acetaminophen in healthy adults. Clin Pharmacol Ther 2000; 67: 591–9. [DOI] [PubMed] [Google Scholar]
- 15. O'Shea D, Davis SN, Kim RB, Wilkinson GR. Effect of fasting and obesity in humans on the 6‐hydroxylation of chlorzoxazone: a putative probe of CYP2E1 activity. Clin Pharmacol Ther 1994; 56: 359–67. [DOI] [PubMed] [Google Scholar]
- 16. James LP, Capparelli EV, Simpson PM, Letzig L, Roberts D, Hinson JA, Kearns GL, Blumer JL, Sullivan JE, Network of Pediatric Pharmacology Research Units, National Institutes of Child Health and Human Development . Acetaminophen‐associated hepatic injury: evaluation of acetaminophen protein adducts in children and adolescents with acetaminophen overdose. Clin Pharmacol Ther 2008; 84: 684–90. [DOI] [PMC free article] [PubMed] [Google Scholar]
- 17. Thulin P, Nordahl G, Gry M, Yimer G, Aklillu E, Makonnen E, Aderaye G, Lindquist L, Mattsson CM, Ekblom B, Antoine DJ, Park BK, Linder S, Harrill AH, Watkins PB, Glinghammar B, Schuppe‐Koistinen I. Keratin‐18 and microRNA‐122 complement alanine aminotransferase as novel safety biomarkers for drug‐induced liver injury in two human cohorts. Liver Int 2014; 34: 367–78. [DOI] [PubMed] [Google Scholar]


