

Abstract
AIM
Dihydropyrimidine dehydrogenase (DPD) deficiency can lead to severe toxicity following 5‐fluorouracil (5FU) or capecitabine (CAP) treatment. Uracil (U) can be used as a probe to determine systemic DPD activity. The present study was performed to assess the sensitivity and specificity of a U loading dose for detecting DPD deficiency.
Methods
Cancer patients with Common Toxicity Score (CTC) grade III or IV toxicity after the first or second cycle of 5‐FU or CAP treatment were asked to participate. Based on DPD activity in PBMCs, patients were divided into two groups: DPD activity in peripheral blood mononuclear cells (PBMCs) <5 nmol mg−1*h−1 (deficient group) and ≥ 5 nmol mg−1*h−1. U 500 mg m–2 was administered orally and plasma concentrations of U and dihydrouracil (DHU) were determined. In the deficient group, polymerase chain reaction amplification of all 23 coding exons and flanking intronic regions of DPYD was performed. A U pharmacokinetic model was developed and used to determine the maximum enzymatic conversion capacity (Vmax) of the DPD enzyme for each patient. The sensitivity and specificity of Vmax, U concentration and the U/DHU concentration ratio were determined.
Results
A total of 47 patients were included (19 DPD deficient, 28 DPD normal). Of the pharmacokinetic parameters investigated, a sensitivity and specificity of 80% and 98%, respectively, was obtained for the U/DHU ratio at t = 120 min.
Conclusions
The high sensitivity of the U/DHU ratio at t = 120 min for detecting DPD deficiency, as defined by DPD activity in PBMCs, showed that the oral U loading dose can effectively identify patients with reduced DPD activity.
Keywords: 5‐fluorouracil, dihydropyrimidine dehydrogenase, pharmacogenetics, pharmacokinetics, uracil
What is Already Known About this Subject
An oral uracil loading dose is suitable as a probe for detecting DPD deficiency.
The oral uracil loading dose has only been investigated by intensive sampling.
The sensitivity and specificity of the test have not yet been established.
What this Study Adds
A limited sampling strategy can replace the intensive sampling scheme.
The oral uracil loading dose can effectively identify patients with reduced DPD activity.
Introduction
5‐Fluorouracil (5‐FU) is extensively metabolized by dihydropyrimidine dehydrogenase (DPD) into fluorodihydrouracil (FDHU) 1, 2, 3, 4. A reduction in DPD activity will result in altered 5‐FU pharmacokinetics (PK) 5, 6, 7, and an increase in exposure to 5FU can cause severe side effects 8. Pre‐emptive testing followed by dose reduction for patients with DPD deficiency might prevent these severe side effects 7. Despite the fact that several tests are available to screen for DPD deficiency, only a few are implemented on a broad scale in a pre‐emptive setting 9. Previously, we showed that administration of an oral loading dose of uracil (U) allows the identification of patients with normal DPD activity and those with a DPD deficiency 10. However, the intensive blood sampling scheme that was used previously is a major drawback for a pre‐emptive setting 10. Quantitative compartmental modelling has proven to be a sensitive tool in describing the mechanisms involved in PK 7. The object of the present study was to develop a limited sampling strategy (LSS), to detect decreased U elimination in patients with a DPD deficiency and to perform a more in‐depth quantitative compartmental PK analysis of plasma U concentrations.
Materials and methods
Patients and study design
Patients from ten hospitals in The Netherlands between August 2006 and December 2013 were included. The study population consisted of cancer patients who suffered from Common Toxicity Score (CTC) grade III or IV toxicity after the first or second cycle of treatment schedules containing 5‐FU or capecitabine. As the incidence of DPD deficiency is relatively low in the Caucasian population (3–5%) 2, only patients with toxicity were included, in order to increase the likelihood of finding DPD‐deficient patients. DPD activity in peripheral blood mononuclear cells (PBMCs) 11 was determined and patients were divided into two groups: patients with DPD activity in PBMCs <5 nmol mg−1*h−1 were considered deficient (deficient group), while patients with activity ≥ 5 nmol mg−1*h−1 were classified as normal with respect to DPD status [normal group, mean ± standard deviation (SD) controls: 9.9 ± 2.8 nmol mg−1*h−1]. The coefficient of variation (CV) and limit of detection (LOD) of this assay have been described previously 11. No discrimination was made between tumour type or adjuvant treatment vs. metastatic disease. The study flow diagram is displayed in Figure 1.
Figure 1.
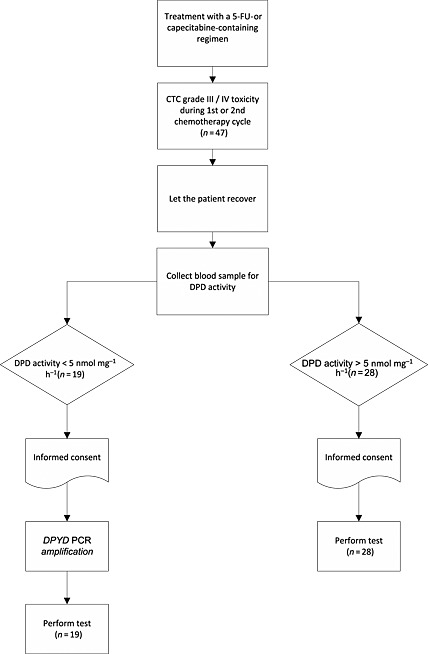
Flowchart of the study design. 5‐FU, 5‐fluorouracil;DPD, dihydropyrimidine dehydrogenase; PCR, polymerase chain reaction
In all participants, U 500 mg m–2 as a loading dose was administered orally, followed by blood sampling as described previously, using two different sampling schemes 10. The U test dose was administered in the morning, at around 08:00 after an overnight fast, to minimize the variance caused by the possible circadian effects of DPD activity and food intake. Plasma concentrations following the loading dose of U and its metabolite dihydrouracil (DHU) were determined by high performance liquid chromatography (HPLC) 12. The CVs of U were 4.8% (4 mg l−1) and 3.7% (18 mg l−1), and of DHU were 8.8% (1 mg l−1) and 5.7% (3 mg l−1). The LOD was 0.060 mg l−1 for both U and DHU. In the deficient group, the genetic analysis of DPYD was performed using polymerase chain reaction amplification of all 23 coding exons and flanking intronic regions, followed by sequence analysis, essentially as described previously 8. In all patients, before the U loading dose was administered, endogenous concentrations of U, thymine, DHU, dihydrothymine, N‐carbamyl‐β‐alanine and N‐carbamyl‐β‐aminoisobutyric acid in the plasma were determined using reversed‐phase HPLC combined with electrospray tandem mass spectrometry 13, 14. The CVs and LOD for this method were described previously 13. The values of creatinine, alanine transaminase (ALAT), gamma‐glutamyl transpeptidase (gamma‐GT) and white blood cell count, measured before the occurrence of fluoropyrimidine‐related toxicity, for all subjects were collected. Toxicity data were collected and scored by the local investigator at each participating hospital according to the CTC version 3. The CTC was scored for the typical fluoropyrimidine side effects of diarrhoea, stomatitis, neutropenia and hand–foot syndrome. The cumulative CTC score for each individual was obtained by calculating the sum of all CTC ratings. The mean cumulative CTC score for each study group was used to compare the toxicity burden between the groups. The study protocol was approved by the Ethics Review Committee of the Martini Hospital Groningen in The Netherlands and all patients gave written informed consent.
PK analysis
All patients received 500 mg m–2 U orally, after which Blood was being taken shortly before intake, and after intake. A full sampling scheme (FSS), in which blood samples were collected at 0, 15, 30, 45, 60, 80, 100, 120, 150, 180 and 240 min, was applied in the first ten patients in both study groups. A limited sampling scheme (LSS), in which blood was taken prior to U intake and at 60 min and 120 min, was applied to all other subjects in both study groups. The time points of the LSS were determined as the optimal LSS points based on the results of an interim analysis, as reported previously 10. The PK parameters that were investigated were the U concentration at t = 120 min, the U/DHU ratio at t = 120 min and the maximum enzymatic conversion capacity (Vmax) value derived from a PK U model. To calculate the Vmax of both study groups, the following approach was used: based on U and DHU concentrations measured in the blood samples from the FSS of both study groups, a population one‐compartment model (EURMIX model) with Michaelis–Menten elimination PK was developed using the ‘KINPOP module’ of MwPharm version 3.50 (Mediware, Groningen, The Netherlands) 15. The elimination parameters were: the Michaelis–Menten constant (KM), Vmax, the apparent volume of the central or plasma compartment in a one‐compartment model (V1) and the absorption constant (ka). PK parameters were assumed to be distributed log‐normally. As no data are available with respect to the oral bioavailability of U, we assumed that 100% of the administered dose was absorbed from the gastrointestinal tract as the gastrointestinal absorption of U is a rapid first‐order PK process 16.
The same principle was used to develop population models for the DPD‐deficient (EURDEF model) and normal DPD (EURNOR model) study groups. The EURMIX model was used to calculate the Vmax of all individual subjects based on the LSS, with the use of an iterative two‐stage Bayesian procedure 15, 17. To establish the performance of the LSS, the FSS data were used for an exploratory internal validation. Using the FSS data, VmaxFSS values were calculated using the EURMIX model. Subsequently, in the same dataset, VmaxLSS values were calculated using the EURMIX model, using only U and DHU data from the t = 60 min and 120 min samples. Both VmaxFSS and VmaxLSS were compared by correlation analysis and the performance of the LSS was considered valid if the mean prediction error was <5% and the root mean square error (RSME) was <10%.
Statistical analysis
The data were tested for a normal distribution by performing the Shapiro–Wilk test. A comparison between the parameters in the two study groups was performed by using the two‐sample Student's t‐test and chi‐square analysis. Receiver operating characteristic (ROC) curves were used to determine the bases of sensitivity of the cut‐off levels (true positive rate) and the specificity (true negative rate). The level of significance was set at P ≤ 0.05. Analysis was performed using the Statistical Package for the Social Sciences (SPSS), version 19 (IBM SPSS Inc., Chicago, IL, USA).
Results
In total, 47 cancer patients, aged >18 years, were included, 19 in the DPD‐deficient group and 28 in the normal DPD group based on DPD enzyme measurement in PBMCs. As several patients were included simultaneously, in different hospitals, after starting the study, the FSS was applied to more than ten patients in each study group. In the deficient and normal groups, the FSS was performed in 14 and 12 patients, respectively. The patient characteristics are displayed in Table 1. Of all the characteristics, only the DPD activity in PBMCs differed significantly between the two groups (P < 0.05). Weight, length, age, liver function and renal function did not differ significantly. From measurement of the endogenous pyrimidine metabolites, we found that none of the metabolite levels or the calculated metabolite ratios was significantly different between the two study groups (P > 0.05). In the DPD‐deficient group, all patients had at least one pathogenic DPYD variant: c.1129‐5923C > G (n = 4), c.2579delA (n = 2), c.2846A > T (n = 3), c.1905 + 1G > A (n = 10) and c.1679 T > G (n = 1). No difference in U PK was observed between the different variants.
Table 1.
Patient characteristics. White blood cells (WBC), thymine (Thy), dihydrouracil (DHU), uracil (U), dihydrothymine (Dht), N‐carbamyl‐β‐alanine (NCbala) and N‐carbamyl‐β‐aminoisobutyric acid (NCbaib)
| Parameter | identity | Mean | Standard deviation | Standard error of the mean | P value |
|---|---|---|---|---|---|
| Weight (kg) | Normal DPD | 70 | 12 | 2.187 | 0.114 |
| DPD deficient | 76 | 14 | 3.176 | ||
| Length (m) | Normal DPD | 170 | 9 | 1.697 | 0.835 |
| DPD deficient | 170 | 8 | 1.812 | ||
| Age (year) | Normal DPD | 63 | 11 | 1.997 | 0.592 |
| DPD deficient | 62 | 10 | 2.408 | ||
| Creatinine (μmol l −1 ) | Normal DPD | 74 | 19 | 3.654 | 0.277 |
| DPD deficient | 81 | 20 | 4.627 | ||
| Alanine transaminase (U l −1 ) | Normal DPD | 28 | 20 | 4.268 | 0.22 |
| DPD deficient | 22 | 6 | 1.572 | ||
| Gamma‐ glutamyl transpeptidase (U l −1 ) | Normal DPD | 107 | 131 | 29.265 | 0.057 |
| DPD deficient | 39 | 31 | 7.964 | ||
| WBC (10 6 l −1 ) | Normal DPD | 6.0 | 1.8 | 0.3761 | 0.596 |
| DPD deficient | 6.4 | 2.4 | 0.5878 | ||
| DPDact in PBMCs (nmol mg −1 *h −1) | Normal DPD | 9.9 | 3.5 | 0.6642 | <0.001 |
| DPD deficient | 3.8 | 1.5 | 0.3426 | ||
| DHU (μmol l −1 ) | Normal DPD | 0.93 | 0.42 | 0.09 | 0.522 |
| DPD deficient | 0.85 | 0.33 | 0.08 | ||
| Dht (μmol l −1 ) | Normal DPD | 0.93 | 0.55 | 0.11 | 0.250 |
| DPD deficient | 0.77 | 0.21 | 0.05 | ||
| NCbala (μmol l −1 ) | Normal DPD | 0.19 | 0.10 | 0.02 | 0.284 |
| DPD deficient | 0.15 | 0.10 | 0.02 | ||
| NCbaib (μmol l −1 ) | Normal DPD | 0.13 | 0.10 | 0.02 | 0.060 |
| DPD deficient | 0.08 | 0.03 | 0.01 | ||
| U (μmol l −1 ) | Normal DPD | 0.25 | 0.10 | 0.02 | 0.205 |
| DPD deficient | 0.29 | 0.10 | 0.02 | ||
| Thy (μmol l −1 ) | Normal DPD | 0.05 | 0.02 | 0.00 | 0.995 |
| DPD deficient | 0.05 | 0.03 | 0.01 | ||
| U/DHU + NC‐bala ratio | Normal DPD | 0.28 | 0.15 | 0.03 | 0.486 |
| DPD deficient | 0.32 | 0.14 | 0.03 | ||
| Thy/Dht + NC‐baib ratio | Normal DPD | 0.06 | 0.04 | 0.01 | 0.949 |
| DPD deficient | 0.06 | 0.04 | 0.01 | ||
| U/NC‐bala ratio | Normal DPD | 1.66 | 1.24 | 0.2491 | 0.125 |
| DPD deficient | 2.31 | 1.32 | 0.3314 | ||
| Thy/NC‐baib ratio | Normal DPD | 0.56 | 0.39 | 0.0789 | 0.265 |
| DPD deficient | 0.77 | 0.77 | 0.1921 |
DPDact, DPD activity; PBMCs, peripheral blood mononuclear cells
PK analysis of U
Table 2 displays the PK parameters of the EURDEF, EURNOR and EURMIX models. There were clear differences between the Vmax values in the different models, and this value was lowest in the DPD‐deficient PK model (mean ± SD 494 ± 133 mg h−1*1.85 m–2) and highest in the population with normal DPD activity (mean ± SD 837 ± 130 mg h−1*1.85 m–2).
Table 2.
Population pharmacokinetic parameter values ± standard deviation estimated in dihydropyrimidine dehydrogenase (DPD)‐deficient subjects (EURDEF model), subjects with normal DPD activity (EURNOR model) and all subjects (EURMIX model)
| Km (mg l −1 ) | V max (mg h −1 *1.85m −2 ) | ka po (h −1 ) | V(l) | |
|---|---|---|---|---|
| EURDEF | 5.99 ± 4.17 | 494 ± 133 | 5.61 ± 7.16 | 0.57 ± 0.09 |
| EURNOR | 7.69 ± 1.38 | 837 ± 130 | 4.65 ± 3.33 | 0.51 ± 0.14 |
| EURMIX | 7.10 ± 3.33 | 641 ± 178 | 5.13 ± 4.87 | 0.55 ± 0.12 |
Ka, absorption constant; Km, Michaelis–Menten constant; po, per oral; V, apparent volume of drug distribution; Vmax, maximum enzymatic conversion capacity.
LSS
Figure 2 displays the correlation between the Vmax calculated using the EURMIX model for the LSS and full sampling for the subjects who underwent the FSS. The root mean square error and the mean prediction error were <7.3% and <1.8%, respectively, showing that Vmax values calculated from the data from the LSS were comparable to those calculated from the full sampling schedule. The Vmax values calculated using the EURMIX model based on the LSS time points in all subjects differed significantly between the two study groups (P < 0.001) (Figure 3).
Figure 2.
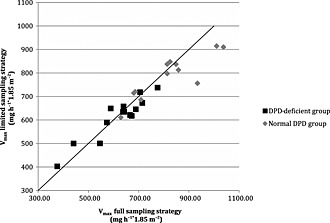
Comparison of maximum enzymatic conversion capacity (Vmax mg h−1*1.85 m−2) values calculated for the limited sampling and full sampling strategy using the EURMIX model. The diagonal line represents y = x
Figure 3.
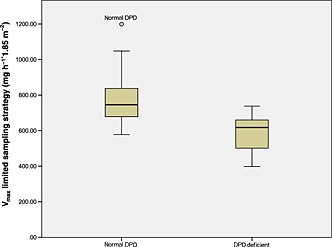
Vmaxlim (mg h−1*1.85 m−2) values calculated using the limited sampling strategy model in normal dihydropyrimidine dehydrogenase (DPD) and DPD‐deficient patients. The top line, bottom line and middle line through the box correspond to the 75th, 50th and 25th percentiles, respectively. The grey circle represents an outlier
Toxicity data
There was no statistical difference observed in the fluoropyrimidine‐specific cumulative toxicity (i.e. diarrhoea, stomatitis, neutropenia and hand–foot syndrome) between the normal DPD and DPD‐deficient groups (P = 0.495). Diarrhoea was the most frequently reported side effect in both study groups. Chi‐square analysis revealed no significant difference in the reported frequencies of CTC grade I, II, III or IV toxicity and toxic side effects (diarrhoea, stomatitis, neutropenia and hand–foot syndrome) between the two study groups (all P values >0.05).
ROC curves
The cut‐off levels for the VmaxLSS value, U/DHUt = 120 min ratio and Ut = 120 min concentrations were estimated by ROC analysis (Figure 4). The data are displayed in Table 3. For the U/DHUt = 120 min ratio, a cut‐off level of 2.4 would result in a sensitivity of 80% and a specificity of 98%, with a positive predictive value of 67% and a negative predictive value of 99% to discriminate between subjects with normal DPD activity and those who are DPD deficient. The cut‐off levels of VmaxLSS and Ut = 120 min showed lower specificity values when a sensitivity of 80% was chosen.
Figure 4.
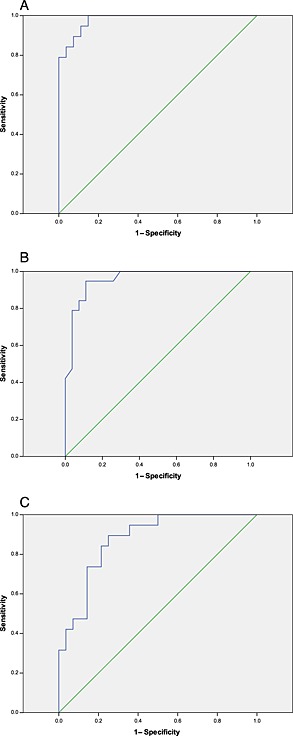
Receiver operating characteristic (ROC) curves for (A) the uracil/ dihydropyrimidine dehydrogenase (U/DHU) ratio at t = 120 min; (B) U concentration at t = 120 min; and (C) maximum enzymatic conversion capacity for the limited sampling strategy (VmaxLSS). The areas under the curve are 0.981; 0.957 and 0.874 for U/DHU at t = 120 min, U concentration at t = 120 min and VmaxLSS, respectively
Table 3.
Sensitivity, specificity and cut‐off levels for maximum enzymatic conversion capacity (Vmax) limited sampling
| Test parameter | Cut‐off level | Sensitivity (%) | Specificity (%) | npv% | ppv% |
|---|---|---|---|---|---|
| V max (mg h −1 *1.85 m −2 ) | 667 | 80 | 78 | 99 | 16 |
| U/DHU t = 120 min ratio | 2.4 | 80 | 98 | 99 | 67 |
| U t = 120 min (mg l −1 ) | 6.4 | 80 | 96 | 99 | 51 |
The uracil/dihydropyrimidine dehydrogenase ratio at t = 120 min (U/DHUt = 120 min) and U concentration at t = 120 min (Ut = 120 min) were derived from receiver operating characteristic curves. npv, negative predictive value; ppv, = positive predictive value.
Discussion
In the present study, we developed an LSS model as a screening tool for DPD deficiency. Several parameters were evaluated with respect to the sensitivity and specificity of DPD deficiency. Based on our experience in the field of 5‐FU PK modelling 7, We investigated the potential value of a Vmax model to interpretate U pharmacokinetics. The PK models for a DPD‐deficient population and normal DPD population revealed significant differences in Vmax, which in the deficient population was 42% lower than in the normal population. Despite this significant difference, there was an overlap in Vmax because of the Gaussion distribution within the population. This result is in line with the results of the PK analysis of 5‐FU plasma levels performed by van Kuilenburg et al. 7 and also with the fact that the mean DPD activity in patients who are heterozygous for a DPYD mutation is 48% of that observed in controls 7. We validated the VmaxLSS model by using LSS and FSS data in a single population. This can be problematic because validation results and sensitivity/specificity values might be falsely influenced and elevated by this approach. Our validation involved only an exploratory internal validation of the model, in which each case acted as its own control. We realize that this should have been followed by an external validation, in which a different population was used. There are two reasons why we did not perform this external validation. First, despite the fact that sensitivity and specificity results might be falsely influenced and elevated, the sensitivity and specificity are still low compared with the U/DHU ratio. We consider it unlikely that external validation would result in higher sensitivity and specificity compared to the U/DHU ratio. Secondly, to work with Vmax and PK modelling, highly sophisticated software and knowledge of PK are necessary, and these are not present in every hospital. This latter issue means that Vmax is not a suitable candidate for use in a test performed in a prospective setting. The results of the present study showed that the U/DHUt = 120 min ratio is superior to Vmax as a discriminating parameter. A possible explanation for this is that the calculated Vmax value was based on plasma U data only. Plasma DHU data were not included in the model. Compared with a previously developed intravenous 5FU PK model 7, the oral U PK model is more complex owing to interindividual variability in bioavailability. Theoretically, the prediction of Vmax might improve when DHU data are included in a Michaelis–Menten PK model.
The arrangement of the two study groups was based on the DPD activity in PBMCs. This enzymatic assay is influenced by factors such as the lymphocyte, granulocyte and monocyte composition in peripheral blood and the protein concentration. In the present study, however, we took into account all of the potential pitfalls of this assay, as identified previously 11. The results of the analysis in the present study did not identify any outliers in the study population. The power of the DPD activity assay was further demonstrated by the fact that, in the deficient group, pathogenic DPYD variants were detected in all subjects.
The study population consisted of patients with a history of severe toxicity while treated with 5‐FU or capecitabine in order to increase the likelihood to find DPD deficient subjects. The results can therefore only be interpreted for this population. Theoretically, it is highly possible that patients in the DPD normal group might have varying degrees of DPD deficiency. This makes it difficult to apply the results to the general cancer population that also consists of patients without toxicity. Further research is needed to determine if the results of the present study also apply to the general population. In our study, we defined patients with a DPD activity in PBMCs <5 nmol mg−1*h−1 as DPD deficient. This might lead to the discussion if a different value for DPD activity will result in a different sensitivity and specificity. In order to investigate this, we performed a sensitivity analysis in which we calculated the sensitivity and specificity by ROC analysis, based on DPD activity cut‐off levels of <5.5 nmol mg−1*h−1 and <6.0 nmol mg−1*h−1; this resulted in a specificity of 92.3% and 90.9%, respectively, at a sensitivity of 80%. This shows that the cut‐off chosen in the present study will have had the smallest percentage of false‐positive test results.
The LSS is an important improvement compared with the full sampling scheme that was used previously 9, and is more convenient for the patient. As the prevalence of partial DPD deficiency in the general population is at least 3–5% 2, a prospective test in order to detect deficiency has to be applied to a large number of patients to find those few individuals with a low DPD activity. We decided to choose a cut‐off level for our test whereby the number of individuals with true‐positive results favours the number of individuals with false‐positive results. In a population of 1000 persons and an incidence of 5%, a sensitivity of 80% and a specificity of 98%, there will be 40 individuals with a true‐positive test result and 19 with a false‐positive test result, leading to a positive predictive value of 67%. As positive test cases are at risk of developing severe toxicity when fully dosed, we recommend that a dose reduction of 50% should at least be considered, in line with the recommendations of the Royal Dutch Association for the Advancement of Pharmacy for DPYD genotyping 19. After an initial dose reduction and no toxicity, a dose‐escalation strategy could be followed in small steps, based on the clinical tolerability observed after each treatment cycle.
How do the results of the present study compare with other strategies that are developed to detect DPD deficiency or prevent fluoropyrimidine‐related toxicity? There have been several genotyping studies in which sensitivity and specificity were established 20, 21 but it is difficult to compare our study results with these as the previous studies used different endpoints to the DPD activity that was used in our study. Only a head‐to‐head study would enable a fair comparison to be made between a genotyping and phenotyping strategy.
Compared with genotyping, one advantage of phenotyping test strategies is that genetic variants outside the DPYD coding region resulting in either systemically altered DPD activity or altered 5‐FU metabolism will be detected using these approaches. The incidence of these genetic variants is very low, however, as was proved by the fact that all subjects in the deficient group had variants inside the DPYD coding region.
Among the included subjects, we identified one individual with a normal DPD activity in PBMCs of 8.3 nmol mg−1*h−1 who had highly elevated U and DHU levels equal to the U and DHU levels in the DPD deficient group. Mutation analysis of DPYD in this individual revealed the presence of the pathogenic c.1905 + 1G > A variant. Heterozygosity for this mutation, in combination with a low but normal DPD activity, has been described previously by van Kuilenburg et al. 18. Another individual included in the present study had a very low DPD activity in PBMCs of 1.0 nmol mg−1*h−1 but the oral loading dose test results showed U and DHU levels considerably lower than those in the other DPD‐deficient subjects. Additional sequence analysis of DPYD in this case showed that there were no DPYD variants present. This observation has been previously described by others investigators 8. These two cases showed that the results of the oral U loading test in these individuals correlated better with the results of genotyping than did the DPD activity in PBMCs which was used as the gold standard for inclusion in the present study.
It has been reported that homozygosity for mutant DPD alleles can lead to complete DPD deficiency, resulting in elevated concentrations of endogenous pyrimidine degradation metabolites 22 and neurological disorders in children. In the present study, all patients were heterozygous for mutant DPD alleles and were only partially DPD deficient. Catabolism of the pyrimidine bases thymine and U consists of three consecutive steps 13. The high concentrations of pyrimidine metabolites that accumulate in patients with a defect in the enzyme responsible for pyrimidine degradation, compared with controls, could make identification of such patients feasible. DHU is not a metabolic end‐product but is further degraded into N‐carbamyl‐β‐alanine. In the present study, we found no statistical differences in the levels of any pyrimidine metabolites between the two study groups. Based on our results, we see no beneficial effect in measuring these metabolites in heterozygous DPD‐deficient patients.
The U/DHU ratio at t = 2 h after U ingestion appears to be an easy‐to‐calculate biomarker for predicting the U to DHU conversion rate, and can be implemented in daily practice in most hospitals. The HPLC equipment needed for the U and DHU assay is present in most hospital laboratories or pharmacies. Based on our experience, we estimate that the cost price of the oral U loading dose currently stands at around 110 euros. Additional improvement in the test principle and assay could decrease this price further. A thorough analysis of cost‐effectiveness should be performed to establish the total cost when this test is used in a prospective setting in all patients with an indication for fluoropyrimidine‐containing therapy. Based on our results, we conclude that the U/DHU ratio a t = 120 min following an oral loading dose, is a suitable parameter for identifying patients at risk of developing severe toxicity as a result of DPD deficiency with a high sensitivity and specificity.
Competing Interest
All authors have completed the Unified Competing Interest form at www.icmje.org/coi_disclosure.pdf (available on request from the corresponding author). J. G. Maring received support from Roche Netherlands and stichting Prisma/Albert Bakker fonds, The Netherlands, by an unrestricted grant for the submitted work. All other authors received no support from any organization for the submitted work. All authors declare no financial relationships with any organizations that might have an interest in the submitted work in the previous 3 years and no other relationships or activities that could appear to have influenced the submitted work.
van Staveren, M. C. , van Kuilenburg, A. B. P. , Guchelaar, H.‐J. , Meijer, J. , Punt, C. J. A. , de Jong, R. S. , Gelderblom, H. , and Maring, J. G. (2016) Evaluation of an oral uracil loading test to identify DPD‐deficient patients using a limited sampling strategy. Br J Clin Pharmacol, 81: 553–561. doi: 10.1111/bcp.12821.
References
- 1. Diasio RB, Harris BE. Clinical pharmacology of 5‐fluorouracil. Clin Pharmacokinet 1989; 16: 215–37. [DOI] [PubMed] [Google Scholar]
- 2. Etienne MC, Lagrange JL, Dassonville O, Fleming R, Thyss A, Renee N, Schneider M, Demard F, Milano G. Population study of dihydropyrimidine dehydrogenase in cancer patients. J Clin Oncol 1994; 12: 2248–53. [DOI] [PubMed] [Google Scholar]
- 3. Harris BE, Song R, Soong SJ, Diasio RB. Relationship between dihydropyrimidine dehydrogenase activity and plasma 5‐fluorouracil levels with evidence for circadian variation of enzyme activity and plasma drug levels in cancer patients receiving 5‐fluorouracil by protracted continuous infusion. Cancer Res 1990; 50: 197–201. [PubMed] [Google Scholar]
- 4. Fleming RA, Milano G, Thyss A, Etienne MC, Renee N, Schneider M, Demard F. Correlation between dihydropyrimidine dehydrogenase activity in peripheral mononuclear cells and systemic clearance of fluorouracil in cancer patients. Cancer Res 1992; 52: 2899–902. [PubMed] [Google Scholar]
- 5. Maring JG, van Kuilenburg AB, Haasjes J, Piersma H, Groen HJ, Uges DR, van Gennip AH, De Vries EG. Reduced 5‐FU clearance in a patient with low DPD activity due to heterozygosity for a mutant allele of the DPYD gene. Br J Cancer 2002; 86: 1028–33. [DOI] [PMC free article] [PubMed] [Google Scholar]
- 6. van Kuilenburg AB, Maring JG, Schalhorn A, Terborg C, Schmalenberg H, Behnke D, Schwabe W, Jabschinsky K, Hausler P. Pharmacokinetics of 5‐fluorouracil in patients heterozygous for the IVS14 + 1G > A mutation in the dihydropyrimidine dehydrogenase gene. Nucleosides Nucleotides Nucleic Acids 2008; 27: 692–8. [DOI] [PubMed] [Google Scholar]
- 7. van Kuilenburg AB, Hausler P, Schalhorn A, Tanck MW, Proost JH, Terborg C, Behnke D, Schwabe W, Jabschinsky K, Maring JG. Evaluation of 5‐fluorouracil pharmacokinetics in cancer patients with a c.1905 + 1G > A mutation in DPYD by means of a Bayesian limited sampling strategy. Clin Pharmacokinet 2012; 51: 163–74. [DOI] [PubMed] [Google Scholar]
- 8. van Kuilenburg AB, Haasjes J, Richel DJ, Zoetekouw L, van Lenthe H, De Abreu RA, Maring JG, Vreken P, Can Gennip AH. Clinical implications of dihydropyrimidine dehydrogenase (DPD) deficiency in patients with severe 5‐fluorouracil‐associated toxicity: identification of new mutations in the DPD gene. Clin Cancer Res 2000; 6: 4705–12. [PubMed] [Google Scholar]
- 9. van Staveren MC, Jan GH, van Kuilenburg AB, Gelderblom H, Maring JG. Evaluation of predictive tests for screening for dihydropyrimidine dehydrogenase deficiency. Pharmacogenomics J 2013; 13: 389–95. [DOI] [PubMed] [Google Scholar]
- 10. van Staveren MC, Theeuwes‐Oonk B, Guchelaar HJ, van Kuilenburg AB, Maring JG. Pharmacokinetics of orally administered uracil in healthy volunteers and in DPD‐deficient patients, a possible tool for screening of DPD deficiency. Cancer Chemother Pharmacol 2011; 68: 1611–7. [DOI] [PMC free article] [PubMed] [Google Scholar]
- 11. van Kuilenburg AB, van Lenthe H, Tromp A, Veltman PC, Van Gennip AH. Pitfalls in the diagnosis of patients with a partial dihydropyrimidine dehydrogenase deficiency. Clin Chem 2000; 46: 9–17. [PubMed] [Google Scholar]
- 12. Maring JG, Schouten L, Greijdanus B, de Vries EG, Uges DR. A simple and sensitive fully validated HPLC‐UV method for the determination of 5‐fluorouracil and its metabolite 5,6‐dihydrofluorouracil in plasma. Ther Drug Monit 2005; 27: 25–30. [DOI] [PubMed] [Google Scholar]
- 13. van Lenthe H, van Kuilenburg AB, Ito T, Bootsma AH, van Cruchten A, Wada Y, van Gennip AH. Defects in pyrimidine degradation identified by HPLC‐electrospray tandem mass spectrometry of urine specimens or urine‐soaked filter paper strips. Clin Chem 2000; 46: 1916–22. [PubMed] [Google Scholar]
- 14. van Kuilenburg AB, van Lenthe H, van Cruchten A, Kulik W. Quantification of 5,6‐dihydrouracil by HPLC‐electrospray tandem mass spectrometry. Clin Chem 2004; 50: 236–8. [DOI] [PubMed] [Google Scholar]
- 15. Proost JH, Meijer DK. MW/Pharm, an integrated software package for drug dosage regimen calculation and therapeutic drug monitoring. Comput Biol Med 1992; 22: 155–63. [DOI] [PubMed] [Google Scholar]
- 16. Ito S, Kawamura T, Inada M, Inoue Y, Hirao Y, Koga T, Kunizaki J, Shimizu T, Sato H. Physiologically based pharmacokinetic modelling of the three‐step metabolism of pyrimidine using C‐uracil as an in vivo probe. Br J Clin Pharmacol 2005; 60: 584–93. [DOI] [PMC free article] [PubMed] [Google Scholar]
- 17. Proost JH, Eleveld DJ. Performance of an iterative two‐stage Bayesian technique for population pharmacokinetic analysis of rich data sets. Pharm Res 2006; 23: 2748–59. [DOI] [PubMed] [Google Scholar]
- 18. van Kuilenburg AB, Meinsma R, Zoetekouw L, Van Gennip AH. Increased risk of grade IV neutropenia after administration of 5‐fluorouracil due to a dihydropyrimidine dehydrogenase deficiency: high prevalence of the IVS14 + 1 g > a mutation. Int J Cancer 2002; 101: 253–8. [DOI] [PubMed] [Google Scholar]
- 19. Swen JJ, Nijenhuis M, de Boer A, Grandia L, Maitland‐van der Zee AH, Mulder H, Rongen GA, van Schaik RH, Schalekamp T, Touw DJ, van der Weide J, Wilffert B, Deneer VH, Guchelaar HJ. Pharmacogenetics: from bench to byte – an update of guidelines. Clin Pharmacol Ther 2011; 89: 662–73. [DOI] [PubMed] [Google Scholar]
- 20. Terrazzino S, Cargnin S, Del RM, Danesi R, Canonico PL, Genazzani AA. DPYD IVS14 + 1G > A and 2846A > T genotyping for the prediction of severe fluoropyrimidine‐related toxicity: a meta‐analysis. Pharmacogenomics 2013; 14: 1255–72. [DOI] [PubMed] [Google Scholar]
- 21. Loganayagam A, Arenas HM, Corrigan A, Fairbanks L, Lewis CM, Harper P, Maisey N, Ross P, Sanderson JD, Marinaki AM. Pharmacogenetic variants in the DPYD, TYMS, CDA and MTHFR genes are clinically significant predictors of fluoropyrimidine toxicity. Br J Cancer 2013; 108: 2505–15. [DOI] [PMC free article] [PubMed] [Google Scholar]
- 22. van Kuilenburg AB, Vreken P, Abeling NG, Bakker HD, Meinsma R, van Lenthe H, De Abreu RA, Smeitink JA, Kayserili H, Apak MY, Christensen E, Holopainen I, Pulkki K, Riva D, Botteon G, Holme E, Tulinius M, Kleijer WJ, Beemer FA, Duran M, Niezen‐Koning KE, Smit GP, Jakobs C, Smit LM, van Gennip AH. Genotype and phenotype in patients with dihydropyrimidine dehydrogenase deficiency. Hum Genet 1999; 104: 1–9. [DOI] [PubMed] [Google Scholar]