

Abstract
Abnormal fibroblast function underlies poor wound healing in patients with diabetes; however, the mechanisms that impair wound healing are poorly defined. Here, we evaluated fibroblasts from individuals who had type 1 diabetes (T1D) for 50 years or more (Medalists, n = 26) and from age-matched controls (n = 7). Compared with those from controls, Medalist fibroblasts demonstrated a reduced migration response to insulin, lower VEGF expression, and less phosphorylated AKT (p-AKT), but not p-ERK, activation. Medalist fibroblasts were also functionally less effective at wound closure in nude mice. Activation of the δ isoform of protein kinase C (PKCδ) was increased in postmortem fibroblasts from Medalists, fibroblasts from living T1D subjects, biopsies of active wounds of living T1D subjects, and granulation tissues from mice with streptozotocin-induced diabetes. Diabetes-induced PKCD mRNA expression was related to a 2-fold increase in the mRNA half-life. Pharmacologic inhibition and siRNA-mediated knockdown of PKCδ or expression of a dominant-negative isoform restored insulin signaling of p-AKT and VEGF expression in vitro and improved wound healing in vivo. Additionally, increasing PKCδ expression in control fibroblasts produced the same abnormalities as those seen in Medalist fibroblasts. Our results indicate that persistent PKCδ elevation in fibroblasts from diabetic patients inhibits insulin signaling and function to impair wound healing and suggest PKCδ inhibition as a potential therapy to improve wound healing in diabetic patients.
Introduction
Chronic foot ulcers are one of the most common and serious complications of diabetes, resulting in more than 80,000 amputations per year as well as high health care costs (1, 2). The presence of peripheral vascular disease, neuropathy, insulin resistance, and reduced resistance to infection, in association with poor glycemic control, are recognized risk factors for poor wound healing in individuals with diabetes (2). Wound healing results from the complex biological and molecular events of angiogenesis, cell adhesion, migration, proliferation, differentiation, and extracellular matrix (ECM) deposition (3, 4). Abnormalities in each of these steps have been reported in patients with diabetes (5). However, the identification of mechanisms and therapeutic targets that contribute to poor wound healing in diabetic patients has been challenging and needs further clarification.
The systemic changes characteristic of diabetes progression, including hyperglycemia (6, 7), insulin resistance (8), obesity (9, 10), and subsequent microvascular (11–14) or macrovascular complications (15), as well as localized factors, have been associated with an increased risk of diabetic foot ulcers. Multiple treatment modalities using cytokine replacement (16) and transplantation of keratinocytes or fibroblasts are effective in nondiabetic populations (17–19), but their efficacy in patients with diabetes is diminished as a result of undetermined mechanisms (17).
Fibroblasts have emerged in recent years as a primary cell for regenerative therapy due to their paracrine secretion of angiogenic factors, cytokines, and immunomodulatory substances (20, 21). However, similar to cytokine therapies, fibroblast therapy is clinically less effective in patients with diabetes than in nondiabetic persons (22), even with autologous transplants. These findings suggest the presence of metabolic memory in cultured fibroblasts from diabetic donors or an ability of the diabetic milieu to rapidly induce cellular abnormalities in normal fibroblasts (5, 23).
Numerous factors are involved in the dynamic wound-healing process. PDGF, TGF-β1, and TGF-β2, VEGF, FGF, EGF, TNF-α, and various inflammatory cytokines have crucial roles in wound healing (24). In addition, insulin action and hyperglycemia can affect key aspects of wound healing due to their role in cellular migration and proliferation. To understand the mechanisms of wound healing that are affected in the presence of diabetes, we studied the fibroblasts of individuals with 50 or more years of type 1 diabetes (T1D) from the Joslin Medalist study (n = 26) and age-matched controls (n = 7).
The Medalists were extensively phenotyped by clinical examination and assessed for the presence of complications including neuropathy, nephropathy, proliferative diabetic retinopathy, and cardiovascular disease (CVD) (25–27). This patient population’s long duration of exposure to hyperglycemia and thorough clinical phenotyping provided the unusual opportunity to contrast wound healing in those with and without various diabetic complications. A second advantage of the Medalist cohort is that they lacked factors that would confound the study of insulin action and hyperglycemia, as they were relatively lean (BMI <25 kg/m2) and not hyperinsulinemic or hyperlipidemic. This enabled the elucidation of wound-healing impairment due to aberrations in insulin signaling and hyperglycemia in the context of complication status.
Results
Clinical characteristics of Medalists and nondiabetic controls.
Fibroblasts were obtained from 26 patients with T1D (Medalists) and from 7 age-matched donors without diabetes (controls). For the Medalists and controls, the median (Q1, Q3) ages were 79 years (56–93 years) and 76 years (63–84 years), respectively. For the Medalists, the median age of diabetes diagnosis was 12 years (3–30 years), and the age at participation in the study was 67 years (51–85 years). The median glycated hemoglobin (HbA1c) levels were 7.2% (5.6%–9.0%), and BMI was 24.8 (22.5–27.5) kg/m2. Of the Medalists, 57.7% had hypertension, defined as a blood pressure of 135/85 mmHg or greater, or use of antihypertensive medications (Table 1).
Table 1. Baseline characteristics of the 50-year Medalist group and the nondiabetic control group.
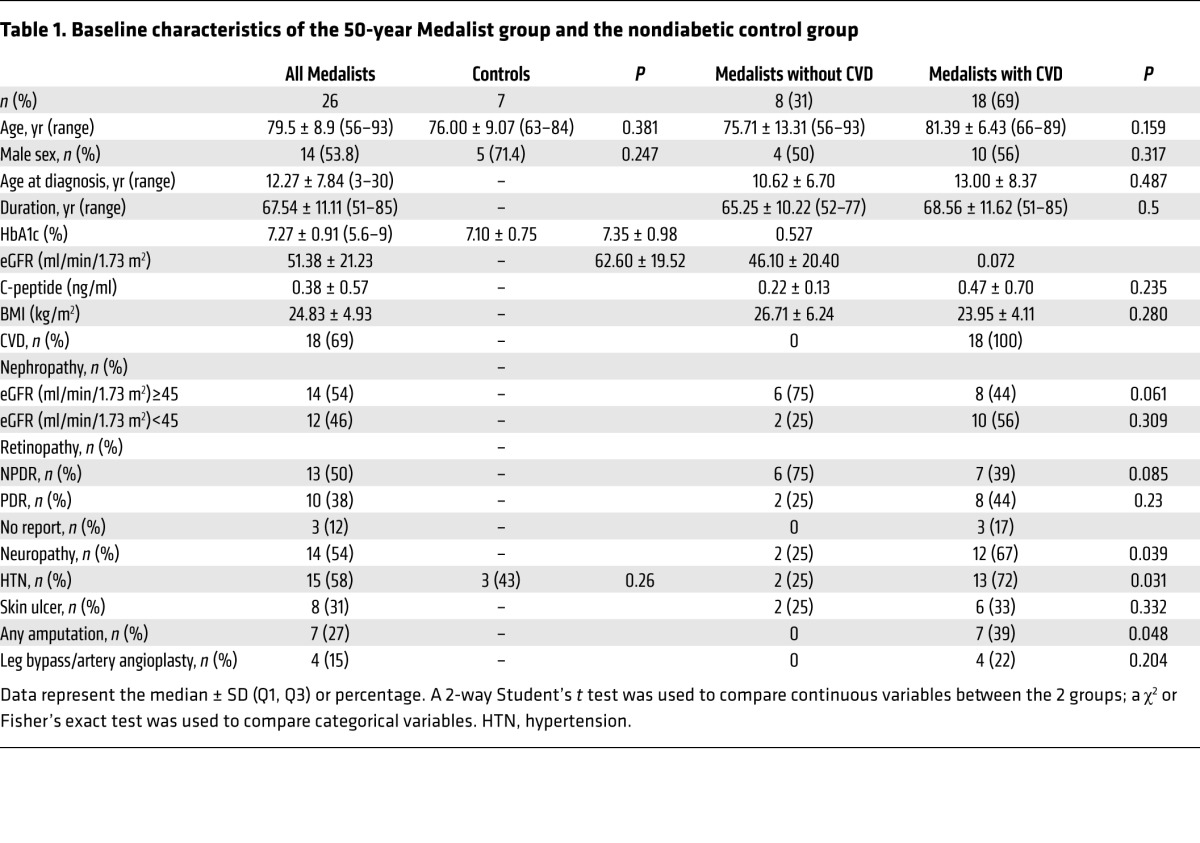
Of the 26 Medalists, 69% (18 Medalists) reported a history of CVD (Table 1 and Supplemental Table 1; supplemental material available online with this article; doi:10.1172/JCI82788DS1). Of these, 39% (7 Medalists) reported amputation (toe, below or above the knee) and 22% (4 Medalists) reported lower-extremity peripheral vascular disease (PVD). No PVD or amputation was reported by the 31% (8 Medalists) of Medalists who did not report CVD (Table 1 and Supplemental Table 1). Compared with the Medalists without CVD, those with CVD had a higher rate of diabetic nephropathy, defined by an estimated glomerular filtration rate (eGFR) of less than 45 ml/min/1.73 m2: 56% (10 Medalists) versus 25% (2 Medalists); a higher rate of proliferative diabetic retinopathy (PDR): 44% (8 Medalists) versus 25% (2 Medalists); a higher rate of neuropathy: 67% (12 Medalists) versus 25% (2 Medalists); and a lower rate of nonproliferative diabetic retinopathy (NPDR): 39% (7 Medalists) versus 75% (6 Medalists) (ref. 6 and Table 1).
Effect of glucose, insulin, and hypoxia on VEGF expression.
Basal VEGF protein secretion (Figure 1A) and mRNA levels (Figure 1B) were lower in the fibroblasts from Medalists than in those from controls (95.5 ± 26 pg/mg protein vs. 210.7 ± 19.3 pg/mg protein, P = 0.004, and 0.50% ± 0.07% vs. 1.00% ± 0.05%, P < 0.001, respectively).
Figure 1. Effect of glucose, insulin, and hypoxia on VEGF expression.

Basal VEGF protein (A) and mRNA (B) levels (cells were incubated with DMEM medium only) after incubation with 100 nM insulin and after incubation for 16 hours under 5% O2 hypoxic conditions. VEGF protein levels secreted into the medium were measured using an ELISA kit, which determined mainly VEGF165. qPCR using the human VEGF primers detailed in Supplemental Figure 9 was performed to determine VEGF mRNA expression levels. Data represent the mean ± SD for 7 control subjects and 26 Medalists, each in triplicate. (C) VEGF protein expression after incubation of control and Medalist fibroblasts in 5.6 mM or 25 mM glucose for 24, 48, and 72 hours. Osmolality in 5.6 nM conditions was corrected using mannitol. A Student’s t test or χ2 test was used for 2-way comparisons based on the distribution and number of observations of the variable.
Similarly, in fibroblasts from both controls and Medalists incubated with 25 mM glucose for 3 days, VEGF protein production was significantly reduced (24 hours: 71.8% ± 22.7%; 48 hours: 63.3% ± 22.2%; 72 hours: 26.5% ± 8.7% on day 0 at 5.6 mM glucose in control cells and 93.3% ± 20.2%, 57.7% ± 14.6%, and 20.3% ± 3.0% on day 0 at 5.6 mM glucose in Medalist cells) (Figure 1C). Hypoxia and insulin stimulation increased VEGF protein levels by 77% (P = 0.027) and 66% (P < 0.001), respectively, and VEGF mRNA levels by 3.8-fold and 2.4-fold (P = 0.001), respectively, in fibroblasts from controls. However, in fibroblasts from Medalists, both hypoxia and insulin failed to significantly stimulate VEGF protein (Figure 1A) and mRNA (Figure 1B) production. Stratifying the Medalists by neuropathy also revealed a differential response to insulin stimulation: the response was lower in fibroblasts from patients with neuropathy than in fibroblasts from patients without neuropathy (Supplemental Figure 1A). Differences were not seen in responses to insulin or hypoxia stimulation for other strata of diabetes complications (Supplemental Figure 1, B and C). In contrast to the finding of reduced VEGF secretion in the Medalist fibroblasts compared with that seen in the controls, TGF-β expression in fibroblasts from both groups was not different (data not shown). Furthermore, we evaluated the effect of TGF-β to induce VEGF expression and secretion into the media. The results clearly showed that VEGF induced by TGF-β was blunted in fibroblasts from Medalists compared with that detected in controls (Supplemental Figure 2).
Effect of glucose levels or growth factors on fibroblast migration and proliferation.
In Medalist patients compared with controls, less fibroblast migration was observed, as measured by the scratch assay (59 ± 11 vs. 147 ± 7 pixels, P < 0.01) (Figure 2, A–C), and less cell migration in Matrigel chambers (347 ± 43 vs. 685 ± 65 migrated cells, P < 0.01) (Figure 2D). Furthermore, incubation of fibroblasts from controls and Medalists with 25 mM glucose for either 8 hours (Figure 2B) or 3 days (Figure 2C) revealed significantly decreased fibroblast migration. PDGF-ΒΒ increased cell migration significantly in fibroblasts from both controls and Medalists (Figure 2E). However, insulin increased cell migration in control fibroblasts by 1.7-fold (P < 0.05) but failed to significantly increase cell migration in Medalist fibroblasts (Figure 2E). TGF-β and fibronectin protein expression (Figure 2, F–H) and TGFB and fibronectin mRNA levels (Figure 2, I and J) were increased in the Medalist fibroblasts compared with control fibroblasts (293.5 ± 40.0 AU vs. 100 ± 10 AU, P < 0.01; 167 ± 35 AU vs. 100 ± 10 AU, P < 0.05; 1.75- ± 0.25-fold vs. 1.0- ± 0.1-fold, P < 0.05; and 2.8- ± 0.4-fold vs. 1.0- ± 0.1-fold, P < 0.01, respectively). Fibroblast proliferation, as determined by BrdU incorporation (Supplemental Figure 3A) or flow cytometry (Supplemental Figure 3B) showed no significant difference between Medalists and controls (0.35% ± 0.04% vs. 0.42% ± 0.08%, 8.9% ± 2.2% vs. 5.2% ± 1.5% in the S phase and 24.7% ± 10.0% vs. 28.2% ± 4.9 % in the M phase, respectively).
Figure 2. Effect of high glucose levels on fibroblast migration and ECM protein secretion.

(A) Representative image of the scratch wound migration assay. (B and C) Quantification of migrated cells after incubation with 25 mM glucose for 8 hours and 3 days, respectively. Osmolality in 5.6 nM conditions was corrected using mannitol. The images acquired for each sample were analyzed quantitatively using Image-Pro Plus software (Media Cybernetics). (D) Fibroblast migration determined in a Matrigel invasion chamber. (E) Scratch wound migration assay on control and Medalist fibroblasts stimulated with 10 ng/ml PDGF-BB or 100 nM insulin for 12 hours. Data represent the mean ± SD for 7 controls and 26 Medalists, each in triplicate. Representative immunoblots (F) and quantification of TGF-β (G) and fibronectin (H) protein levels in control and Medalist fibroblasts. (I) TGFB and (J) fibronectin mRNA expression levels in Medalist fibroblasts. Basal mRNA expression levels in control fibroblasts was set to 1. A Student’s t or χ2 test was used for 2-way comparisons based on the distribution and number of observations of the variable.
Medalist fibroblasts display impaired wound healing in vivo.
To investigate the functional properties of fibroblasts in wound repair, an Integra Dermal Regeneration Template, consisting of a collagen-glycosaminoglycan (GAG) scaffold bilayer matrix wound dressing, was used to transfer human adenoviral vectors containing GFP-labeled fibroblasts from controls and Medalists to a dorsal full-thickness cutaneous wound model in nude mice. For controls and Medalists, the presence of human fibroblasts on the Integra membrane before transplantation was confirmed by H&E staining (Supplemental Figure 4, A–C) and GFP-labeled cells (Supplemental Figure 4, D and E). Characterization of fibroblasts on the Integra membrane in the wound granulation tissues 9 days after transplantation was demonstrated by IHC for expression of human vimentin (Supplemental Figure 5, D–F) and MHC class 1 (Supplemental Figure 5, G–I) and by immunofluorescence (IF) for expression of human vimentin (Supplemental Figure 5, A–C).
Wound areas were macroscopically quantitated by the proportion of the wound surface not covered by an epithelial layer, divided by the original wound area. In experiments using control fibroblasts, the wound area covered 35% on day 9 and 15% on day 15 (Figure 3, A and B), contrasting with 65% and 60%, respectively, in experiments using Medalist fibroblasts (Figure 3, A and B). The efficiency of wound healing in H&E-stained sections was assessed 9, 12, and 15 days after initial wounding by measuring the distance between the bilateral edges of the granulation tissues consisting of newly formed capillaries, fibroblasts, and macrophages (Figure 3C). Among the specimens with transplanted control cells on the Integra membrane, the entire granulation area was completely healed by day 15, compared with healing of only 60% (P < 0.05) in specimens with Medalist cells (Figure 3C).
Figure 3. Medalist fibroblasts display impaired wound healing in vivo.

(A) Macroscopic images of wound area surface not covered by an epithelial layer in wounds covered with Integra without human cells, Integra with control cells, or Integra with Medalist fibroblasts. (B) Percentage of open wound areas on days 9 and 15 of the initial wound area. (C) H&E-stained sections of open wound area and granulation tissues on day 15 after initial wounding. D, dermis; E, epidermis. Scale bar: 50 μm. (D) Representative immunoblots of VEGF protein levels and quantification (right panel) in the granulation tissues on day 15 after wounding. Data represent the mean ± SD. n = 12 for wounds treated with Integra without cells; n = 7 for wounds treated with control fibroblasts; and n = 12 for wounds treated with Medalist fibroblasts. The criteria for selecting the cell lines for these experiments were completely random, and the clinical and demographic characteristics of the selected subjects did not differ from those of the rest of the patients. A Student’s t or χ2 test was used for 2-way comparisons based on the distribution and number of observations of the variable.
Protein and mRNA levels of VEGF were 56% (P < 0.05) and 65% (P < 0.01) lower on day 15 after wounding in granulation tissues transplanted with Medalist fibroblasts than in tissues transplanted with control fibroblasts (Figure 3D and Figure 4A). These results were supported by IHC data showing reduced VEGF and PDGF-BB expression levels in the granulation tissues transplanted with Medalist fibroblasts compared with that seen in tissues transplanted with control fibroblasts (Supplemental Figure 6). When assessed according to CD31+ cells, the extent of neovascularization in granulation tissues was 3-fold greater (P < 0.01) in wounds with control fibroblasts versus those with Medalist fibroblasts (Figure 4, B and C).
Figure 4. Medalist fibroblasts display impaired wound healing in vivo.

VEGF mRNA levels (A) in granulation tissues on day 15 after wounding. The extent of neovascularization in granulation tissues on day 15 after wounding was assessed by CD31+ cells using IHC or IF (B) and quantification (C). Data represent the mean ± SD. n = 12 for wounds treated with Integra without cells; n = 7 for wounds treated with control fibroblasts; and n = 12 for wounds treated with Medalist fibroblasts. The criteria for selecting the cell lines for these experiments were completely random, and the clinical and demographic characteristics of the selected subjects did not differ from those of the rest of the patients. A Student’s t or χ2 test was used for 2-way comparisons based on the distribution and number of observations of the variable. Scale bars: 50 μm. HPF, high-powered field.
Assessing insulin signaling in control and Medalist fibroblasts.
Since fibroblasts from Medalists exhibited abnormal VEGF expression and migration in response to insulin stimulation, insulin signaling was characterized to identify the specific step of abnormality in the signaling pathway. Basal phosphorylated AKT (p-AKT) (Ser473) and p-ERK (Thr202/Tyr204) expression levels were 30% (nonsignificant) and 42% (P < 0.05) higher, respectively, in fibroblasts from Medalists than in those from controls (Figure 5, A–D). Insulin-stimulated p-AKT increased by 3.6-fold in control fibroblasts (P < 0.01) and by 2-fold (60% net, P < 0.05) in Medalist fibroblasts compared with the levels detected in untreated cells (Figure 5, A–D). Conversely, PDGF-BB increased p-AKT by 7-fold in both control and Medalist fibroblasts (Figure 5, A and B). Insulin and PDGF-BB stimulation of p-ERK was similar in both groups (Figure 5, C and D).
Figure 5. Insulin signaling in control and Medalist fibroblasts.

Representative immunoblot of p-AKT on Ser473 (A), p-AKT quantification (B), p-ERK immunoblot (C), and p-ERK quantification (D) in control (C) or Medalist (M) fibroblasts in a basal state, after stimulation with 100 nM insulin, or after stimulation with 10 ng/ml BDGF-BB for 10 minutes. (E) Phosphorylation of IRβ (Tyr1135 and Tyr1136) (upper), IRS1 (Tyr911 and Tyr649) (middle), and AKT (Ser473) (lower) in the basal state and after stimulation with 100 nM insulin for 10 minutes in fibroblasts derived from controls or Medalists with or without CVD. Immunoblot quantification for IRβ (F), IRS1 (G), and AKT (H). Data represent the mean ± SD. n = 7 for the control fibroblasts group; n = 18 for the Medalist fibroblasts group with CVD; and n = 8 for the Medalist fibroblasts group without CVD. The criteria for selecting the cell lines for these experiments were completely random, and the clinical and demographic characteristics of the selected subjects did not differ from those of the rest of the patients. A Student’s t or χ2 test was used for 2-way comparisons based on the distribution and number of observations of the variable.
Responses to insulin stimulation (100 nM) were compared in fibroblasts from Medalists with and without CVD. Insulin significantly increased p-AKT by 1.8-fold (P < 0.05) and 2.4-fold (P < 0.01) in fibroblasts from Medalists with and without CVD, respectively, which was lower than the 4.0-fold increase of p-AKT following insulin stimulation in the control fibroblasts (P < 0.01) (Figure 5E). Insulin-induced IRS1 activation of tyrosine phosphorylation at site 649 (p-Tyr649) was increased by 53% (P < 0.01), 34%, and 63% (P < 0.05), and at site 911 (p-Tyr911) by 52% (P < 0.05), 26%, and 40% (P < 0.05) in fibroblasts from controls, Medalists with CVD, and Medalists without CVD, respectively. These findings illustrate significantly lower activation in fibroblasts from Medalists with CVD than in those from Medalists without CVD (Figure 5, E–H). Surprisingly, insulin-stimulated levels of p-Tyr of the insulin receptor β (IRβ) subunit were all similarly increased (5.2-, 4.7-, and 4.9-fold in controls, Medalists with CVD, and Medalists without CVD, respectively; P < 0.01) (Figure 5, E and F).
Evaluation of PKC activation in fibroblasts and granulation tissues.
Activation of the PKC family has been reported to inhibit the insulin-signaling pathway and contribute to the development of diabetic complications (28). To evaluate the role of PKC activation in the reduction of insulin signaling and VEGF secretion, we assessed PKC isoform expression and activation in fibroblasts from control subjects and Medalists. We found that expression levels of PKCδ protein and mRNA were significantly increased in fibroblasts from Medalists compared with levels detected in fibroblasts from controls (3.8-fold [P = 0.01] and 2-fold [P = 0.03], respectively) (Figure 6, A–C), without significant changes in PKCα, β1, or β2 protein expression (Figure 6D). The increase in PKCδ protein expression was more prominent in Medalists with CVD than in Medalists without CVD (7-fold vs. 3-fold, P < 0.01) (Figure 6, E and F). Similar to our findings in postmortem fibroblasts, PKCδ protein and mRNA levels were increased by 3-fold and 70%, respectively, in fibroblasts derived from living T1D patients compared with levels in fibroblasts from living controls (Supplemental Table 2 and Supplemental Figure 7). Furthermore, PKCδ protein and mRNA levels were increased by 7-fold and 3-fold, respectively, in discarded tissues obtained from active diabetic foot ulcers compared with levels detected in control tissues (Supplemental Table 3 and Supplemental Figure 8).
Figure 6. Increased PKCδ expression and PKCD mRNA half-life in Medalist fibroblasts.

Representative immunoblot for PKCδ (A), PKCδ protein quantification (B), and PKCD mRNA (C) in control and Medalist fibroblasts. Data represent the mean ± SD. n = 7 for the control fibroblasts group; n = 26 for the Medalist fibroblasts group. (D) PKCα, PKCβ1, and PKCβ2 protein expression in control (n = 5) and Medalist (n = 10) fibroblasts. Representative immunoblot (E) and quantification (F) of PKCδ protein expression in control fibroblasts (n = 7), fibroblasts from Medalists without CVD (n = 8), and fibroblasts from Medalists with CVD (n = 18). (G) The half-life of PKCD mRNA was determined by incubation of fibroblasts from controls (n = 7) and Medalists (n = 10) with 5 μg/ml actinomycin-D for 0 to 8 hours, followed by qPCR analysis. A Student’s t or χ2 test was used for 2-way comparisons based on the distribution and number of observations of the variable.
To determine whether the increase in PKCD mRNA levels in Medalist fibroblasts is due to posttranscriptional regulation, we performed a PKCD mRNA stability assay. The half-life of PKCD in RNA was analyzed by incubating cells with or without actinomycin-D (5 μg/ml) for 0 to 8 hours, followed by quantitative PCR (qPCR) analysis. The half-life of PKCD mRNA in control fibroblasts was 4 hours compared with 8 hours in Medalist cells, indicating increased PKCD mRNA stability in the Medalist cells (P < 0.05, Figure 6G).
To confirm these observations regarding the elevation and activation of PKCδ isoforms in the wounds of diabetic models, we extracted granulation tissues from excision wounds obtained from streptozotocin-induced (STZ-induced) insulin-deficient diabetic mice. Two weeks after STZ injection, animals with fed blood glucose levels above 400 mg/dl were selected. Granulation tissue obtained 9 days after the initial wounding incision showed a 3.1-fold (P < 0.05) increase in PKCδ protein expression (Supplemental Figure 9, A and B) and a 3.8-fold (P < 0.01) increase in tyrosine phosphorylation of PKCδ after immunoprecipitation with anti-PKCδ Ab, a marker of PKCδ activation (ref. 29 and Supplemental Figure 9, C and D).
We recently identified serine phosphorylation sites at positions 303 and 675 on IRS2, which can be induced by PKC activation and inhibit insulin-induced p-Tyr sites on IRS2 (positions 653 and 911) and its downstream signals such as p-AKT (30). To further confirm the inhibitory effect of PKCδ overexpression on insulin signaling on p-Tyr649 and p-Tyr911 of IRS2 in the Medalist fibroblasts, we studied p-Ser sites of IRS2. We observed greater elevation of p-Ser675 in fibroblasts from Medalists with CVD, Medalists without CVD, and controls (Supplemental Figure 10).
Effect of PKCδ inhibition or knockdown on insulin-induced VEGF secretion.
Our data suggest increased PKCδ expression, and activation inhibited insulin signaling in Medalist fibroblasts, resulting in decreased VEGF secretion and delayed wound healing in vivo. Thus, we examined whether inhibition of several intracellular signaling pathways mediates insulin signaling. We examined how PI3 kinase (wortmannin), MAPK (PD98059), general PKC (GFX), PKCβ (RBX), and PKCδ (rottlerin) affect insulin’s induction of VEGF production in vitro (Supplemental Figure 11). Wortmannin, but not PD98059, significantly inhibited insulin-stimulated VEGF production in Medalist fibroblasts (P < 0.05, Supplemental Figure 11A). Furthermore, treatment with RBX, a selective PKCβ isoform inhibitor, failed to increase insulin-stimulated VEGF secretion (Supplemental Figure 11B). However, treatment with either GFX (Supplemental Figure 11C) or 3 μM rottlerin (Supplemental Figure 11D) increased insulin-stimulated VEGF secretion in Medalist fibroblasts (insulin vs. GFX vs. GFX plus insulin: 1.59- ± 0.10-fold vs. 2.55- ± 0.43-fold vs. 4.74- ± 0.94-fold increases in VEGF above basal levels, P < 0.01; and insulin vs. rottlerin vs. rottlerin plus insulin, 1.50- ± 0.31-fold vs. 3.74- ± 0.49-fold vs. 5.25- ± 0.56-fold increases in VEGF above basal levels, P < 0.01) (Supplemental Figure 11, C and D).
To specifically confirm that increased PKCδ expression in Medalist fibroblasts decreases insulin-stimulated VEGF secretion and delays wound healing in vivo, we knocked down PKCδ expression in fibroblasts from Medalists using siRNA or adenoviral vector infection with dominant-negative PKCδ (Ad-dnPKCδ) (Figure 7A). Inhibition of PKCδ in Medalist fibroblasts with Ad-dnPKCδ resulted in increased insulin-stimulated p-AKT (Figure 7, B and C) and insulin-stimulated VEGF secretion (1.51- ± 0.18-fold vs. 1.00- ± 0.05-fold increases in Ad-GFP with and without insulin, P < 0.05; and 2.79- ± 0.30-fold vs. 1.92- ± 0.28-fold increases in Ad-dnPKCδ with and without insulin, P < 0.05) (Figure 7D). Similarly, siRNA PKCδ knockdown in the Medalist fibroblasts increased insulin-stimulated VEGF secretion (siRNA and siRNA with insulin, 1.28- ± 0.10-fold vs. 1.16- ± 0.10-fold and 1.85- ± 0.21-fold increases above basal levels with insulin, respectively, P < 0.05) (Figure 7, E and F). However, increasing PKCδ expression in control fibroblasts by infection with Ad-wtPKCδ decreased insulin-stimulated p-AKT levels (Figure 7H) and inhibited insulin-stimulated VEGF production compared with control Ad-GFP–infected cells (without insulin, 1.00- ± 0.05-fold vs. with insulin, 2.89- ± 0.67-fold, P < 0.01; Ad-wtPKCδ without insulin, 1.22- ± 0.25-fold vs. with insulin, 1.71- ± 0.40-fold, P = NS) (Figure 7, G–I).
Figure 7. Knockdown of PKCδ improves insulin-induced VEGF secretion.

(A) Fluorescence micrographic images of adenoviral vector containing GFP (Ad-GFP) and dominant-negative PKCδ–infected (Ad-dnPKCδ) Medalist fibroblasts. Representative immunoblot of PKCδ (B), p-AKT after stimulation with insulin for 10 minutes (C), and VEGF protein levels after stimulation with 100 nM insulin for 16 hours (D) in Medalist fibroblasts infected with Ad-GFP or Ad-dnPKCδ. Representative immunoblot of PKCδ (E) and VEGF protein levels (F) in Medalist fibroblasts transfected with siRNA and stimulated with 100 nM insulin for 16 hours. Representative immunoblot of PKCδ (G), p-AKT after stimulation with 100 nM insulin for 10 minutes (H), and VEGF protein levels (I) after stimulation with 100 nM insulin for 16 hours in control fibroblasts infected with Ad-GFP or Ad-wtPKCδ. Data represent the mean ± SD. n = 10 in Medalist experiments and n = 7 in the control experiments. The criteria for selecting the cell lines for these experiments were completely random, and the clinical and demographic characteristics of the selected subjects did not differ from those of the rest of the patients. A Student’s t or χ2 test was used for 2-way comparisons based on the distribution and number of observations of the variable.
In vivo knockdown of PKCδ in diabetic fibroblasts improves wound healing, while increasing PKCδ expression in control fibroblasts delays wound healing.
Control fibroblasts infected with Ad-wtPKCδ that were transplanted into control nude mice triggered a significant delay in wound closure (61.1% ± 3.3% vs. 80.5% ± 7.6% of the initial wound area in Ad-wtPKCδ- vs. Ad-GFP–infected cells, P = 0.05) (Figure 8, A, B, and G) and a decrease in VEGF mRNA expression (Figure 8H). Furthermore, transplantation of fibroblasts from Medalists without CVD into control nude mice after knockdown of PKCδ significantly improved wound healing (Ad-dnPKCδ- vs. Ad-GFP–infected cells, 62.8% ± 2.7% vs. 77.4% ± 4.9% of the initial wound area [P = 0.03] compared with 70.4% ± 3.5% vs. 78.0% ± 5.6% in fibroblasts from Medalists with CVD) (Figure 8, C–G) and increased VEGF mRNA expression (Figure 8H). The rescue experiments with knockdown of PKCδ in the Medalist fibroblasts resulted in more neovascularization than was observed in the untreated Medalist cells, as demonstrated by 2-fold increases in CD31+ cells in granulation tissues from nondiabetic mice (Supplemental Figure 12).
Figure 8. Knockdown of PKCδ in Medalist fibroblasts improves wound healing, while increasing PKCδ expression in control fibroblasts delays wound healing after transplantation into a nondiabetic host.

Macroscopic images of wound area surfaces not covered by an epithelial layer (A) and H&E-stained sections of open wound area and granulation tissues (B) on day 9 after initial wounding in control cells infected with Ad-GFP or Ad-wtPKCδ. Macroscopic wound area surfaces not covered by an epithelial layer (C) and H&E-stained sections of open wound area and granulation tissues (D) on day 9 after initial wounding in fibroblasts derived from Medalists without CVD and infected with Ad-GFP or Ad-dnPKCδ. Macroscopic wound area surfaces not covered by an epithelial layer (E) and H&E-stained sections of open wound area and granulation tissues (F) on day 9 after initial wounding in fibroblasts derived from Medalists with CVD and infected with Ad-GFP or Ad-dnPKCδ. Percentage of open wound areas (G) and VEGF mRNA in granulation tissues (H) on day 9 after wounding for the different treatment groups. Data represent the mean ± SD. n = 7 for the control fibroblast group; n = 8 for fibroblasts from Medalists with CVD; and n = 8 for fibroblasts from Medalists without CVD. The criteria for selecting the cell lines for these experiments were completely random, and the clinical and demographic characteristics of the selected subjects did not differ from those of the rest of the patients. A Student’s t or χ2 test was used for 2-way comparisons based on the distribution and number of observations of the variable. Scale bars: 50 μm.
Additionally, to evaluate the effect of the diabetic milieu on wound healing in vivo, we repeated the procedures using STZ-induced diabetic nude mice, which yielded an insulin-deficient model (Figure 9). Ad-GFP–infected control fibroblasts transplanted into diabetic mice resulted in a 60.0% and 79.6% closure of the initial wound area after 9 and 15 days, respectively (Figure 9, A–C). However, transplantation of Ad-dnPKCδ–infected Medalist fibroblasts into nude mice resulted in 78.4% and 92.3% closure of the initial wound area after 9 and 15 days, respectively (Figure 9, A–C). Transplants of these fibroblasts also normalized VEGF mRNA in wound granulation tissue (Figure 9D). However, transplants of Ad-GFP–infected Medalist fibroblasts failed to improve wound closure (35% or 45% of the initial wound area after 9 and 15 days, respectively) (Figure 9, A–C) or VEGF expression in wound granulation tissues (Figure 9D). Knockdown of PKCδ expression in the Medalist fibroblasts resulted in more neovascularization than was seen in the untreated Medalists cells, as demonstrated by almost 2-fold increases in CD31+ cells in granulation tissues, even in the STZ-induced diabetic mice (Supplemental Figure 13). The cells shown in the open wound area in Figure 8B and Figure 9B were exudate and inflammatory cells that were part of the granulation tissue. A high-magnification image of the open wound area is shown in Supplemental Figure 14.
Figure 9. Knockdown of PKCδ in Medalist fibroblasts improves wound healing when transplanted into a diabetic host.

Macroscopic wound area surfaces not covered by an epithelial layer (A) and H&E-stained sections for open wound area and granulation tissues on day 9 after initial wounding (B) in control fibroblasts infected with Ad-GFP or Medalist fibroblasts infected with Ad-GFP or Ad-dnPKCδ. Percentage of the open wound areas (C) and VEGF mRNA in granulation tissues (D) on day 9 after wounding in the different treatment groups. Data represent the mean ± SD. n = 7 for the control fibroblast group; n = 8 for the Medalist group. The criteria for selecting the cell lines for these experiments were completely random, and the clinical and demographic characteristics of the selected subjects did not differ from those of the rest of the patients. A Student’s t or χ2 test was used for 2-way comparisons based on the distribution and number of observations of the variable. Scale bars: 50 μm.
A comprehensive understanding of the mechanism for the persistent upregulation of PKCδ mRNA and protein levels in the Medalist fibroblasts presented in Figure 6 has yet to be achieved. To identify whether miRs might be involved in PKCδ expression in the Medalists, we assessed which miRs might be predicted to bind to the 3′-UTR of PKCD mRNA and were expressed differentially between Medalists and controls (Supplemental Table 4). qPCR was performed to analyze expression of the predicted miRs in the Medalist fibroblasts compared with miR expression in control fibroblasts. Interestingly, the predicted PKCD miR regulators miR-15a, -15b, -16, -195, -424, and -497 were significantly decreased in Medalist fibroblasts compared with levels detected in control fibroblasts (Supplemental Figure 15). In contrast, control miR-1227 and miR-200a expression levels in fibroblasts were not different between Medalists and controls.
Discussion
Transplantation of autogenic and allogenic fibroblasts is the mainstay treatment for chronic, nonhealing wounds. This is due to the multiple key roles of fibroblasts in wound healing, such as the production of growth factors and ECM protein as well as the promotion of angiogenesis (4, 31–34). However, in diabetic states, there is evidence that autogenic and allogenic transplants involving fibroblasts are less efficacious than in nondiabetic states (17). In the present study, we characterized the abnormalities in fibroblasts from a cohort of T1D patients with well-characterized complications. In addition, we identified mechanisms that may cause aberrations in fibroblast activity in wound healing. We present a potential therapy for correcting changes in insulin signaling that cause delays in wound healing in individuals with diabetes.
Fibroblasts were derived from individuals who had diabetes for over 50 years (Joslin Medalist Study, ref. 25). This enabled subgrouping of individuals according to protection from microvascular and cardiovascular complications after the plateau of microvascular diabetic complication incidence at approximately 30 years (25, 26). This is of great advantage, since many of the neuropathic and vascular complications of diabetes are thought to confer independent risks in wound healing (35, 36). Thus, this unique cohort with an extreme duration of disease and well-characterized micro- and macrovascular complications of diabetes enables analysis of the distinct contribution of each complication to fibroblast function and wound-healing efficiency. Our experiments confirmed previous studies showing that fibroblasts derived from individuals with diabetes migrate less in response to various growth factors including PDGF and insulin (37–39). Interestingly, fibroblasts from Medalists did not exhibit resistance to PDGF-BB (Figure 5B), indicating that the inhibition of insulin actions by PKCδ was limited to selective signaling pathways. In addition, the ability of Medalist fibroblasts to express VEGF in response to insulin and hypoxia was decreased, confirming previous reports (37). Pulmonary analysis suggested that abnormalities in the fibroblasts from Medalists showed some correlation with a history of CVD and amputation, however, more detailed studies will be needed. Abnormalities correlated with the presence of neuropathy, but not with other microvascular complications such as nephropathy or retinopathy. These findings suggest that wound healing may be induced by mechanisms similar to those that accelerate CVD in diabetic individuals. These in vitro abnormalities in diabetic fibroblasts were confirmed in vivo; fibroblasts from Medalists showed impaired function in wound healing in nondiabetic mice relative to to that seen in fibroblasts from controls, as demonstrated by decreases in VEGF expression and angiogenesis.
Abnormalities in wound healing in fibroblasts derived from Medalists were related to decreased VEGF expression, especially in response to insulin and hypoxia. These findings suggest that the mechanisms for wound-healing abnormalities associated with TID could be related to loss of insulin actions in fibroblasts. Metabolic changes such as hyperglycemia can inhibit insulin actions in several tissues in T1D and T2D patients (40). This supportive evidence in fibroblasts from other studies demonstrated selective inhibition of insulin action in the IRS/PI3K/AKT cascade, without loss of activation of MAPK (41). Thus, insulin’s actions in the same cells can be preserved or inhibited selectively. Selective insulin resistance has been observed in many cardiovascular tissues including the myocardium (42), and in large arteries (42), endothelium (43), renal glomeruli, and other nonvascular tissues such as the liver (44). The current study also demonstrated that selective insulin resistance appears to increase serine phosphorylation of IRS1/2. These are the same phosphorylation sites that we previously reported to be inhibitors of IRS1/2 tyrosine phosphorylation and that interact with p85 of the PI3K pathway after insulin stimulation (30). Insulin-stimulated tyrosine phosphorylation of the insulin receptor was similar between controls and Medalists, suggesting that selective insulin resistance is downstream of the receptors in the Medalist fibroblasts, as reported in vascular tissues (30, 45). Our results demonstrate that PKCδ targets p-AKT and IRS1, thus inducing insulin resistance in the Medalist fibroblasts. Other signaling pathways regulated by p-AKT could also be involved, such as the transcription factor FOXO1, which has recently been found to be an important regulator of wound healing. In particular, FoxO1 has significant effects through the regulation of TGF-β expression and the protection of keratinocytes from oxidative stress. In the absence of FoxO1, there is increased oxidative damage, reduced TGF-β1 expression, reduced migration and proliferation of keratinocytes, and increased keratinocyte apoptosis, leading to impaired reepithelialization of wounds (46). We previously reported that hyperglycemia and angiotensin II (AngII), and possibly other causative factors such as oxidants and inflammatory cytokines, may play an important role in inducing selective insulin resistance and reducing the expression of VEGF and other cytokines (47). The current findings suggest that selective insulin resistance in T1D is an important mechanism that causes abnormality of fibroblast action in wound healing. This substantially extends the findings of previous reports that demonstrated the effect of loss of insulin action on the impairment of wound healing in diabetes. Goren et al. demonstrated that the expression of insulin-signaling molecules is decreased in the chronic wounds of diabetic ob/ob mice (48). This contrasts with our finding that the inhibition of insulin signaling is due to selective inhibition of signaling at the IRS1/PI3K step. Lima et al. also reported that downregulation of the IRS/PI3K/AKT pathway is important for wound healing (49). The finding that TGF-β action is inhibited by PKCδ activation suggests that other signaling pathways besides those involved with insulin could also be inhibited. Additional studies on the pathways involved in TGF-β signaling are now in progress.
According to the current study, impaired insulin signaling appears to be due to an increase in serine phosphorylation of the IRS proteins, which inhibits insulin-promoted tyrosine phosphorylation and actions on the PI3K/AKT pathway. As we have previously reported, the mechanism of the specific inhibition appears to be related to PKC activation (50). Here, the specific PKC isoform involved appears to be PKCδ rather than α or β, as we observed in endothelial cells (30, 47). Multiple factors have been shown to activate PKC in diabetes including hyperglycemia, elevation of free fatty acids, advanced glycation end products, oxidants, inflammation, and cytokines such as AngII (28, 51). However, the present finding is unusual in that it demonstrates persistently increased expression of the PKCδ isoform in fibroblasts derived from biopsies obtained from living T1D patients and in fibroblasts from active wounds of living T1D patients, even after culturing the fibroblasts for more than 5 passages in vitro, confirming the general applicability of this finding. We identified a prolonged mRNA half-life as the mechanism underlying the increase in PKCδ expression and as the stimulator of increased protein expression and activation. This contrasts with previous reports of other PKC isoforms in diabetes that are activated by elevations in diacylglycerol (DAG) levels, resulting in activation rather than expression (28, 51). However, the primary molecular mechanism for the persistently increased PKCδ half-life is still unclear. Prolonged exposure to glucose, such as chronic hyperglycemia in the Medalists, may result in transcriptional deregulation and changes in mRNA stability (52) and contributes to the control of mRNA turnover. The predicted PKCD miR regulators miR-15a, -15b, -16, -195, -424, and -497 were significantly decreased in the Medalists compared with that seen in the controls. No differences in miR-200a or miR-1227 levels were detected in Medalist fibroblasts compared with levels detected in control fibroblasts. These findings revealed potential mechanisms that could partially explain the increased protein levels detected in Medalist fibroblasts compared with those in control fibroblasts. Future detailed studies are required to confirm which specific miRs can regulate PKCD mRNA expression in fibroblasts and in vivo in models of wound healing.
The finding that PKC activation plays an important role in the pathogenesis of impaired wound healing in diabetes is demonstrated by a series of studies that used either deletion or increased expression of PKCδ, both in vitro and in vivo. Inhibition of PKCδ, by knockdown or by small-molecule inhibitors, improved the fibroblast response to insulin and restored VEGF expression. On the other hand, increased PKCδ expression in normal fibroblasts appeared to mimic the abnormalities seen in fibroblasts derived from diabetic patients. The findings in vivo are very exciting, since they show that normal fibroblasts, exogenously treated with PKCδ overexpression, inhibit wound healing. In contrast, diabetic patient–derived fibroblasts exogenously treated with PKCδ inhibitors or with knockdown improved wound healing. Further, the changes in PKCδ also correlated with the severity of abnormality in wound healing.
Inhibition or deletion of PKCδ ex vivo not only improved fibroblast function and wound healing in animals without diabetes, but also markedly improved the function of fibroblasts derived from diabetic patients, even when transplanted into a rodent model of diabetes induced by severe insulin deficiency. We believe that this finding may be novel, because it shows that exogenous modification of fibroblasts derived from diabetic patients can improve granulation tissue formation, angiogenesis, and wound healing. These findings suggest that activation of PKCδ is one means by which hyperglycemia and diabetes cause selective insulin resistance and inhibit fibroblast actions for the stimulation of angiogenesis and granulation tissue formation. Therefore, exogenous treatment of PKCδ inhibition could be therapeutically effective in a diabetic state, despite the presence of hyperglycemia and other abnormalities such as oxidative stress and insulin resistance (53).
The capability of normalizing fibroblasts from diabetic hosts presents the exciting possibility that autogenic transplants of fibroblasts are a feasible and viable therapeutic method. Our experiments focused on the role of selective insulin resistance and assumed its normalization to be important in wound healing. However, our findings also suggest that the abnormalities of the response of fibroblasts to hypoxia could be a contributing factor. Previous studies identified activation of hypoxia-inducible factor 1α and its inhibition by p300 as an important pathway that is abnormal in fibroblasts from diabetic patients, the normalization of which could improve wound healing (54, 55). Thus, it is likely that abnormalities in wound healing, especially in fibroblasts, are caused by several important pathways that may be related to such phenomena as hyperglycemia, insulin resistance, and oxidative stress. However, we identified a molecular mechanism, namely the persistent manner of activation of PKCδ in the fibroblasts of diabetic patients, that leads to the selective inhibition of insulin action on the IRS/PI3K/AKT pathway. Persistent selective insulin resistance in fibroblasts leads to abnormal fibroblast functions, including expression of VEGF and migration of fibroblasts. This impairs the wound healing that may result from abnormal fibroblasts or be induced by diabetes itself. However, the finding that all these aberrations can be normalized with exogenous PKCδ isoform inhibition in a diabetic in vivo model identifies a new therapeutic modality for treating patients with diabetes using autologous transplants of modified fibroblasts.
Methods
Abs and other reagents
The following Abs purchased from Santa Cruz Biotechnology Inc. were used for Western immunoblotting: anti–β-actin (catalog sc-1616); anti-PKCα (H-7) (catalog sc-8393); anti-PKCβ1 (C-16) (catalog sc-209); anti-PKCβ2 (C-18) (catalog sc-210); anti-fibronectin (A-11) (catalog sc-271098); anti–TGF-β (3C11) (catalog sc-130348); anti-VEGF (A-20) (catalog sc-152); anti–p-IRS1 (Tyr632) (catalog sc-17196); anti-IRβ (catalog sc-711); anti-goat anti-mouse (catalog sc-2031); and anti-rabbit IgG (catalog sc-2004). Anti-PKCδ (2058s), anti–p-IRβ (3025s), anti-IRS1 (2390s), and anti-rabbit polyclonal Abs against phosphorylated and total AKT and ERK were obtained from Cell Signaling Technology. Abs against IRS1 pTyr911 and pTyr649 were purchased from Sigma-Aldrich. Anti-vimentin/LN6 was obtained from Calbiochem. Anti-mouse CD-31 (DIA-310) was obtained from Dianova GmbH. Anti–MHC class 1 (NB110-57201) was purchased from Novus. Anti–PDGF-BB was purchased from Abcam.
Ruboxistaurin (RBX) was purchased from EMD Millipore. 2[1-(3-dimethylaminopropyl)-1H-indol-3-yl]-3-(1H-indol-3-yl)-maleimide (GFX) was obtained from Calbiochem. Rottlerin, PD098059, and wortmannin were obtained from Sigma-Aldrich. Lipofectamine 2000 for plasmid infections was purchased from Invitrogen (Life Technologies). DMEM was provided by the Joslin Media Core.
FBS, PBS, and penicillin-streptomycin were obtained from Invitrogen (Life Technologies). All other reagents used, including BSA, 2,4,6-trinitrobenzenesulfonic acid, EDTA, heparin, leupeptin, PMSF, aprotinin, leupeptin, PDGF-BB, D-glucose, D-mannitol, and Na3VO4 were purchased from Sigma-Aldrich, unless otherwise stated.
Studies of the Medalist patients
Details of the Medalist Study have been described extensively elsewhere (25–27). Individuals with T1D who had 50 or more years of documented insulin use were invited for a baseline visit.
Assessment of complication status
Nephropathy, retinopathy, and neuropathy status was defined previously (25, 26). Briefly, DN was defined by an estimated chronic kidney disease GFR (CKD-eGFR) of less than 45 ml/min/1.73 m2. A dilated eye examination was performed, and retinopathy status was graded using guidelines from the Early Treatment Diabetic Retinopathy Study (ETDRS). PDR was defined as an ETDRS score of 60 or higher (52). The Michigan Neuropathy Screening Instrument was used to assess neuropathy; scores higher than 2 were considered positive (56). CVD status was based on the participant’s self-reported history of CAD, angina, heart attack, prior cardiac or leg angioplasty, or bypass graft surgery. CAD was defined by the participant’s self-reported history of CAD, angina, heart attack, or cardiac angioplasty or bypass graft surgery. PVD was defined by a self-reported history of PVD, leg angioplasty, or leg bypass graft surgery (Supplemental Table 1).
Postmortem samples
At the time of clinical characterization, individuals were asked to donate their organs after death. Consent was obtained for the donation of skin, kidneys, ocular globes, left ventricle, aorta, bone, and pancreas. At the time of imminent death, members of the study staff were notified of the participant’s condition via a 24-hour phone line. The coordinating center was then notified, and the organ procurement organization (The National Disease Research Interchange [NDRI]) was called. A skin sample measuring 2.0 cm2 to 5.0 cm2 from the abdomen or forearm was placed in DMEM plus antibiotics and shipped on wet ice.
Human primary fibroblast derivation and culture
Skin samples were obtained from 26 Medalists with various complications and from 7 age-matched nondiabetic controls during the postmortem period. Primary fibroblast cultures were derived from human abdominal skin samples, sustained in DMEM (10-027; Cellgro Inc.) supplemented with 10% heat-inactivated FBS, over a period of 4 weeks in a 6-well plate, with media supplementation every other day. Subsequently, as fibroblasts emerged from the primary explant, a brief trypsinization (0.25% trypsin) was used to separate and further expand the cells in a 10-cm2 plate. In all experiments, fibroblasts were used between passages 2 and 5.
In another set of experiments, fibroblasts were derived from biopsies obtained from 4 living T1D patients and 4 age- and gender-matched control nondiabetic subjects.
Human samples from active foot ulcers
Deidentified discarded skin specimens were collected from 50- to 65 -year-old subjects who underwent elective foot surgery at the Foot Center and Vascular Surgery clinic at the Joslin/Beth Israel Deaconess Medical Center. Subjects were divided into 2 groups: (a) control group (nondiabetic subjects who had elective surgeries for hammertoes, bunions, and other foot surgeries); (b) diabetic foot ulcer group (diabetic patients with an active foot ulcer). The subjects were matched for age and sex. Skin specimens were collected in the operating room at the time of the surgery. Only specimens that were determined by the operating surgeon to be discarded specimens for evaluation were collected and used for this study.
Wound model in mice
For in vivo wound-healing experiments, we used 8-week-old male nude mice (nu/nu, 002019) obtained from The Jackson Laboratory. On the day of the surgery (day 0), mice were anesthetized, and the dorsal skin was marked using a standardized 1.0-cm2 template. A full-thickness wound on the dorsal area was created by excising a 1-cm2 section of skin (consisting of the epidermis, dermis, and underlying panniculus carnosus).
For the transfer of human fibroblast cells into the animal wound, we used the Integra Dermal Regeneration Template, which is a bilayer matrix wound-dressing system (donated by Integra LifeSciences Corporation). This system consists of a collagen-GAG scaffold prepared by a freeze-drying process, with an attached silicone pseudoepidermal layer for wound-repair purposes. The scaffold features an interconnected macroporous structure with a pore-size distribution of 131 ± 17 μm on one surface, decreasing to 30 ± 8 μm on the attached silicone surface (57).
Fibroblasts (105 cells) originating from Medalists or control subjects were plated on a 1.0-cm2 piece of Integra in 6-well plates 1 day before the surgery. After 16 to 20 hours, the fibroblast-seeded Integra membranes were transplanted onto the animal wound. The Integra membrane was sutured onto the wound, ensuring that its porous bottom surface was in contact with the wound bed. Once dry, the wound area was covered with a semiocclusive, transparent polyurethane dressing (Tegaderm; 3M). Three days after surgery, the silicone outer layer of the Integra membrane was removed. Every 3 days, the Tegaderm was replaced. The experimental groups included: (a) wound without Integra (n = 12); (b) wound with Integra without cells (n = 12); (c) wound with Integra with control cells (n = 7); and (d) wound with Integra with Medalist cells (12). On days 0, 3, 6, 9, 12, and 15 after surgery, reepithelialization of the wound was monitored macroscopically (assessed on the basis of the absence of redness and fluid exudate), and the wound’s open area was digitally photographed. On days 9 and 15 after surgery, wounds from 6 animals in each group were harvested as previously described (58).
In another series of experiments, fibroblasts from controls were infected with either adenoviral vectors containing GFP (Ad-GFP) or with WT PKCδ isoforms (Ad-wtPKCδ). Medalist fibroblasts were infected with either Ad-GFP or with dominant-negative PKCδ isoforms (Ad-dnPKCδ), which inhibit the action of individual PKC isozymes by the expression of kinase-dead mutants (59).
The experimental groups included: (a) control fibroblasts infected with Ad-GFP or (b) with Ad-wtPKCδ; (c) fibroblasts from Medalists without CVD infected with Ad-GFP or (d) with Ad-dnPKCδ; and (e) fibroblasts from Medalists with CVD infected with Ad-GFP or (f) with Ad-dnPKCδ. Twenty-four to forty-eight hours after the infection, equal numbers of cells were plated on Integra membranes and transplanted onto the nude mice as described earlier. To detect the effect of diabetes on wound healing in vivo in mice, diabetes was induced in 8-week-old nude mice by STZ as described previously (60). Two weeks after STZ injection, animals with glucose levels above 400 mg/dl were used. On day 0, a wound was made as described earlier. On day 9, animals were sacrificed, and granulation tissue was collected from each specimen and frozen in –80°C until use for protein and mRNA analysis (60).
Tissue morphometric analysis.
To assess the macroscopic wound area, digital macroscopic images were analyzed using ImageJ software, version 1.40g (NIH). Standardized photographs were taken on the day of wounding and every 3 days during the follow-up period. Reepithelialization and open-wound raw surface area were measured as a percentage of the initial wound area, as published previously (61).
Histological processing.
Excised tissues were fixed and stored at 4°C until final processing. Wound tissues were stained using the H&E-staining protocol. The histological images were photographed with an Olympus FSX100 microscope and analyzed using cellSens Dimension analysis software (Olympus America). Images were taken in the center of each histological section at ×4, ×10, and ×40 magnifications.
Immunoblot analyses
Fibroblasts that underwent 5 or fewer passages were grown and expanded in 10-cm plates with DMEM supplemented with 10% FBS. Cells were stimulated under the indicated conditions and with the compounds indicated in Figures 1, 2, 5, 6, and 7 after overnight starvation in DMEM with 0.1% BSA without FBS. Cells were lysed, and protein amounts were measured with a BCA Protein Assay Kit (Bio-Rad). Protein lysates (20–30 μg) were separated by SDS-PAGE, transferred, blocked, and detected as previously described (30). Signal intensity was quantified using ImageJ software. For immune precipitation, tissue lysates were incubated with the appropriate Abs, followed by the addition of protein A/G sepharose beads (Santa Cruz Biotechnology Inc.). The precipitated proteins were subjected to SDS-PAGE, followed by immunoblotting with the appropriate Abs as described before (30).
qPCR analysis
qPCR was performed to evaluate mRNA expression of VEGF, PDGFBB, fibronectin, and PKCD in cultured fibroblasts and murine granulation tissue, as we described previously (59). PCR primers and probes are detailed in Supplemental Table 5. Human 36B4 or 18S ribosomal RNA expression was used for normalization.
mRNA half-life studies.
Cells were treated with 5 mg/ml actinomycin-D for the indicated times in Figure 6. Total RNA isolation, cDNA synthesis, and qPCR amplification were performed at 0, 0.5, 1, 2, 4, and 8 hours. PKCD mRNA levels at each time point were calculated relative to untreated fibroblast cells and plotted on a semi-log scale. Exponential curve fitting was used to calculate the half-life from the slope of the curve using the formula t1/2 = (–0.693/K).
Adenoviral vector infection
Adenoviral vectors containing GFP (Ad-GFP) and dominant-negative or WT PKCδ isoforms (Ad-dnPKCδ or Ad-wtPKCδ) were constructed and used to infect fibroblasts as described previously (59). Infectivity of these adenoviruses was evaluated by the percentage of green light–emitting cells under a Nikon fluorescence microscope. The presence of approximately 80% Ad-GFP–positive cells was considered a successful infection, and these cells were used for further experimentation. Moreover, expression of each recombinant protein was confirmed by Western blot analysis, and expression was increased approximately 4- to 8-fold with all constructs as compared with cells infected with control adenovirus.
siRNA transfection
siRNA transfection was performed using the Ambion Silencer Select Validated siRNA kit for primary cells (Life Technologies) in 60% to 70% confluent fibroblasts. To evaluate the effect of insulin on VEGF production, cells were washed twice with PBS and starved overnight with DMEM containing 1% BSA. Insulin (100 nM) was added to each culture for an additional 16 hours. After incubation, media were collected for VEGF measurement by ELISA, and the cell lysate was collected for the measurement of protein concentration.
Histological and immunohistochemical analyses
Paraffin-embedded sections were subjected to IF staining using standard methods (61). Sections were incubated with Abs (anti-CD31, 1:20; anti-vimentin, 5 μg/ml; anti-MHC class 1, 1:250; anti-VEGF, 1:100; or anti-PDGF BB, 1:200) or negative controls (0.1% BSA in 1X PBS), followed by incubation with a fluorescent secondary Ab and staining of the nuclei with DAPI, as we described previously (61). Images were taken using an Olympus FSX100 microscope.
Cell migration assay
Scratch wound migration assay.
One hundred percent confluent starved Medalist or control fibroblasts were wounded by scratching the cell monolayer in a straight line to create a scratch using a p200 pipette tip, followed by incubation with 10 ng/ml PDGF-BB or 100 nM insulin for 12 hours as described previously (62). Phase-contrast images of wounded areas were taken 0, 4, 6, 8, and 12 hours after stimulation, and cell migration was determined as described previously (62).
Migration in Matrigel invasion chamber.
Fibroblasts were seeded at a density of 3 × 10⁴ cells per well into the upper chambers of Transwell inserts (BD Biosciences). The lower chambers were filled with medium containing 0.1% BSA with 10 ng/ml PDGF-BB. After a 24-hour incubation, the number of migrated cells was counted in 10 random fields under a microscope at ×40 magnification as described previously (63).
Cell proliferation assay
A BrdU ELISA kit (Abcam) was used according to the manufacturer’s protocol for the quantification of cell proliferation based on the measurement of BrdU incorporation (64).
miR
Total RNA was isolated from primary human fibroblast cells using the TRIzol method (Life Technologies) and quantified by NanoDrop 1000 spectrophotometry (Thermo Scientific). Total RNA (800 ng) was reverse transcribed using the miRNome MicroRNA Profiler kit following the manufacturer’s protocol (System Biosciences). qPCR was carried out in a Bio-Rad CFX384 Real-Time PCR Detection System. The noncoding RNA U6 was used for normalization of the miR qPCR results.
Other methods
Protein levels of VEGF in the medium were measured using an R&D Systems Quantikine kit, which determines mainly VEGF165. HbA1c was determined by HPLC (Tosoh G7 and 2.2). Serum creatinine was determined by spectrophotometry. Urine albumin and creatinine were determined by turbidimetric methods. Serum C-peptide was determined by RIA (Beckman Coulter).
Statistics
Univariate analyses were performed to determine distribution, and the descriptive statistics are presented as appropriate to the distribution of the variable using the median (interquartile range [IQR]), mean ± SD, or mean ± SEM and the percentage (n). A 2-way, 2-tailed t or χ2 test was used for comparisons based on the distribution and number of observations. A P value of 0.05 or less was considered statistically significant. Stata/SE software (StataCorp) was used to perform all analyses.
Study approval
Informed consent was obtained from all subjects prior to their participation in the study, and the study protocol was reviewed and approved by the Joslin Diabetes Center’s Committee on Human Studies. All procedures were approved by the IRB of the Beth Israel Deaconess Medical Center. All animal experiments were approved by the IACUC of the Joslin Diabetes Center.
Author contributions
MK performed a majority of the experiments and wrote the first draft of the manuscript. SK conducted the in vivo wound-healing studies. HK supervised the analyses of statistics and patient information and reviewed the manuscript. KP provided expertise on the cell-based studies and figure analyses and reviewed the manuscript. YM, QL, WQ, and TT provided expertise on the methods and reviewed the manuscript. DE, AT, and AV provided tissues obtained from humans for PKC analysis. CH and CPO provided the methods for wound healing and reviewed the manuscript. AW conducted a general review of the manuscript. GLK supervised, designed, rewrote, and reviewed the entire project and the manuscript.
Supplementary Material
Acknowledgments
This study was supported by grants from the NIH, National Institute of Diabetes and Digestive and Kidney Diseases (NIDDK) (1R24DK090961-01 and DP3 DK094333-01, to G.L. King); the Juvenile Diabetes Research Foundation (JDRF) (17-2013-310, to H. Keenan); the Diabetic Research Center (DRC) Group (P30DK036836); the Beatson Foundation Gift; and the Dianne Nunnally Hoppes Fund. This study was also supported by a William Randolph Hearst Fellowship provided by the Hearst Foundation (to M. Khamaisi) and by the Gillian Reny Stepping Strong Fund (to D.P. Orgill). We thank the Medalists and their families, the people who donated skin samples, the National Disease Research Interchange (NDRI) for coordinating the donations, and the Medalist study staff (Liane Tinsley, Stephanie D’Eon, Stephanie Hastings, and David M. Pober) at the Joslin Diabetes Center. We also thank Patti Muehter for her excellent assistance with manuscript preparation.
Footnotes
Conflict of interest: D.P. Orgill is a consultant for Integra LifeSciences.
Reference information:J Clin Invest. 2016;126(3):837–853. doi:10.1172/JCI82788.
References
- 1.Boulton AJ, Vileikyte L, Ragnarson-Tennvall G, Apelqvist J. The global burden of diabetic foot disease. Lancet. 2005;366(9498):1719–1724. doi: 10.1016/S0140-6736(05)67698-2. [DOI] [PubMed] [Google Scholar]
- 2.Brem H, Tomic-Canic M. Cellular and molecular basis of wound healing in diabetes. J Clin Invest. 2007;117(5):1219–1222. doi: 10.1172/JCI32169. [DOI] [PMC free article] [PubMed] [Google Scholar]
- 3.Michalik L, Wahli W. Involvement of PPAR nuclear receptors in tissue injury and wound repair. J Clin Invest. 2006;116(3):598–606. doi: 10.1172/JCI27958. [DOI] [PMC free article] [PubMed] [Google Scholar]
- 4.Werner S, Grose R. Regulation of wound healing by growth factors and cytokines. Physiol Rev. 2003;83(3):835–870. doi: 10.1152/physrev.2003.83.3.835. [DOI] [PubMed] [Google Scholar]
- 5.Brandner JM, Zacheja S, Houdek P, Moll I, Lobmann R. Expression of matrix metalloproteinases, cytokines, and connexins in diabetic and nondiabetic human keratinocytes before and after transplantation into an ex vivo wound-healing model. Diabetes Care. 2008;31(1):114–120. doi: 10.2337/dc07-1304. [DOI] [PubMed] [Google Scholar]
- 6.Bishop AJ, Mudge E. A retrospective study of diabetic foot ulcers treated with hyperbaric oxygen therapy. Int Wound J. 2012;9(6):665–676. doi: 10.1111/j.1742-481X.2011.00936.x. [DOI] [PMC free article] [PubMed] [Google Scholar]
- 7.Markuson M, et al. The relationship between hemoglobin A(1c) values and healing time for lower extremity ulcers in individuals with diabetes. Adv Skin Wound Care. 2009;22(8):365–372. doi: 10.1097/01.ASW.0000358639.45784.cd. [DOI] [PubMed] [Google Scholar]
- 8.Otranto M, Nascimento AP, Monte-Alto-Costa A. Insulin resistance impairs cutaneous wound healing in mice. Wound Repair Regen. 2013;21(3):464–472. doi: 10.1111/wrr.12042. [DOI] [PubMed] [Google Scholar]
- 9.Seitz O, et al. Wound healing in mice with high-fat diet- or ob gene-induced diabetes-obesity syndromes: a comparative study. Exp Diabetes Res. 2010;2010: doi: 10.1155/2010/476969. [DOI] [PMC free article] [PubMed] [Google Scholar]
- 10.Pence BD, Woods JA. Exercise, obesity, and cutaneous wound healing: evidence from rodent and human studies. Adv Wound Care (New Rochelle) 2014;3(1):71–79. doi: 10.1089/wound.2012.0377. [DOI] [PMC free article] [PubMed] [Google Scholar]
- 11.Cheng C, Singh V, Krishnan A, Kan M, Martinez JA, Zochodne DW. Loss of innervation and axon plasticity accompanies impaired diabetic wound healing. PLoS One. 2013;8(9): doi: 10.1371/journal.pone.0075877. [DOI] [PMC free article] [PubMed] [Google Scholar]
- 12.Walmsley D, Wales JK, Wiles PG. Reduced hyperaemia following skin trauma: evidence for an impaired microvascular response to injury in the diabetic foot. Diabetologia. 1989;32(10):736–739. doi: 10.1007/BF00274533. [DOI] [PubMed] [Google Scholar]
- 13.Ghanassia E, Villon L, Thuan Dit Dieudonne JF, Boegner C, Avignon A, Sultan A. Long-term outcome and disability of diabetic patients hospitalized for diabetic foot ulcers: a 6.5-year follow-up study. Diabetes Care. 2008;31(7):1288–1292. doi: 10.2337/dc07-2145. [DOI] [PMC free article] [PubMed] [Google Scholar]
- 14.Zubair M, Malik A, Ahmad J. The impact of creatinine clearance on the outcome of diabetic foot ulcers in north Indian tertiary care hospital. Diabetes Metab Syndr. 2011;5(3):120–125. doi: 10.1016/j.dsx.2012.02.028. [DOI] [PubMed] [Google Scholar]
- 15.McEwen LN, Ylitalo KR, Herman WH, Wrobel JS. Prevalence and risk factors for diabetes-related foot complications in Translating Research Into Action for Diabetes (TRIAD) J Diabetes Complications. 2013;27(6):588–592. doi: 10.1016/j.jdiacomp.2013.08.003. [DOI] [PMC free article] [PubMed] [Google Scholar]
- 16.Tsang MW, et al. Human epidermal growth factor enhances healing of diabetic foot ulcers. Diabetes Care. 2003;26(6):1856–1861. doi: 10.2337/diacare.26.6.1856. [DOI] [PubMed] [Google Scholar]
- 17.Greer N, et al. Advanced wound care therapies for nonhealing diabetic, venous, and arterial ulcers: a systematic review. Ann Intern Med. 2013;159(8):532–542. doi: 10.7326/0003-4819-159-8-201310150-00006. [DOI] [PubMed] [Google Scholar]
- 18.Hassan WU, Greiser U, Wang W. Role of adipose-derived stem cells in wound healing. Wound Repair Regen. 2014;22(3):313–325. doi: 10.1111/wrr.12173. [DOI] [PubMed] [Google Scholar]
- 19.Marston WA, Hanft J, Norwood P, Pollak R. The efficacy and safety of Dermagraft in improving the healing of chronic diabetic foot ulcers: results of a prospective randomized trial. Diabetes Care. 2003;26(6):1701–1705. doi: 10.2337/diacare.26.6.1701. [DOI] [PubMed] [Google Scholar]
- 20.Darby IA, Laverdet B, Bonte F, Desmouliere A. Fibroblasts and myofibroblasts in wound healing. Clin Cosmet Investig Dermatol. 2014;7:301–311. doi: 10.2147/CCID.S50046. [DOI] [PMC free article] [PubMed] [Google Scholar]
- 21.Driskell RR, et al. Distinct fibroblast lineages determine dermal architecture in skin development and repair. Nature. 2013;504(7479):277–281. doi: 10.1038/nature12783. [DOI] [PMC free article] [PubMed] [Google Scholar]
- 22.Thangapazham RL, Darling TN, Meyerle J. Alteration of skin properties with autologous dermal fibroblasts. Int J Mol Sci. 2014;15(5):8407–8427. doi: 10.3390/ijms15058407. [DOI] [PMC free article] [PubMed] [Google Scholar]
- 23.Brem H, et al. Primary cultured fibroblasts derived from patients with chronic wounds: a methodology to produce human cell lines and test putative growth factor therapy such as GMCSF. J Transl Med. 2008;6: doi: 10.1186/1479-5876-6-75. [DOI] [PMC free article] [PubMed] [Google Scholar]
- 24.Zgheib C, Xu J, Liechty KW. Targeting inflammatory cytokines and extracellular matrix composition to promote wound regeneration. Adv Wound Care (New Rochelle) 2014;3(4):344–355. doi: 10.1089/wound.2013.0456. [DOI] [PMC free article] [PubMed] [Google Scholar]
- 25.Keenan HA, et al. Residual insulin production and pancreatic ss-cell turnover after 50 years of diabetes: Joslin Medalist Study. Diabetes. 2010;59(11):2846–2853. doi: 10.2337/db10-0676. [DOI] [PMC free article] [PubMed] [Google Scholar]
- 26.Sun JK, et al. Protection from retinopathy and other complications in patients with type 1 diabetes of extreme duration: the joslin 50-year medalist study. Diabetes Care. 2011;34(4):968–974. doi: 10.2337/dc10-1675. [DOI] [PMC free article] [PubMed] [Google Scholar]
- 27.Hernandez SL, et al. Characterization of circulating and endothelial progenitor cells in patients with extreme-duration type 1 diabetes. Diabetes Care. 2014;37(8):2193–2201. doi: 10.2337/dc13-2547. [DOI] [PMC free article] [PubMed] [Google Scholar]
- 28.Geraldes P, King GL. Activation of protein kinase C isoforms and its impact on diabetic complications. Circ Res. 2010;106(8):1319–1331. doi: 10.1161/CIRCRESAHA.110.217117. [DOI] [PMC free article] [PubMed] [Google Scholar]
- 29.Kikkawa U, Matsuzaki H, Yamamoto T. Protein kinase C delta (PKCΔ): activation mechanisms and functions. J Biochem. 2002;132(6):831–839. doi: 10.1093/oxfordjournals.jbchem.a003294. [DOI] [PubMed] [Google Scholar]
- 30.Li Q, et al. Induction of vascular insulin resistance and endothelin-1 expression and acceleration of atherosclerosis by the overexpression of protein kinase C-beta isoform in the endothelium. Circ Res. 2013;113(4):418–427. doi: 10.1161/CIRCRESAHA.113.301074. [DOI] [PMC free article] [PubMed] [Google Scholar]
- 31.Bainbridge P. Wound healing and the role of fibroblasts. J Wound Care. 2013;22(8):407–408. doi: 10.12968/jowc.2013.22.8.407. [DOI] [PubMed] [Google Scholar]
- 32.Xuan YH, et al. High-glucose inhibits human fibroblast cell migration in wound healing via repression of bFGF-regulating JNK phosphorylation. PLoS One. 2014;9(9): doi: 10.1371/journal.pone.0108182. [DOI] [PMC free article] [PubMed] [Google Scholar]
- 33.Hart J, Silcock D, Gunnigle S, Cullen B, Light ND, Watt PW. The role of oxidised regenerated cellulose/collagen in wound repair: effects in vitro on fibroblast biology and in vivo in a model of compromised healing. Int J Biochem Cell Biol. 2002;34(12):1557–1570. doi: 10.1016/S1357-2725(02)00062-6. [DOI] [PubMed] [Google Scholar]
- 34.Weiss RA. Autologous cell therapy: will it replace dermal fillers? Facial Plast Surg Clin North Am. 2013;21(2):299–304. doi: 10.1016/j.fsc.2013.02.008. [DOI] [PubMed] [Google Scholar]
- 35.Cavanagh PR, Lipsky BA, Bradbury AW, Botek G. Treatment for diabetic foot ulcers. Lancet. 2005;366(9498):1725–1735. doi: 10.1016/S0140-6736(05)67699-4. [DOI] [PubMed] [Google Scholar]
- 36.Veves A, King GL. Can VEGF reverse diabetic neuropathy in human subjects? J Clin Invest. 2001;107(10):1215–1218. doi: 10.1172/JCI13038. [DOI] [PMC free article] [PubMed] [Google Scholar]
- 37.Lerman OZ, Galiano RD, Armour M, Levine JP, Gurtner GC. Cellular dysfunction in the diabetic fibroblast: impairment in migration, vascular endothelial growth factor production, and response to hypoxia. Am J Pathol. 2003;162(1):303–312. doi: 10.1016/S0002-9440(10)63821-7. [DOI] [PMC free article] [PubMed] [Google Scholar]
- 38.Loots MA, Lamme EN, Mekkes JR, Bos JD, Middelkoop E. Cultured fibroblasts from chronic diabetic wounds on the lower extremity (non-insulin-dependent diabetes mellitus) show disturbed proliferation. Arch Dermatol Res. 1999;291(2–3):93–99. doi: 10.1007/s004030050389. [DOI] [PubMed] [Google Scholar]
- 39.Loot MA, et al. Fibroblasts derived from chronic diabetic ulcers differ in their response to stimulation with EGF, IGF-I, bFGF and PDGF-AB compared to controls. Eur J Cell Biol. 2002;81(3):153–160. doi: 10.1078/0171-9335-00228. [DOI] [PubMed] [Google Scholar]
- 40.Pang TT, et al. Inhibition of islet immunoreactivity by adiponectin is attenuated in human type 1 diabetes. J Clin Endocrinol Metab. 2013;98(3):E418–R428. doi: 10.1210/jc.2012-3516. [DOI] [PubMed] [Google Scholar]
- 41.Igarashi M, et al. Glucose or diabetes activates p38 mitogen-activated protein kinase via different pathways. J Clin Invest. 1999;103(2):185–195. doi: 10.1172/JCI3326. [DOI] [PMC free article] [PubMed] [Google Scholar]
- 42.He Z, et al. Regulation of vascular endothelial growth factor expression and vascularization in the myocardium by insulin receptor and PI3K/Akt pathways in insulin resistance and ischemia. Arterioscler Thromb Vasc Biol. 2006;26(4):787–793. doi: 10.1161/01.ATV.0000209500.15801.4e. [DOI] [PubMed] [Google Scholar]
- 43.Rask-Madsen C, King GL. Mechanisms of Disease: endothelial dysfunction in insulin resistance and diabetes. Nat Clin Pract Endocrinol Metab. 2007;3(1):46–56. doi: 10.1038/ncpendmet0366. [DOI] [PubMed] [Google Scholar]
- 44.Vicent D, et al. The role of endothelial insulin signaling in the regulation of vascular tone and insulin resistance. J Clin Invest. 2003;111(9):1373–1380. doi: 10.1172/JCI15211. [DOI] [PMC free article] [PubMed] [Google Scholar]
- 45.Shimomura I, Matsuda M, Hammer RE, Bashmakov Y, Brown MS, Goldstein JL. Decreased IRS-2 and increased SREBP-1c lead to mixed insulin resistance and sensitivity in livers of lipodystrophic and ob/ob mice. Mol Cell. 2000;6(1):77–86. doi: 10.1016/S1097-2765(05)00010-9. [DOI] [PubMed] [Google Scholar]
- 46.Xu F, et al. Foxo1 inhibits diabetic mucosal wound healing but enhances healing of normoglycemic wounds. Diabetes. 2015;64(1):243–256. doi: 10.2337/db14-0589. [DOI] [PMC free article] [PubMed] [Google Scholar]
- 47.Maeno Y, et al. Inhibition of insulin signaling in endothelial cells by protein kinase C-induced phosphorylation of p85 subunit of phosphatidylinositol 3-kinase (PI3K) J Biol Chem. 2012;287(7):4518–4530. doi: 10.1074/jbc.M111.286591. [DOI] [PMC free article] [PubMed] [Google Scholar]
- 48.Goren I, et al. Akt1 controls insulin-driven VEGF biosynthesis from keratinocytes: implications for normal and diabetes-impaired skin repair in mice. J Invest Dermatol. 2009;129(3):752–764. doi: 10.1038/jid.2008.230. [DOI] [PubMed] [Google Scholar]
- 49.Lima MH, et al. Topical insulin accelerates wound healing in diabetes by enhancing the AKT and ERK pathways: a double-blind placebo-controlled clinical trial. PLoS One. 2012;7(5): doi: 10.1371/journal.pone.0036974. [DOI] [PMC free article] [PubMed] [Google Scholar]
- 50.Park K, et al. Serine phosphorylation sites on IRS2 activated by angiotensin II and protein kinase C to induce selective insulin resistance in endothelial cells. Mol Cell Biol. 2013;33(16):3227–3241. doi: 10.1128/MCB.00506-13. [DOI] [PMC free article] [PubMed] [Google Scholar]
- 51.Rask-Madsen C, King GL. Proatherosclerotic mechanisms involving protein kinase C in diabetes and insulin resistance. Arterioscler Thromb Vasc Biol. 2005;25(3):487–496. doi: 10.1161/01.ATV.0000155325.41507.e0. [DOI] [PubMed] [Google Scholar]
- 52.Leibiger B, et al. Short-term regulation of insulin gene transcription by glucose. Proc Natl Acad Sci U S A. 1998;95(16):9307–9312. doi: 10.1073/pnas.95.16.9307. [DOI] [PMC free article] [PubMed] [Google Scholar]
- 53.Ruderman NB, Carling D, Prentki M, Cacicedo JM. AMPK, insulin resistance, and the metabolic syndrome. J Clin Invest. 2013;123(7):2764–2772. doi: 10.1172/JCI67227. [DOI] [PMC free article] [PubMed] [Google Scholar]
- 54.Thangarajah H, et al. The molecular basis for impaired hypoxia-induced VEGF expression in diabetic tissues. Proc Natl Acad Sci U S A. 2009;106(32):13505–13510. doi: 10.1073/pnas.0906670106. [DOI] [PMC free article] [PubMed] [Google Scholar]
- 55.Duscher D, et al. Transdermal deferoxamine prevents pressure-induced diabetic ulcers. Proc Natl Acad Sci U S A. 2015;112(1):94–99. doi: 10.1073/pnas.1413445112. [DOI] [PMC free article] [PubMed] [Google Scholar]
- 56.Feldman EL, Stevens MJ. Clinical testing in diabetic peripheral neuropathy. Can J Neurol Sci. 1994;21(4):S3–S7. doi: 10.1017/s0317167100040671. [DOI] [PubMed] [Google Scholar]
- 57.Shevchenko RV, et al. The in vitro characterization of a gelatin scaffold, prepared by cryogelation and assessed in vivo as a dermal replacement in wound repair. Acta Biomater. 2014;10(7):3156–3166. doi: 10.1016/j.actbio.2014.03.027. [DOI] [PubMed] [Google Scholar]
- 58.Succar J, et al. The role of mouse mast cell proteases in the proliferative phase of wound healing in microdeformational wound therapy. Plast Reconstr Surg. 2014;134(3):459–467. doi: 10.1097/PRS.0000000000000432. [DOI] [PubMed] [Google Scholar]
- 59.Geraldes P, et al. Activation of PKC-delta and SHP-1 by hyperglycemia causes vascular cell apoptosis and diabetic retinopathy. Nat Med. 2009;15(11):1298–1306. doi: 10.1038/nm.2052. [DOI] [PMC free article] [PubMed] [Google Scholar]
- 60.Mima A, et al. Retinal not systemic oxidative and inflammatory stress correlated with VEGF expression in rodent models of insulin resistance and diabetes. Invest Ophthalmol Vis Sci. 2012;53(13):8424–8432. doi: 10.1167/iovs.12-10207. [DOI] [PMC free article] [PubMed] [Google Scholar]
- 61.Heit YI, et al. Early kinetics of integration of collagen-glycosaminoglycan regenerative scaffolds in a diabetic mouse model. Plast Reconstr Surg. 2013;132(5):767e–776e. doi: 10.1097/PRS.0b013e3182a3c091. [DOI] [PubMed] [Google Scholar]
- 62.Jung M, et al. Mast cells produce novel shorter forms of perlecan that contain functional endorepellin: a role in angiogenesis and wound healing. J Biol Chem. 2013;288(5):3289–3304. doi: 10.1074/jbc.M112.387811. [DOI] [PMC free article] [PubMed] [Google Scholar]
- 63.Tancharoen S, et al. Cleavage of host cytokeratin-6 by lysine-specific gingipain induces gingival inflammation in periodontitis patients. PLoS One. 2015;10(2): doi: 10.1371/journal.pone.0117775. [DOI] [PMC free article] [PubMed] [Google Scholar]
- 64.Ji R, et al. TAM receptors support neural stem cell survival, proliferation and neuronal differentiation. PLoS One. 2014;9(12): doi: 10.1371/journal.pone.0115140. [DOI] [PMC free article] [PubMed] [Google Scholar]
Associated Data
This section collects any data citations, data availability statements, or supplementary materials included in this article.