

Abstract
T regulatory cells (Tregs) control immune homeostasis by preventing inappropriate responses to self and nonharmful foreign antigens. Tregs use multiple mechanisms to control immune responses, all of which require these cells to be near their targets of suppression; however, it is not known how Treg-to-target proximity is controlled. Here, we found that Tregs attract CD4+ and CD8+ T cells by producing chemokines. Specifically, Tregs produced both CCL3 and CCL4 in response to stimulation, and production of these chemokines was critical for migration of target T cells, as Tregs from Ccl3–/– mice, which are also deficient for CCL4 production, did not promote migration. Moreover, CCR5 expression by target T cells was required for migration of these cells to supernatants conditioned by Tregs. Tregs deficient for expression of CCL3 and CCL4 were impaired in their ability to suppress experimental autoimmune encephalomyelitis or islet allograft rejection in murine models. Moreover, Tregs from subjects with established type 1 diabetes were impaired in their ability to produce CCL3 and CCL4. Together, these results demonstrate a previously unappreciated facet of Treg function and suggest that chemokine secretion by Tregs is a fundamental aspect of their therapeutic effect in autoimmunity and transplantation.
Introduction
T regulatory cells (Tregs) are essential for preventing immunity to self antigens (Ags) and nonharmful foreign Ags; they also play an active role in suppressing immunity to tumors and chronic infectious diseases (1). Animal models have definitively shown that boosting or inhibiting the function of Tregs is an effective way to prevent, and in some cases cure, many immune-mediated diseases. Approaches to specifically modulating the activity of Tregs are already being translated to humans, yet we know remarkably little about how Tregs achieve their potent immunosuppressive effects in vivo.
Known mechanisms of suppression by Tregs include production of immunosuppressive cytokines, such as IL-10, TGF-β, and IL-35, expression of coinhibitory molecules, such as CTLA-4, PD-1, and LAG-3, which dampen the function of Ag-presenting cells (APCs), disruption of the metabolic environment by sequestering IL-2 and producing pericellular adenosine, and cytotoxicity. Notably, all of these mechanisms require local cell proximity, with multiple in vitro studies showing cell-contact–dependent effects and in vivo imaging revealing direct interactions among Tregs, effector T cells, and APCs (2–4).
Multiple reports demonstrate the essential role of chemokine receptor expression on Tregs for trafficking and immune regulation (5–8). For example, CCR4-expressing Tregs accumulate at tumor sites in response to CCL22 secreted by cancer cells (9), mice with CCR4-deficient Tregs develop severe inflammatory disease in the skin (10), and in an adoptive transfer model, CCR4 expression by Tregs is required for suppression of the effector phase of an allergic response (11). Correct Treg homing is also critical for suppression of graft-versus-host disease (12), priming of the initiation phase of an allergic response (11), and access to exogenous IL-2 versus costimulation via ICOS (13).
In contrast to the well-defined role of chemokine receptors, the ability of Tregs themselves to produce chemokines and direct immune cell trafficking is not well characterized. In humans, CD4+FOXP3+ Tregs produce CXCL8, which attracts neutrophils in vitro (14), as well as XCL1, which contributes to their suppressive function (15). Evidence that human Tregs themselves produce chemokines is surprising, as these molecules are typically thought to promote, not suppress, inflammation (16).
Here, we report that both human and murine Tregs produce the chemokines CCL3 and CCL4 as a means to attract CD4+ and CD8+ T cells close to their proximity in vitro and in vivo. Production of CCL3 and CCL4 by Tregs is also required for successful adoptive Treg cell therapy in murine models. Additionally, Tregs from patients with type 1 diabetes (T1D) produce reduced levels of CCL3 and CCL4 compared with those from healthy controls. Thus chemokine production by Tregs is a previously unknown mechanism important for immune regulation with important implications for our understanding of how to optimize Treg-based cell therapies.
Results
CCL3 and CCL4 are produced by lineage-committed Tregs and regulated by FOXP3.
To investigate the role of chemokine production by Tregs, CD4+FOXP3+ Tregs and CD4+FOXP3– T conventional (Tconv) cells were sorted from FOXP3EGFP mice and activated via the T cell receptor (TCR). After 48 hours of stimulation, mRNA (Figure 1A) and protein levels (Figure 1B) of CCL3 and CCL4 were elevated in both cell populations. Expression of CCL5, the third ligand for CCR5, was not detectable (Figure 1C). The ability of mouse Tregs to produce chemokines was confirmed using intracellular staining for CCL3, demonstrating that FOXP3+ and FOXP3– CD4+ T cells produced comparable amounts of CCL3, but as expected, not of IFN-γ (Figure 1D). Tregs differentiated in vitro by stimulation in the presence of TGF-β also produced CCL3 at levels similar to those of ex vivo Tregs (Figure 1E).
Figure 1. Mouse FOXP3+ Tregs produce CCL3 and CCL4.

(A–C) CD4+ T cells were sorted into CD4+FOXP3+EGFP+ Tregs and CD4+FOXP3–EGFP– Tconv cells and stimulated for 48 hours with plate-bound α-CD3 (10 μg/ml) and soluble α-CD28 (2.5 μg/ml) in the presence of IL-2 (100 U/ml). (A) Ccl3 and Ccl4 mRNAs were quantified by RT-PCR and normalized to 18S rRNA. Expression is shown relative to unstimulated ex vivo levels. Data are the average ± SEM from 3 independent experiments. (B) Amounts of CCL3 and CCL4 in supernatants were determined using CBA flex sets. Data are the average ± SEM from 3 independent experiments. (C) Amounts of CCL3, CCL4, and CCL5 in supernatants were determined as in B after stimulation with the indicated amount of plate-bound α-CD3 (1 or 10 μg/ml), together with soluble α-CD28 and IL-2 as in A and B. Data are the average ± SEM from 3 independent experiments. (D) CD4+FOXP3+ Tregs and CD4+FOXP3– Tconv cells were stimulated for 72 hours as in A and B, then restimulated with PMA/ionomycin. The proportions of CCL3+ or IFN-γ+ cells within the live FOXP3+ or FOXP3–CD4+ gate were determined; gates were set based on equivalently stained unstimulated cells. Flow cytometry plots depict a representative experiment, with the average ± SEM of 3 independent experiments on the right. (E) CD4+FOXP3EGFP– cells were placed under iTreg differentiation (coated α-CD3 10 mg/ml, α-CD28 2.5 mg/ml, TGF-β 10 ng/ml, and IL-2 100 U/ml) or neutral (coated α-CD3 10 mg/ml, α-CD28 2.5 mg/ml, and IL-2 100 U/ml) conditions for 3 days, then restimulated with PMA/ionomycin. The proportions of CCL3+ or IFN-γ+ cells within live FOXP3+ cells or neutral conditions were determined and compared with data from ex vivo FOXP3+ Tregs. Left panel depicts a representative experiment; right panel shows the average ± SEM of 3 independent experiments. (F) Jurkat T cells were transfected with a pGL3 CCL3 or CCL4 promoter reporter construct together with an empty vector or a FOXP3-expressing vector. Normalized luciferase activity of the reporter construct is shown for 3 (CCL3) and 4 (CCL4) independent experiments. *P < 0.05 by paired t test.
In human monocytes, the promoters for CCL3 and CCL4 are regulated through an NF-κB–dependent mechanism (17). A recent genome-wide ChIP study of human Tregs found that FOXP3 could bind to the promoter regions of CCL3 and CCL4 (18), and bioinformatic analysis revealed putative FOXP3-binding sites in both loci (Figure 1F). To investigate whether FOXP3 can directly regulate expression of these chemokines, 1-kb segments at 5′ of the transcription start sites for human CCL3 and CCL4 were cloned upstream of a luciferase reporter gene and transfected into immortalized human T lymphocytes (Jurkat cells) together with either an empty vector or a vector encoding FOXP3. Coexpression of FOXP3 resulted in a significant increase in luciferase reporter activity (P < 0.04 for CCL3 and P < 0.03 for CCL4), demonstrating that FOXP3 can transactivate the expression of both of these genes.
FOXP3+ cells contain both CD25hi and CD25lo cells, with evidence that those within the CD25lo population may be unstable and not fully lineage committed (19). To determine whether chemokine production may originate from unstable Tregs, FOXP3+ cells were sorted into CD25hi and CD25lo populations. As shown in Figure 2A, we found that chemokine-producing cells were present in both CD25hi and CD25lo FOXP3+ cell populations. We also asked whether chemokine-producing Tregs have an altered phenotype, but found that CCL3-expressing Tregs possessed the expected activated Treg phenotype, with high expression of multiple proteins associated with suppressive function (Figure 2,B and C). Thus, CCL3- and CCL4-producing Tregs are fully lineage committed and express canonical markers associated with suppressive potential (19).
Figure 2. Characterization of CCL3-producing Tregs in mice.

(A) Cells from WT mice were sorted as CD25hiFOXP3EGFP+ or CD25loFOXP3EGFP+ Tregs. After 2 days with or without stimulation, amounts of chemokine in supernatants were measured. (B and C) WT Tregs were stimulated for 2 days as in Figure 1, A and B, then restimulated with PMA/ionomycin. Expression of the indicated markers was measured in gated CCL3+ or CCL3– cells. B shows averaged data for n = 3 (plus technical replicates for FOXP3 MFI for n = 13). *P ≤ 0.05, unpaired t test. C shows averaged data for n = 2.
CCL3-deficient Tregs are suppressive in vitro.
To directly investigate the function of chemokines produced by Tregs, we examined Tregs from Ccl3-deficient mice (20). In experiments confirming the lack of CCL3 expression in these mice, we were surprised to find a reduction in the production of CCL4 from Ccl3–/– T cells compared with WT T cells (Supplemental Figure 1A; supplemental material available online with this article; doi:10.1172/JCI83987DS1). Ccl3–/– mice retain the neomycin cassette from the targeting vector, which can decrease expression of genes up to 100 kb away (21), raising the possibility that the expression of other chemokines in the macrophage inflammatory protein (MIP) gene cluster on chromosome 11 (22) could also be affected. Comparison of mRNA expression of 11 chemokines in Tregs sorted from WT or Ccl3–/– mice revealed that, in addition to Ccl3, only expression of Ccl4, which is adjacent to Ccl3 (Supplemental Figure 1B), was significantly affected (Supplemental Figure 1C). Therefore, Ccl3–/– mice provide a suitable model for investigating the function of Tregs that lack Ccl3 and are hypomorphic for Ccl4.
To assess the role of chemokine production in suppression, we first performed standard in vitro suppression assays. We found that Ccl3–/– Tregs suppressed T cell proliferation in vitro as effectively as WT Tregs (Figure 3A), indicating that chemokine production is not required for Tregs to suppress target cells if the cells are in direct contact. Ccl3–/– Tregs also had normal expression of activation markers and surface receptors associated with suppressive mechanisms (Figure 3B). Thus, Ccl3–/– Tregs are functional in vitro and are phenotypically similar to WT lineage–committed Tregs.
Figure 3. WT and Ccl3–/– Tregs suppress T cell proliferation equally and have an equivalent activation phenotype.

(A) CD4+CD25hiCD45RBlo Tregs from WT or Ccl3–/– mice were added in increasing numbers to CPD-labeled WT CD4+CD25–CD45RBhi Tconv cells. The cocultures were stimulated with α-CD3 mAbs and irradiated APCs for 3 days. Tconv cell proliferation was measured by CPD dilution, and division index was calculated and used to determine percentage of suppression (n = 3). (B) WT or Ccl3–/– Tregs were cultured with or without stimulation with α-CD3/28 and IL-2 as in Figure 2. After 2 days, the expression of the indicated proteins was determined by flow cytometry. Shown are histogram overlays representing data from Tregs pooled from 5 WT or Ccl3–/– mice analyzed with technical replicates of at least 2 independent experiments.
Tregs attract CD4+ and CD8+ T cells via a CCL3/4-CCR5–dependent mechanism in vitro.
We next determined whether chemokines produced by Tregs could attract CD4+ and CD8+ T effector cells. In vitro Transwell assays revealed that supernatants collected from Tregs and Tconv cells that had been activated for 48 hours stimulated the migration of CD4+ Tconv cells (Figure 4A) and CD8+ T cells (Figure 4B). In both cases, the migration was significantly (P < 0.05) reduced when the target cells lacked expression of CCR5, suggesting a role for the ligands CCL3 and CCL4.
Figure 4. Tregs attract CD4+ and CD8+ T cells in vitro via a CCL3/4-CCR5–dependent mechanism.

Tregs and Tconv cells were sorted from WT or Ccl3–/– mice, and CD4+ or CD8+ T cells were sorted from WT or Ccr5–/– mice. (A–C) Supernatants from TCR-stimulated Tregs or Tconv cells were placed in the bottom of a Transwell chamber, and CD4+ or CD8+ T cells were placed on top. The number of migrating cells is expressed as a fold increase compared with medium alone. Data are the average ± SEM; statistical analysis by t test (A, n = 4 B, n = 5) or 1-way ANOVA with Bonferroni’s post-hoc test (C, n = 9). (D) 200,000 ex vivo Thy1.1+CD4+ or Thy1.1+CD8+ T cells were placed in the upper chamber of a Transwell plate in the absence or presence of 200,000 stimulated Thy1.2+ CD4+ Tconv cells or Tregs from WT or Ccl3–/– mice or media alone. The bottom chambers contained supernatants from the indicated stimulated or unstimulated cells. After 3 hours, the numbers of Thy1.1+ cells in the bottom chamber were counted by flow cytometry. Shown are averaged data from 3 independent experiments, represented as means with SEM, 2-way ANOVA with Bonferroni’s post-hoc test. (E) 300,000 ex vivo CD8+ or CD4+ cells were placed in the upper chamber of a Transwell plate, and the bottom chambers contained supernatants from the stimulated Tregs or media in the absence or presence of neutralizing antibodies (1 mg/ml) against CCL3 and/or CCL4 as indicated. After 3 hours, the numbers of migrating cells in the bottom chamber were counted by flow cytometry. The absolute number of migrating cells is shown. Data are the average ± SEM of technical duplicates, 2-way ANOVA with Bonferroni’s post-hoc test. *P < 0.05; **P < 0.01; ***P < 0.005; ****P < 0.0001.
Migration of WT CD8+ T cells toward supernatants from Ccl3–/– Tregs or Tconv cells was significantly diminished compared with migration toward supernatants from WT cells (P < 0.001, Figure 4C), as was migration of CD8+ T cells derived from Ccr5–/– mice. Notably, Ccr5–/– T cells migrated more toward supernatants from WT than from Ccl3–/– Tregs or Tconv cells (Figure 4C compare black bars), confirming that T cells express receptors other than CCR5 that can respond to CCL3 and/or CCL4 (23). Interestingly, the presence of WT, but not Ccl3–/–, Tregs in the top of the Transwell prevented migration of both CD4+ and CD8+ T cells toward chemokines in the bottom of the Transwell, demonstrating the potency of the effect (Figure 4D). The capacity of migrating cells to produce CCL3 and CCL4 did not affect their ability to migrate (Supplemental Figure 2).
To examine the relative role of CCL3 versus CCL4 in migration, migration assays were performed in the presence of neutralizing antibodies against CCL3 and/or CCL4. Blockade of either chemokine was sufficient to reduce migration of effector CD4+ and CD8+ T cells (Figure 4E), with a slight, but not significant, further reduction in migration in the presence of both neutralizing antibodies. Evidence that CCL4 is secreted as a heterodimer with CCL3 (24) provides a likely explanation for this finding.
In vivo attraction of effector CD4+ and CD8+ T cells via production of CCL3/4 by Tregs.
We then assessed whether Tregs can attract T cells in vivo, using a model that previously found a role for the CCL3/4-CCR5 pathway in CD4+ T cell helper function (25). Tregs were sorted from FOXP3EGFP × OT-II TCR transgenic B6 mice, confirmed to produce CCL3 and CCL4 upon OVA stimulation in vitro (Supplemental Figure 3A), and injected s.c. into the dorsum of both the rear right and left feet of WT B6 mice. Another cohort of WT B6 mice received similar injections of Tconv cells sorted from the same donors. The OVA 323–339 peptide was coinjected in the right foot of each mouse to stimulate production of CCL3 and CCL4 on the right side (Figure 5A). After 18 hours, cell proliferation dye–labeled (CPD-labeled) WT or Ccr5–/– CD8+ T cells were injected i.v., and after 40 hours, the inguinal draining lymph nodes were collected from both sides and the absolute number of CPD+CD8+ T cells in the right versus left side was determined. As shown in Figure 5B, WT, but not Ccr5–/– CD8+, T cells specifically migrated to the right side in response to both Ag-activated Tregs and Tconv cells.
Figure 5. Tregs attract CD8+ T cells in vivo via a CCL3/4-CCR5 dependent mechanism.

Tregs were sorted from WT, OTII, or Ccl3–/– mice, and CD8+ T cells were sorted from WT or Ccr5–/– mice. (A and B) 2 × 10⁶ sorted OTII Tregs or Tconv cells were injected into the rear right and left feet, and a mixture of OVA 323–339 and CpG in alum was injected into the right foot only. After 18 hours, CPD-labeled WT or Ccr5–/– CD8+ T cells were injected i.v. After 40 hours, the ratio of WT or Ccr5–/– CD8+ T cells in the right and left draining inguinal lymph nodes was determined. (A) Schematic of the experimental setup. (B) Summary of the experiments, depicting the ratio of labeled WT or Ccr5–/– CD8+ T cells in the right versus left draining inguinal lymph nodes (n = 4–6 for each group, from 3 experiments), paired t test. **P < 0.01. (C and D) The right foot was injected with 1 × 10⁶ WT or Ccl3–/– Tregs, which had been stimulated in vitro, and 2 hours later, WT or Ccr5–/– CD8+ T cells were injected i.v. (C) Schematic of the experimental setup. (D) Summary of the experiments. Each dot represents the right/left ratio from an individual mouse (n = 2–3 for each group, from 2 experiments); paired t test. *P < 0.05; **P < 0.01.
To specifically test the role of CCL3 and CCL4 in in vivo migration, Tregs or Tconv cells from WT or Ccl3–/– mice were first activated via the TCR in vitro and then injected into the dorsum of the right foot of WT mice, followed by i.v. injection with WT or Ccr5–/– CPD-labeled CD8+ or CD4+ T cells. After 40 hours, the inguinal draining lymph nodes were harvested, and the number of CD4+ or CD8+ T cells that had migrated was assessed (Figure 5C and Supplemental Figure 3, B and C). Tregs and Tconv cells from Ccl3–/– mice were significantly impaired in their capacity to attract CD8+ T cells (Figure 5D for Tregs and Supplemental Figure 3C for Tconv cells), and there was a trend toward diminished migration of CD4+ T cells toward Ccl3–/– Tregs (Supplemental Figure 3B). Although it cannot be formally excluded, the reduced ability of Ccl3–/– Tregs to attract T cells in vivo was not likely due to a reduction in survival of Ccl3–/– Tregs, since equal proportions and absolute numbers of live FOXP3+ WT and Ccl3–/– Tregs could be recovered from the inguinal draining lymph node (Supplemental Figure 4). Together, these data indicate that Tregs, like CD4+ Tconv cells, stimulate chemotaxis of effector CD4+ or CD8+ T cells in vivo via the CCL3/4-CCR5 pathway.
Chemokine production by Tregs is necessary for their therapeutic effect in vivo.
We next evaluated whether the ability of Tregs to produce chemokines was necessary for their therapeutic effect in cell therapy models. Adoptive transfer of Tregs can halt the progression of experimental autoimmune encephalomyelitis (EAE), an animal model of multiple sclerosis, by suppressing the activity of pathogenic, autoreactive T cells (26, 27). To determine whether secretion of chemokines by Tregs is required for their therapeutic effect, we adoptively transferred 1.5 × 10⁶ Thy1.2+CD4+CD25hiCD45RBlo WT or Ccl3–/– Tregs into Thy1.1+ WT mice 2 days prior to induction of EAE. The animals that received WT Tregs displayed a significantly reduced severity of EAE compared with those that received Ccl3–/– Tregs or no Tregs (Figure 6A). The inability of Ccl3–/– Tregs to ameliorate EAE was paralleled by a failure of these cells to prevent the migration of Thy1.1+ CD4+ T cells into the central nervous system at the peak of disease (Figure 6B), a process essential for disease progression (27).
Figure 6. Ccl3–/– Tregs fail to reduce the progression and severity of EAE or to protect from islet allograft rejection.

(A and B) Three days before induction of EAE, WT B6 mice were injected with 2 × 10⁶ WT or Ccl3–/– Tregs or PBS. On day 0, EAE was induced by injection of MOG35–55, CFA, and pertussis toxin. (A) The clinical EAE score was calculated daily. Data shown are the average ± SEM of the clinical scores of 6 mice per group treated in 3 separate experiments. ***P < 0.005, paired 1-way ANOVA. (B) The total number of CD4+ T cells infiltrating the CNS was determined at day 22; each symbol represents data from 1 mouse (n = 6 per group). *P < 0.05, unpaired 2-tailed Student’s t test. (C and D) Streptozocin-induced diabetic WT B6 mice were transplanted with 300 hand-picked BALB/c islets with adoptive transfer of 1 × 10⁶ WT or Ccl3–/– Tregs or PBS. (C) Damage to pancreatic islets was monitored by reading blood glucose levels. Animals with consecutive readings of blood glucose greater than 20 mmol/l were considered diabetic. (D) Summary survival based on blood glucose levels from C (n = 5–10 per group). Results are representative of 4 separate preparations of islets and Tregs. Differences between graft survival times were assessed by Kaplan-Meier survival analysis.
To ask whether the requirement for chemokine production by Tregs was relevant in a second model of cell therapy, we used a model of islet transplantation in which adoptive transfer of Tregs can suppress alloimmunity and delay the rejection of islet allografts (28). Thy1.1+ WT B6 mice were treated with streptozotocin to induce diabetes, and after 4 days, BALB/c islets were transplanted under the kidney capsule with or without cotransfer of 1.5 × 10⁶ Thy1.2+CD4+CD25hiFoxp3+ WT or Ccl3–/– Tregs. Blood glucose monitoring revealed that injection of WT Tregs significantly ameliorated the rejection of allogeneic islets (Figure 6, C and D). In contrast, Ccl3–/– Tregs were impaired in this capacity, with only 1 of 7 mice accepting the graft for more than 100 days.
Tregs from healthy adults produce CCL3 and CCL4.
To investigate whether chemokine production from Tregs may also be relevant in humans, we first assessed the amount of CCL3 and CCL4 produced by Tregs and Tconv cells sorted from the blood of healthy adults. As shown in Figure 7A, activated human Tregs from adults produced CCL3 and CCL4, but at levels that were about 10-fold lower than those from activated CD4+ Tconv cells. These data in adult humans contrast with those from mice in which Tregs produced levels of chemokines that were equivalent to those of their Tconv cell counterparts (see Figure 1). Intracellular cytokine staining revealed similar results (Figure 7B). This difference between humans and mice is likely due to the high proportion of memory T cells in the human Tconv cell population; these memory T cells are primed to produce high levels of cytokines and chemokines. This interpretation is supported by data obtained with pediatric samples (see below), which have fewer memory Tconv cells and show equivalent production of chemokines from Tregs and Tconv cells.
Figure 7. Tregs from the blood of subjects with established T1D have decreased CCL3 and CCL4 production.

(A) Tregs and Tconv cells were sorted from the blood of healthy adults, and 1 × 10⁶/ml were stimulated with α-CD3/α-CD28–coated beads in the presence of IL-2. After 48 hours, the amounts of CCL3, CCL4, and IFN-γ in supernatants were determined. The background of the respective unstimulated samples was subtracted; shown are the means ± SEM for 3 individuals. (B) Activated Tregs and Tconv cells were restimulated with PMA/ionomycin, and the proportions of live, single cells producing CCL3, CCL4, or IFN-γ were determined. Shown are representative plots and mean ± SEM for 8 individuals with the background of the respective unstimulated sample subtracted. (C) FACS-sorted peripheral blood Tconv cells and Tregs from adult controls (n = 15, mean with SD) were activated with α-CD3/α-CD28–coated beads in the presence of IL-2 for 48 hours at a cell concentration of 1.4 × 10⁵/ml (left panel) or 1.4 × 10⁵/ml (right panel). FACS-sorted peripheral blood Tregs from pediatric controls (n = 17–18), established T1D (est) (n = 18–22), new-onset T1D (new) (n = 15–17), and JIA (n = 13) patients were activated with α-CD3/α-CD28–coated beads in the presence of IL-2 for 48 hours at a cell concentration of 1.4 × 10⁵/ml. For C and D, supernatants were collected and CCL3, CCL4, and IFN-γ were assessed by CBA. Background measurements in the unstimulated sample were subtracted, and outliers were excluded by the ROUT method (Q = 1%); 1-way ANOVA with Bonferroni’s post-hoc test. *P < 0.05; **P < 0.01; ***P < 0.001.
Production of CCL3 and CCL4 by Tregs is impaired in established T1D patients.
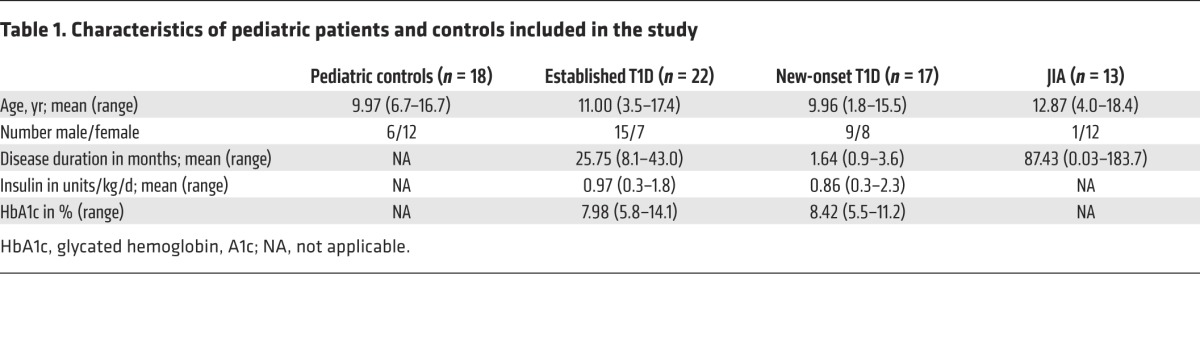
Loss of normal Treg function is widely believed to make an important contribution to the progression of autoimmunity in humans (29). To determine whether abnormalities in chemokine production are correlated with autoimmunity, we compared chemokine production by Tregs derived from the peripheral blood of control pediatric subjects with that by Tregs derived from patients with new onset (<6 months from diagnosis) or established (> 6 months from diagnosis) T1D or juvenile idiopathic arthritis (JIA) (subject characteristics in Table 1). CD4+CD25hiCD127lo Tregs and CD4+CD25–CD127hi Tconv cells sorted from patients and controls showed comparable expression of FOXP3 and cell viability (Supplemental Figure 5). Due to the limited cell numbers, the assay was first optimized with adults to detect chemokines from 5,000 sorted Tregs and Tconv cells (Figure 7C). Using this optimized assay, the amounts of CCL3, CCL4, or IFN-γ secreted by Tconv cells did not differ between pediatric subjects who were healthy and those that had T1D or JIA (Supplemental Figure 6). In contrast, Tregs from established T1D subjects secreted significantly less CCL3 and CCL4 (P < 0.05) than Tregs from pediatric controls or subjects with new onset T1D or JIA (Figure 7D). Interestingly, Tregs from T1D subjects were not inherently deficient in production of chemokines. Tregs from diabetic and control subjects, but interestingly not JIA subjects, produced similar amounts of CXCL8 (Supplemental Figure 7), a chemokine we have shown previously to be essential for Tregs to attract neutrophils in vitro (14). There was no difference in the amount of IFN-γ produced by Tregs from the blood of healthy children or any of the disease cohorts (Figure 7D).
Table 1. Characteristics of pediatric patients and controls included in the study.
Discussion
Here, we propose a model whereby activated Tregs produce CCL3 and CCL4 to attract CCR5-expressing cells. The importance of this pathway in Treg biology is supported by multiple lines of evidence including the following: in vitro and in vivo migration assays; the function of Treg therapy in models of autoimmunity and allograft rejection; and correlative data showing that this pathway is defective in Tregs from children with established T1D. Although it may appear counterintuitive that immunosuppressive Tregs produce chemokines, which are typically thought of as mediators of inflammation, it is logical that Tregs should be able to facilitate their proximity-dependent mechanisms of action. The role of chemokines in Treg function has likely been overlooked because cell-cell proximity is intrinsic to standard in vitro assays of Treg function when cells are cocultured.
Tregs are known to migrate rapidly in response to chemokines produced at sites of inflammation and to the lymph nodes draining inflammatory sites (5, 7). Indeed, expression of unique combinations of chemokine receptors by subsets of Tregs contributes to their functional specialization in different contexts (30), and loss of correct Treg homing can lead to a variety of pathologies, including heightened allograft rejection and autoimmunity (5, 8). Once in proximity to their targets, Tregs can prevent both innate and adaptive immune cells from making chemokines (31, 32), leading to an overall reduction in immune cell trafficking (33). Treg-directed cell migration is not inconsistent with these findings, and indeed, offers an explanation for how Tregs could rapidly contact their targets to suppress inflammation locally at the site of tissue inflammation or within a lymph node.
We found that the CCL3/CCL4-CCR5 pathway is the predominant pathway that mediates the ability of Tregs to attract CD4+ and CD8+ T cells. Humans who are deficient in CCR5 because of the CCR5Δ32 mutation have been well characterized, as this genetic polymorphism renders individuals resistant to HIV (34). CCR5-deficient individuals are healthy, but are more susceptible to severe/higher rates of infections with certain viruses (35), probably due to the role of CCR5 in memory T cell formation (25, 36, 37). CCR5-deficient humans have also been found to have a lower incidence of inflammatory diseases, including autoimmune arthritis (35), probably due to the proinflammatory function of CCL3, CCL4, and CCL5. However, a possible role for this pathway in immune regulation was not considered in the interpretation of these data.
Notably, CCR5 may not be the only receptor involved in Treg-stimulated chemotaxis, since migration was not completely abolished in Ccr5–/– T cells in vitro; only when both CCR5 and CCL3/CCL4 were removed did chemotaxis return to baseline. Although here we focused on the ability of Tregs to stimulate effector T cell migration, since many other immune cells also express CCR5, in vivo Tregs may have the ability to attract multiple different cell types. Overall, further research will be required to understand the role of the CCR5 pathway as well as other chemokine receptors in controlling immune suppression versus effector function.
The production of CCL3 and CCL4 by CD4+ Tconv cells is known to be critical for the development of T cell memory. For example, the production of CCL3 and CCL4 by Ag-activated CD4+ Tconv cells allows CD8+ T cells to migrate toward sites of immune activation and is important for generating memory CD8+ T cell responses (25, 36). It is tempting to speculate that this mechanism may serve a dual role in Tregs, first to enable them to attract their own “help” in the form of IL-2 production from CD4+ Tconv cells, which is known to precede suppression (38), and second, to bring effector T cells into their proximity to be suppressed. The importance of in vivo proximity of Tregs to T cells in tissues was recently demonstrated in a model of T1D in which stable Treg-Tconv cell interactions were found in conjunction with Treg-mediated protection from β cell death (2). Moreover, Liu et al. recently reported the presence of microclusters of IL-2–producing, self-reactive T cells and Tregs within lymph nodes (39).
There is considerable hope that Tregs may be used as a cellular therapy to regulate immune responses in autoimmunity and transplantation (40). The finding that Tregs deficient in production of CCL3 and CCL4 fail to prevent the progression of EAE and the rejection of islet allografts suggests that chemokine production by Tregs is an important aspect of their beneficial effect. Although we cannot exclude the possibility that loss of chemokine production may also affect Treg survival and/or proliferation, it will be important to determine whether Tregs being used in clinical trials (stably) produce chemokines and whether this aspect of their function may need to be tailored in different disease settings. For example, since Tregs from patients with established T1D have impaired chemokine production, strategies to reverse this defect should be considered during the development of Treg therapies for this disease.
Future studies will be needed to define why Tregs from children with established T1D have a deficit in chemokine production. Some possibilities that could be tested include the following: defective IL-2 signaling and unstable FOXP3 expression, known to occur in some individuals with T1D (41), which could lead to reduced transactivation of the CCL3/CCL4 promoters by FOXP3; and differential/unstable levels of glucose and/or insulin which could affect T cell metabolism (42) and thus chemokine production. An important difference between T1D and JIA is that, whereas autoimmunity in T1D is untreated, JIA subjects receive immunomodulatory/immunosuppressive treatments. By reducing inflammation, these treatments could directly or indirectly restore defects in Tregs (43). Moreover, in JIA, many changes in immune cells are only detectable in inflamed tissues (43, 44), providing possible explanations for the apparent T1D-specific changes in Tregs.
In conclusion, chemokine-mediated attraction of adaptive immune cells toward Tregs is a previously unknown mechanism of immune regulation. This finding has important implications for understanding how tolerance may fail and for developing Treg-based cell therapies to control immune-mediated diseases.
Methods
Isolation, purification of mouse T cells.
C57BL/6 FOXP3EGFP (WT), C57BL/6 Thy1.1+, Thy1.2+, OT-II × FOXP3EGFP, Ccr5–/–, Ccl3–/–, and BALB/c mice (The Jackson Laboratory) were maintained in specific pathogen–free conditions. WT CD4+ T cells from spleen and lymph nodes were enriched using the EasySep CD4-Negative Selection Kit (StemCell Technologies) and sorted on the basis of EGFP expression into Treg (CD4+EGFP+), CD4+CD25hiEGFP+, or CD4+CD25loEGFP+ and Tconv cells (CD4+EGFP–) to 98% purity on a BD FACSAria. Treg and Tconv cells from Ccl3–/–, OTII, and in some cases, WT mice were sorted on the basis of CD25 and CD45RB expression to a purity of more than 98%. CD4-FITC (RM4-5), CD25-APC (PC61), and CD45RB-PE (16A) were from BD Biosciences. CD8+ T cells from spleen and lymph nodes were enriched to more than 90% purity using the EasySep CD8-Negative Selection Kit (StemCell Technologies).
Isolation and purification of human T cells.
Peripheral blood mononuclear cells (PBMCs) were isolated from healthy adult volunteers, subjects with established (> 6 months from diagnosis) T1D, subjects with new-onset (< 6 months since diagnosis) T1D, subjects with JIA, and pediatric age-matched nondiabetic controls. CD4+ T cells were enriched using EasySep CD4-Negative Selection kit (StemCell Technologies). Tregs were sorted as live CD4+CD25hiCD127lo cells and Tconv cells as live CD4+CD25–CD127hi cells, with a post-sort purity based on FOXP3 expression of more than 90%. CD4 V500 (RPA-T4) and CD25 FITC (M-A251) were from BD Biosciences; CD127 eFluor450 (eBioRDR5), FOXP3 eFluor660/APC (236A/E7), and viability dye eFluor780 were from eBiosciences.
RT-PCR analysis.
Gene expression was measured in real time with a sequence detection system (GeneAmp 7300; Applied Biosystems). Primer sequences were as follows: Ccl3, 5′-CACCACTGCCCTTGCTGTTC-3′ (forward) and 5′-GCAAAGGCTGCTGGTTTCAA-3′ (reverse); Ccl4, 5′-TGTGCTCCAGGGTTCTCAGC-3′ (forward) and 5′-CCAGGGCTCACTGGGGTTAG-3′ (reverse); and 18S, 5′-CAAGACGGACCAGAGCGAAA-3′ (forward) and 5′-GGCGGGTCATGGGAATAAC-3′ (reverse). The QuantiTech SYBR Green PCR kit (QIAGEN) was used to quantify mRNA levels. Data are normalized to 18S using the comparative Ct method (ΔΔCt).
Determination of chemokine production.
FACS-sorted mouse Tregs and Tconv cells (1 × 10⁶/ml) were stimulated with plate-bound α-CD3 (10 μg/ml; 2C11) and soluble α-CD28 (2.5 μg/ml; 37.51) in the presence of IL-2 (100 U/ml) for 48 hours in RPMI complete media (RPMI 1640 containing 10% FCS [Invitrogen], penicillin/streptomycin [Invitrogen], GlutaMAX [Invitrogen], HEPES [10 mM; StemCell Technologies], and 2 mercaptoethanol [50 μM; Bio-Rad]). FACS-sorted human Tregs and Tconv cells (1 × 10⁶/ml or 1.4 × 10⁵/ml) were activated with α-CD3/α-CD28–coated beads (Invitrogen) in the presence of recombinant human IL-2 (100 U/ml; Chiron) at a 1:1 cell/bead ratio for 48 hours in complete media (X-Vivo 15 [Cambrex] containing 5% pooled AB human serum [Cambrex], penicillin/streptomycin [Invitrogen], and GlutaMAX [Invitrogen]). Concentrations of CCL3, CCL4 (CCL5 for mouse supernatants only, CXCL8 for pediatric cases only), and IFN-γ in supernatants were determined using a cytometric bead array (CBA) flex set according to the manufacturer’s instructions (BD Biosciences, CXCL8 BioLegend).
Surface and intracellular staining.
Mouse cells were stimulated as above for 72 hours, then restimulated with 50 ng/ml PMA and 1 μg/ml ionomycin (both Sigma–Aldrich) for 6 hours, with brefeldin A (10 μg/ml, Sigma–Aldrich) added 1 to 2 hours after activation. Human sorted Tregs and Tconv cells were stimulated as above for 48 hours in the presence of 10 ng/ml PMA and 500 ng/ml ionomycin and brefeldin A (10 μg/ml, all Sigma-Aldrich) for the last 4 hours of culture. Following fixable viability or surface staining (CD25 [BD, PC61], CD73 [TY/11.8], LAP [TW7-16B4], ICOS [15F9], CD44 [IM7], LAG3 [C9B7W], PD1 [J43, all eBiosciences]), cells were fixed in 4% formaldehyde and permeabilized with 0.5% saponin. Mouse Tregs and Tconv cells were stained with antibodies against CCL3 (R&D, 39624), IFN-γ (eBioscience, XMG1.2), CTLA4 (UC10-4B9), Helios (both BioLegend, 22F6), and IL-10 (BD, JES5-16E3). Human Tregs and Tconv cells were stained with antibodies against CCL3 (R&D, 93342), CCL4 (R&D, 24006), and IFN-γ (eBioscience, 4S.B3). Live single-cell events were acquired on a BD FACSCanto or LSR II and analyzed with FlowJo 10.0.7 or 8.7 (TreeStar) for division index analysis.
CCL3 and CCL4 promoter luciferase assay.
The promoters for CCL3 (region –1244 to +72; 1316 bp) and CCL4 (region –1420 to +273; 1693 bp) were amplified from human genomic DNA and cloned into pGL3. Jurkat cells were transiently transfected as described (45) with pGL3, pGL3-CCL3, or pGL3-CCL4 and a renilla luciferase reporter vector (pRL-TK) in the presence or absence of an expression vector encoding human FOXP3a. After 24 hours, cells were stimulated with PMA (10 ng/ml) and Ca2+ ionophore (500 ng/ml) for 6 hours. Luciferase activity was measured using a luminometer (Molecular Devices) and a Dual Luciferase Reporter Assay System (Promega). All values were normalized to renilla luciferase activity and expressed relative to unstimulated controls.
In vitro migration assays.
Supernatants (150 μl) from sorted Tregs and CD4+ Tconv cells, which had been stimulated for 48 hours with plate-bound α-CD3, soluble α-CD28, and IL-2, were added to the lower chamber of a 3-μm membrane filter in a 96-well plate (Millipore). CD4+ or CD8+ T cells from WT, Ccr5–/–, or Ccl3–/– mice were used as migrating cells. Stimulation as above was used to induce maximal CCR5 expression; then 200,000 to 400,000 cells were added to the upper chamber. Competitive migration assays were conducted by placing 200,000 Thy1.2+ WT or Ccl3–/– activated Tregs in the upper chamber with 200,000 stimulated Thy1.1+ CD4+ or CD8+ T cells. CCL3 (clone 39624) and/or CCL4 (clone 46907) neutralizing antibodies (1 mg/ml, R&D) were added to some supernatants/media in the lower chamber with ex vivo CD4+ or CD8+ T cells placed in the top chamber. Following incubation for 3 hours at 37°C, the number of cells that had migrated into the lower chamber was determined using a hemocytometer in triplicate samples or counted with a flow cytometer following labeling with a viability dye and mAbs to Thy1.1 and Thy1.2 to differentiate Tregs from CD4+ or CD8+ T cells.
In vivo migration assays.
See Figure 5, A and C, for schematic diagrams. Tregs (2 × 10⁶) from OTII FOXP3-EGFP reporter mice were FACS sorted and injected into the right and left rear feet of recipient WT B6 mice that were coimmunized in the right rear foot by s.c. injection with alum admixed with either OVA 323–339 (10 μg) and/or CpGs (GCTAGACGTTAGGT and TCAACGTTGA; 20 μg total) or PBS (25). CPD-labeled WT or Ccr5–/– CD8+ T cells were injected i.v. 18 hours later. Forty hours after immunization, the inguinal draining lymph nodes on each leg were isolated and the proportion of CD8+ T cells (gated as CPD+ cells) on each side was analyzed using flow cytometry. Data are expressed as the ratio of CPD-CD8+ T cell content in the right draining lymph node (CpG and OVA 323–339 stimulated T cells) to that in the contralateral left draining lymph node (CpG-stimulated, but not Ag-stimulated, T cells).
To test the function of Ccl3–/– Tregs, we established a model where sorted Tregs and Tconv cells were prestimulated in vitro for 48 hours with plate-bound α-CD3 (10 μg/ml), soluble α-CD28 (2.5 μg/ml), and IL-2 (100 U/ml) prior to injection of 1 × 10⁶ live cells into the right foot pad. CPD-labeled WT or Ccr5–/– CD8+ or CD4+ T cells were injected i.v. 2 hours later. Forty hours later, the inguinal draining lymph nodes in each leg were isolated and the ratios of CPD+CD8+ or CPD+CD4+ T cells on the right versus left side were calculated as above. A schematic showing Tregs and labeled CD8+ T cells is shown in Figure 5C.
Induction and clinical evaluation of MOG35-55–induced EAE.
Female 6- to 8-week-old Thy1.1+ WT B6 mice were immunized s.c. with 4 mg of Mycobacterium tuberculosis H37Ra (Difco) and 250 μg of MOG35–55 distributed over 2 spots in the lower flank. In addition, each mouse received 200 ng of pertussis toxin in 200 μl of PBS i.p. on days 0 and 1 after immunization. For adoptive transfer, 1.5 × 10⁶ CD4+CD45RBloFOXP3hi Tregs from Thy1.2+ WT or Ccl3–/– mice were injected i.v. on day –2 as described (26). Individual animals were observed daily, and clinical scores were assessed in a blind manner on a scale of 0 to 5 as follows: 0 = no abnormality; 1 = limp tail; 2 = limp tail and hind limb weakness; 3 hind limb paralysis; 4 = hind limb paralysis and forelimb weakness; and 5 = moribund. Data are reported as the mean daily clinical score. Upon sacrifice, mice were perfused with 30 ml of cold PBS after removal of the spleen. Brain and spinal cord were homogenized through a 70-μm filter. Immune cells were harvested on a 30%/40%/75% Percoll gradient by centrifugation, and residual red blood cells were lysed by hypotonic solution. Cells were washed once in PBS and labeled with antibodies against CD4 (RM4-5), CD8 (53-7.6), Thy1.1 (HIS51), and viability dye from eBioscience. The number of CNS-infiltrating Thy1.1+ CD4+ T cells was calculated based on the total number of cells and the percentage CD4+ T cells in the viable cell gate.
Islet transplantation.
Pancreatic islets were isolated from 8- to 10-week-old male BALB/c mice as described (46). Three hundred hand-picked islets were transplanted under the kidney capsule of WT B6 recipients that had previously been made diabetic (blood glucose > 20 mmol/l) with streptozocin. Some mice also received 1 × 10⁶ CD4+CD45RBloFoxp3hi Tregs from B6 WT or Ccl3–/– mice, injected in 200 μl of PBS i.v. on the same day as the islet transplantation. Islet grafts were considered rejected if blood glucose was greater than 20 mmol/l on 2 consecutive measurements.
Statistics.
All analyses for statistically significant differences between 2 groups were performed with 1-tailed paired Student’s t test or Mann-Whitney test, unless otherwise indicated; and for comparison between more than 2 groups, 1-way or 2-way ANOVA with Bonferroni’s post-hoc test was used, as indicated. Graft survival differences were assessed by Kaplan-Meier survival analysis using GraphPad Prism software. P values of less than 0.05 were considered significant. Pediatric data were subjected to an outlier test (ROUT) with Q = 1% prior to statistical analysis. All error bars represent SEM unless otherwise indicated.
Study approval.
Animal research was approved by the University of British Columbia Animal Care Committee. Human research was approved by the University of British Columbia Clinical Research Ethics Board. All participants or their guardians gave written informed consent and age-appropriate assent.
Author contributions
SJP, AMP, AYW, JG, and MM designed and performed experiments and analyzed data. TJK and CBV contributed to experimental design and data interpretation. RT, CP, and KM organized the recruitment, consent, and blood collection from subjects with T1D and JIA as well as healthy pediatric controls. SJP, AMP, and MKL wrote the manuscript, which was critically reviewed by MM, RT, TJK, CP, and CBV. MKL conceived of and directed the research, analyzed data, and had overall oversight over the manuscript.
Supplementary Material
Acknowledgments
This work was supported by grants from the Canadian Institutes for Health Research (CIHR) (MOP-115199 to M.K. Levings and IIN-84038 to R. Tan and C. Panagiotopoulos), the Child and Family Research Institute (to A.M. Pesenacker and K. Morishita), and the JDRF (1-2011-550 to C.B. Verchere). S.J. Patterson holds a Crohn’s Colitis Canada/Canadian Association of Gastroenterology/CIHR post-doctoral fellowship, A.Y. Wang holds a CIHR doctoral award, and A.M. Pesenacker holds fellowships from the CIHR Training Program in Transplantation, a 4 What Matters Foundation fellowship, and a JDRF postdoctoral fellowship. C. Panagiotopoulos received Clinician Scientist Salary Awards from the Child & Family Research Institute and the Canadian Diabetes Association. M.K. Levings received a Scientist Salary Award from the Child & Family Research Institute. We are grateful to NetCAD at Canadian Blood Services for their support in collecting blood from healthy adults. We thank Lixin Xu for flow cytometry support, Huilian Qin and the CFRI Biobank for support in processing samples from T1D subjects and pediatric controls, and Susan Farrell for subject recruitment. We thank David Cabral and Lori Tucker for support in establishing a JIA cohort, Felice Mizan for JIA subject recruitment, and Derek Dai and Mitsu Komba for technical support with islet transplantation. We thank Paul Orban for discussions and critical reading of the manuscript.
Footnotes
Conflict of interest: The authors have declared that no conflict of interest exists.
Reference information:J Clin Invest. 2016;126(3):1039–1051. doi:10.1172/JCI83987.
Contributor Information
Jana Gillies, Email: jana.gillies@ubc.ca.
Majid Mojibian, Email: mojibian@mail.ubc.ca.
Rusung Tan, Email: roo@mail.ubc.ca.
C. Bruce Verchere, Email: bverchere@cfri.ca.
Constadina Panagiotopoulos, Email: dpanagiotopoulos@cw.bc.ca.
References
- 1.Josefowicz SZ, Lu LF, Rudensky AY. Regulatory T cells: mechanisms of differentiation and function. Annu Rev Immunol. 2012;30:531–564. doi: 10.1146/annurev.immunol.25.022106.141623. [DOI] [PMC free article] [PubMed] [Google Scholar]
- 2.Miska J, et al. Real-time immune cell interactions in target tissue during autoimmune-induced damage and graft tolerance. J Exp Med. 2014;211(3):441–456. doi: 10.1084/jem.20130785. [DOI] [PMC free article] [PubMed] [Google Scholar]
- 3.Tang Q, et al. Visualizing regulatory T cell control of autoimmune responses in nonobese diabetic mice. Nat Immunol. 2006;7(1):83–92. doi: 10.1038/ni1289. [DOI] [PMC free article] [PubMed] [Google Scholar]
- 4.Thauland TJ, Koguchi Y, Dustin ML, Parker DC. CD28-CD80 interactions control regulatory T cell motility and immunological synapse formation. J Immunol. 2014;193(12):5894–5903. doi: 10.4049/jimmunol.1401752. [DOI] [PMC free article] [PubMed] [Google Scholar]
- 5.Ding Y, Xu J, Bromberg JS. Regulatory T cell migration during an immune response. Trends Immunol. 2012;33(4):174–180. doi: 10.1016/j.it.2012.01.002. [DOI] [PMC free article] [PubMed] [Google Scholar]
- 6.Huehn J, Hamann A. Homing to suppress: address codes for Treg migration. Trends Immunol. 2005;26(12):632–636. doi: 10.1016/j.it.2005.10.001. [DOI] [PubMed] [Google Scholar]
- 7.MacDonald KG, Orban PC, Levings MK. T regulatory cell therapy in transplantation: stability, localization and functional specialization. Curr Opin Organ Transplant. 2012;17(4):343–348. doi: 10.1097/MOT.0b013e328355aaaf. [DOI] [PubMed] [Google Scholar]
- 8.Wei S, Kryczek I, Zou W. Regulatory T-cell compartmentalization and trafficking. Blood. 2006;108(2):426–431. doi: 10.1182/blood-2006-01-0177. [DOI] [PMC free article] [PubMed] [Google Scholar]
- 9.Curiel TJ, et al. Specific recruitment of regulatory T cells in ovarian carcinoma fosters immune privilege and predicts reduced survival. Nat Med. 2004;10(9):942–949. doi: 10.1038/nm1093. [DOI] [PubMed] [Google Scholar]
- 10.Sather BD, et al. Altering the distribution of Foxp3(+) regulatory T cells results in tissue-specific inflammatory disease. J Exp Med. 2007;204(6):1335–1347. doi: 10.1084/jem.20070081. [DOI] [PMC free article] [PubMed] [Google Scholar]
- 11.Afshar R, et al. Compartmentalized chemokine-dependent regulatory T-cell inhibition of allergic pulmonary inflammation. J Allergy Clin Immunol. 2013;131(6):1644–1652. doi: 10.1016/j.jaci.2013.03.002. [DOI] [PMC free article] [PubMed] [Google Scholar]
- 12.Ermann J, et al. Only the CD62L+ subpopulation of CD4+CD25+ regulatory T cells protects from lethal acute GVHD. Blood. 2005;105(5):2220–2226. doi: 10.1182/blood-2004-05-2044. [DOI] [PubMed] [Google Scholar]
- 13.Smigiel KS, et al. CCR7 provides localized access to IL-2 and defines homeostatically distinct regulatory T cell subsets. J Exp Med. 2014;211(1):121–136. doi: 10.1084/jem.20131142. [DOI] [PMC free article] [PubMed] [Google Scholar]
- 14.Himmel ME, Crome SQ, Ivison S, Piccirillo C, Steiner TS, Levings MK. Human CD4+ FOXP3+ regulatory T cells produce CXCL8 and recruit neutrophils. Eur J Immunol. 2011;41(2):306–312. doi: 10.1002/eji.201040459. [DOI] [PubMed] [Google Scholar]
- 15.Nguyen KD, Fohner A, Booker JD, Dong C, Krensky AM, Nadeau KC. XCL1 enhances regulatory activities of CD4+ CD25(high) CD127(low/–) T cells in human allergic asthma. J Immunol. 2008;181(8):5386–5395. doi: 10.4049/jimmunol.181.8.5386. [DOI] [PMC free article] [PubMed] [Google Scholar]
- 16.Viola A, Luster AD. Chemokines and their receptors: drug targets in immunity and inflammation. Annu Rev Pharmacol Toxicol. 2008;48:171–197. doi: 10.1146/annurev.pharmtox.48.121806.154841. [DOI] [PubMed] [Google Scholar]
- 17.Rezzonico R, Imbert V, Chicheportiche R, Dayer JM. Ligation of CD11b and CD11c beta(2) integrins by antibodies or soluble CD23 induces macrophage inflammatory protein 1alpha (MIP-1α) and MIP-1beta production in primary human monocytes through a pathway dependent on nuclear factor-kappaB. Blood. 2001;97(10):2932–2940. doi: 10.1182/blood.V97.10.2932. [DOI] [PubMed] [Google Scholar]
- 18.Sadlon TJ, et al. Genome-wide identification of human FOXP3 target genes in natural regulatory T cells. J Immunol. 2010;185(2):1071–1081. doi: 10.4049/jimmunol.1000082. [DOI] [PubMed] [Google Scholar]
- 19.Komatsu N, Mariotti-Ferrandiz ME, Wang Y, Malissen B, Waldmann H, Hori S. Heterogeneity of natural Foxp3+ T cells: a committed regulatory T-cell lineage and an uncommitted minor population retaining plasticity. Proc Natl Acad Sci U S A. 2009;106(6):1903–1908. doi: 10.1073/pnas.0811556106. [DOI] [PMC free article] [PubMed] [Google Scholar]
- 20.Cook DN, et al. Requirement of MIP-1α for an inflammatory response to viral infection. Science. 1995;269(5230):1583–1585. doi: 10.1126/science.7667639. [DOI] [PubMed] [Google Scholar]
- 21.Pham CT, MacIvor DM, Hug BA, Heusel JW, Ley TJ. Long-range disruption of gene expression by a selectable marker cassette. Proc Natl Acad Sci U S A. 1996;93(23):13090–13095. doi: 10.1073/pnas.93.23.13090. [DOI] [PMC free article] [PubMed] [Google Scholar]
- 22.Zlotnik A, Yoshie O, Nomiyama H. The chemokine and chemokine receptor superfamilies and their molecular evolution. Genome Biol. 2006;7(12): doi: 10.1186/gb-2006-7-12-243. [DOI] [PMC free article] [PubMed] [Google Scholar]
- 23.Zlotnik A, Yoshie O. The chemokine superfamily revisited. Immunity. 2012;36(5):705–716. doi: 10.1016/j.immuni.2012.05.008. [DOI] [PMC free article] [PubMed] [Google Scholar]
- 24.Guan E, Wang J, Norcross MA. Identification of human macrophage inflammatory proteins 1α and 1β as a native secreted heterodimer. J Biol Chem. 2001;276(15):12404–12409. doi: 10.1074/jbc.M006327200. [DOI] [PubMed] [Google Scholar]
- 25.Castellino F, Huang AY, Altan-Bonnet G, Stoll S, Scheinecker C, Germain RN. Chemokines enhance immunity by guiding naive CD8+ T cells to sites of CD4+ T cell-dendritic cell interaction. Nature. 2006;440(7086):890–895. doi: 10.1038/nature04651. [DOI] [PubMed] [Google Scholar]
- 26.Kohm AP, Carpentier PA, Anger HA, Miller SD. Cutting edge: CD4+CD25+ regulatory T cells suppress antigen-specific autoreactive immune responses and central nervous system inflammation during active experimental autoimmune encephalomyelitis. J Immunol. 2002;169(9):4712–4716. doi: 10.4049/jimmunol.169.9.4712. [DOI] [PubMed] [Google Scholar]
- 27.O’Connor RA, Anderton SM. Foxp3+ regulatory T cells in the control of experimental CNS autoimmune disease. J Neuroimmunol. 2008;193(1–2):1–11. doi: 10.1016/j.jneuroim.2007.11.016. [DOI] [PubMed] [Google Scholar]
- 28.Zhang N, et al. Regulatory T cells sequentially migrate from inflamed tissues to draining lymph nodes to suppress the alloimmune response. Immunity. 2009;30(3):458–469. doi: 10.1016/j.immuni.2008.12.022. [DOI] [PMC free article] [PubMed] [Google Scholar]
- 29.Long SA, Buckner JH. CD4+FOXP3+ T regulatory cells in human autoimmunity: more than a numbers game. J Immunol. 2011;187(5):2061–2066. doi: 10.4049/jimmunol.1003224. [DOI] [PMC free article] [PubMed] [Google Scholar]
- 30.Campbell DJ, Koch MA. Phenotypical and functional specialization of FOXP3+ regulatory T cells. Nat Rev Immunol. 2011;11(2):119–130. doi: 10.1038/nri2916. [DOI] [PMC free article] [PubMed] [Google Scholar]
- 31.Morlacchi S, Dal Secco V, Soldani C, Glaichenhaus N, Viola A, Sarukhan A. Regulatory T cells target chemokine secretion by dendritic cells independently of their capacity to regulate T cell proliferation. J Immunol. 2011;186(12):6807–6814. doi: 10.4049/jimmunol.1003265. [DOI] [PubMed] [Google Scholar]
- 32.Crome SQ, et al. Inflammatory effects of ex vivo human Th17 cells are suppressed by regulatory T cells. J Immunol. 2010;185(6):3199–3208. doi: 10.4049/jimmunol.1000557. [DOI] [PubMed] [Google Scholar]
- 33.Lee MH, Lee WH, Todorov I, Liu CP. CD4+ CD25+ regulatory T cells prevent type 1 diabetes preceded by dendritic cell-dominant invasive insulitis by affecting chemotaxis and local invasiveness of dendritic cells. J Immunol. 2010;185(4):2493–2501. doi: 10.4049/jimmunol.1001036. [DOI] [PubMed] [Google Scholar]
- 34.Allers K, Schneider T. CCR5Delta32 mutation and HIV infection: basis for curative HIV therapy. Curr Opin Virol. 2015;14:24–29. doi: 10.1016/j.coviro.2015.06.007. [DOI] [PubMed] [Google Scholar]
- 35.Barmania F, Potgieter M, Pepper MS. Mutations in C-C chemokine receptor type 5 (CCR5) in South African individuals. Int J Infect Dis. 2013;17(12):e1148–1153. doi: 10.1016/j.ijid.2013.06.009. [DOI] [PubMed] [Google Scholar]
- 36.Hugues S, et al. Dynamic imaging of chemokine-dependent CD8+ T cell help for CD8+ T cell responses. Nat Immunol. 2007;8(9):921–930. doi: 10.1038/ni1495. [DOI] [PubMed] [Google Scholar]
- 37.Kohlmeier JE, et al. The chemokine receptor CCR5 plays a key role in the early memory CD8+ T cell response to respiratory virus infections. Immunity. 2008;29(1):101–113. doi: 10.1016/j.immuni.2008.05.011. [DOI] [PMC free article] [PubMed] [Google Scholar]
- 38.Thornton AM, Donovan EE, Piccirillo CA, Shevach EM. Cutting edge: IL-2 is critically required for the in vitro activation of CD4+CD25+ T cell suppressor function. J Immunol. 2004;172(11):6519–6523. doi: 10.4049/jimmunol.172.11.6519. [DOI] [PubMed] [Google Scholar]
- 39.Liu Z, Gerner MY, Van Panhuys N, Levine AG, Rudensky AY, Germain RN. Immune homeostasis enforced by co-localized effector and regulatory T cells. Nature. 2015;528(7581):225–230. doi: 10.1038/nature16169. [DOI] [PMC free article] [PubMed] [Google Scholar]
- 40.McMurchy AN, Bushell A, Levings MK, Wood KJ. Moving to tolerance: clinical application of T regulatory cells. Semin Immunol. 2011;23(4):304–313. doi: 10.1016/j.smim.2011.04.001. [DOI] [PMC free article] [PubMed] [Google Scholar]
- 41.Long SA, et al. Defects in IL-2R signaling contribute to diminished maintenance of FOXP3 expression in CD4(+)CD25(+) regulatory T-cells of type 1 diabetic subjects. Diabetes. 2010;59(2):407–415. doi: 10.2337/db09-0694. [DOI] [PMC free article] [PubMed] [Google Scholar]
- 42.MacIver NJ, Michalek RD, Rathmell JC. Metabolic regulation of T lymphocytes. Annu Rev Immunol. 2013;31:259–283. doi: 10.1146/annurev-immunol-032712-095956. [DOI] [PMC free article] [PubMed] [Google Scholar]
- 43.Pesenacker AM, Wedderburn LR. T regulatory cells in childhood arthritis — novel insights. Expert Rev Mol Med. 2013;15: doi: 10.1017/erm.2013.14. [DOI] [PubMed] [Google Scholar]
- 44.Pesenacker AM, Broady R, Levings MK. Control of tissue-localized immune responses by human regulatory T cells. Eur J Immunol. 2015;45(2):333–343. doi: 10.1002/eji.201344205. [DOI] [PubMed] [Google Scholar]
- 45.Bacchetta R, et al. Defective regulatory and effector T cell functions in patients with FOXP3 mutations. J Clin Invest. 2006;116(6):1713–1722. doi: 10.1172/JCI25112. [DOI] [PMC free article] [PubMed] [Google Scholar]
- 46.Hutton MJ, Westwell-Roper C, Soukhatcheva G, Plesner A, Dutz JP, Verchere CB. Islet allograft rejection is independent of toll-like receptor signaling in mice. Transplantation. 2009;88(9):1075–1080. doi: 10.1097/TP.0b013e3181bd3fe2. [DOI] [PubMed] [Google Scholar]
Associated Data
This section collects any data citations, data availability statements, or supplementary materials included in this article.