

Abstract
The glucagon-like peptide 1 (GLP-1) receptor is a class B G protein-coupled receptor (GPCR) that is a key target for treatments for type II diabetes and obesity. This receptor, like other class B GPCRs, displays biased agonism, though the physiologic significance of this is yet to be elucidated. Previous work has implicated R2.60190, N3.43240, Q7.49394, and H6.52363 as key residues involved in peptide-mediated biased agonism, with R2.60190, N3.43240, and Q7.49394 predicted to form a polar interaction network. In this study, we used novel insight gained from recent crystal structures of the transmembrane domains of the glucagon and corticotropin releasing factor 1 (CRF1) receptors to develop improved models of the GLP-1 receptor that predict additional key molecular interactions with these amino acids. We have introduced E6.53364A, N3.43240Q, Q7.49394N, and N3.43240Q/Q7.49394N mutations to probe the role of predicted H-bonding and charge-charge interactions in driving cAMP, calcium, or extracellular signal-regulated kinase (ERK) signaling. A polar interaction between E6.53364 and R2.60190 was predicted to be important for GLP-1- and exendin-4-, but not oxyntomodulin-mediated cAMP formation and also ERK1/2 phosphorylation. In contrast, Q7.49394, but not R2.60190/E6.53364 was critical for calcium mobilization for all three peptides. Mutation of N3.43240 and Q7.49394 had differential effects on individual peptides, providing evidence for molecular differences in activation transition. Collectively, this work expands our understanding of peptide-mediated signaling from the GLP-1 receptor and the key role that the central polar network plays in these events.
Introduction
Glucagon-like peptide 1 (GLP-1), a key incretin hormone controlling insulin secretion in response to meal ingestion, has a broad range of actions potentially beneficial for treatment of type II diabetes and obesity. These include promotion of insulin synthesis and release, decreased glucagon production, preservation of pancreatic β-cell mass, decreased appetite and gastric empyting, and preservation and promotion of cardiac function [reviewed in Baggio and Drucker (2007); Koole et al. (2013); Pabreja et al. (2014)]. GLP-1 acts via the GLP-1 receptor, a class B peptide hormone G protein-coupled receptor (GPCR). This class includes receptors for many important peptides, including parathyroid hormone, secretin, calcitonin, amylin, vasoactive intestinal polypeptide, corticotropin-releasing hormone (CRF), gastric inhibitory peptide, glucagon, as well as the glucagon-like peptides (Hollenstein et al., 2014). As such, understanding how these peptides bind to and activate their cognate receptors is critical to understanding their action and to unlocking the therapeutic potential of targeting this receptor class.
The revolution in membrane protein crystallography and GPCR structural biology has generated novel insight into our understanding of the structural basis for receptor activation, including the importance of structural waters and polar hydrogen bond networks for propagation of the conformational rearrangements required for receptor activation and coupling of the receptor to effector proteins (Caltabiano et al., 2013; Katritch et al., 2014). Many of these key networks are conserved within subfamilies of class A GPCRs (Venkatakrishnan et al., 2013). It is also increasingly recognized that individual ligands acting at the same GPCR can elicit distinct profiles of signaling and regulation, a phenomenon termed biased agonism (Shonberg et al., 2014). At a molecular level this occurs through the distinct interactions that individual ligands make with their target receptor and the potential for these interactions to stabilize distinct conformational ensembles that in turn favor differential interaction with effector proteins (Shonberg et al., 2014). How these distinct interactions drive conformational propagation is still poorly understood, but it may involve selective recruitment of structurally important interaction networks.
Less is understood about the activation of class B peptide GPCRs as they do not contain the key conserved amino acids that are signatures of class A receptors and critical for their function. Nonetheless, class B GPCRs have their own unique set of conserved, intramembranous, polar residues that are likely comparable to those in class A. Prototypical of this receptor class is the GLP-1 receptor that displays pleiotropic coupling and both peptide- and nonpeptidic-biased agonism (Jorgensen et al., 2007; Coopman et al., 2010; Koole et al., 2010; Cheong et al., 2012; Willard et al., 2012; Wootten et al., 2013a; Weston et al., 2014). Recently, the role of the conserved intramembranous polar residues in this receptor was probed by alanine scanning mutagenesis, which revealed clusters of amino acids important for a range of functions, including protein expression and the control of activation transition for both general signal pathway bias and ligand-directed biased signaling (Wootten et al., 2013b). A key network for differential effects on peptide-mediated signaling for GLP-1, exendin-4, and oxyntomodulin was identified and shown to involve R2.60190, N3.43240, H6.52363, and Q7.49394 [Wootten et al. (2013a); numbering scheme: amino acid numbers are shown in superscript]. Using an early model of the GLP-1 receptor, it was predicted that the R2.60190 coordinated interactions with Asn and Gln and that these interactions were differentially important for signaling via the individual peptides. Nonetheless, double mutation of Asn3.43240 and Gln7.49394 did not fully recapitulate the phenotype of the Arg2.60190 mutation (Wootten et al., 2013b), suggesting that the model was insufficient to fully explain the differential effects on signaling.
Recently, transmembrane crystal structures of the glucagon and corticotropin-releasing factor 1 (CRF1) receptors were solved (Hollenstein et al., 2013; Siu et al., 2013). These revealed that the class B GPCRs have distinct arrangements of the transmembrane bundle compared with class A GPCRs, leading to a large, solvent exposed, V-shaped extracellular-facing cavity that is likely critical for peptide-mediated receptor activation. These distinctions contribute to the historic difficulty in modeling class B receptors. The new structural data revealed that our original GLP-1 receptor model used to interpret data on polar residue mutants was inaccurate, although the predicted interactions between R2.60, N3.43240, and Q7.49394 were maintained.
To gain further insight into the role of the predicted network, we have generated new GLP-1 receptor models on the basis of available crystal structures and performed additional mutagenesis to probe the nature and importance of this network for peptide-mediated activation of key signaling pathways.
Materials and Methods
Materials.
Dulbecco’s modified Eagle’s medium, hygromycin B, and Fluo-4 acetoxymethyl ester were purchased from Invitrogen (Carlsbad, CA). Fetal bovine serum (FBS) was purchased from Thermo Fisher Scientific (Melbourne, Australia). The QuikChange site-directed mutagenesis kit was purchased from Stratagene (La Jolla, CA). AlphaScreen reagents, Bolton-Hunter reagent [125I], and 384-well ProxiPlates were purchased from PerkinElmer Life and Analytical Sciences (Waltham, MA). SureFire phosphorylated extracellular signal-regulated kinase 1 and 2 (pERK1/2) reagents were generously supplied by TGR Biosciences (Adelaide, Australia). SigmaFast o-phenylenediamine dihydrochloride tablets and antibodies were purchased from Sigma-Aldrich (St. Louis, MO). GLP-1 peptides were purchased from American Peptide (Sunnyvale, CA). All other reagents were purchased from Sigma-Aldrich or BDH Merck (Melbourne, Australia) and were of an analytical grade.
Receptor Mutagenesis.
The desired mutations were introduced to an N-terminally double c-myc-labeled wild-type human GLP-1 receptor (GLP-1 receptor) in the pEF5/FRT/V5-DEST destination vector (Invitrogen/ThermoFisher Scientific, Waltham, MA); this receptor is pharmacology equivalent to the untagged human GLP-1 receptor (data not shown). Mutagenesis was carried out using oligonucleotides for site-directed mutagenesis purchased from GeneWorks (Thebarton, SA, Australia) and the QuikChange site-directed mutagenesis kit (Stratagene, La Jolla, CA), and confirmed by automated sequencing.
Transfections and Cell Culture.
Wild-type and mutant human GLP-1 receptor were isogenically integrated into FlpIn-Chinese hamster ovary (FlpIn-CHO) cells (Invitrogen), and selection of receptor-expressing cells accomplished by treatment with 600 μg/ml of hygromycin B. Transfected and parental FlpIn-CHO cells were maintained in Dulbecco’s modified Eagle’s medium supplemented with 10% (v/v) heat-inactivated FBS and incubated in a humidified environment at 37°C in 5% CO2. Whenever a new series of mutant receptors is generated and used for generation of stable cell lines, the cells used for the specific set of transfections are used to generate a new wild-type receptor control, to account for any drift in cell background with change of passage. Experiments on mutant receptors are run in parallel with these controls. Where data from wild-types from different series of experiments was equivalent, these data were pooled.
Radioligand Binding Assay.
FlpIn-CHO wild-type and mutant human GLP-1 receptor cells were seeded at a density of 3 × 10⁴ cells per well into 96-well culture plates and incubated overnight at 37°C in 5% CO2, and radioligand binding carried out as previously described (Koole et al., 2011). For each cell line in all experiments, total binding was defined by ∼0.05 nM [125I]exendin(9–39) alone, and nonspecific binding was determined in the presence of 1 μM exendin(9–39). For analysis, data are normalized to the specific binding for each individual experiment.
cAMP Accumulation Assay.
FlpIn-CHO wild-type and mutant human GLP-1 receptor cells were seeded at a density of 3 × 10⁴ cells per well into 96-well culture plates and incubated overnight at 37°C in 5% CO2, and cAMP detection was carried out as previously described (Koole et al., 2010). All values were converted to concentration of cAMP using a cAMP standard curve performed in parallel, and data were subsequently normalized to the response of 100 μM forskolin in each cell line.
pERK1/2 Assay.
FlpIn-CHO wild-type and mutant human GLP-1 receptor cells were seeded at a density of 3 × 10⁴ cells per well into 96-well culture plates and incubated overnight at 37°C in 5% CO2. Receptor-mediated pERK1/2 was determined using the AlphaScreen pERK1/2 SureFire protocol as previously described (Koole et al., 2010). Initial pERK1/2 time-course experiments were performed over 1 hour to determine the time at which agonist-mediated pERK1/2 was maximal. Subsequent experiments were then performed at the time required to generate a maximal pERK1/2 response (6 minutes). Data were normalized to the maximal response elicited by 10% (v/v) FBS in each cell line, determined at 6 minutes (peak FBS response).
Intracellular Ca2+ Mobilization Assay.
FlpIn-CHO wild-type and mutant human GLP-1 receptor cells were seeded at a density of 3 × 10⁴ cells per well into 96-well culture plates and incubated overnight at 37°C in 5% CO2, and receptor-mediated intracellular Ca2+ (iCa2+) mobilization was determined as previously described (Koole et al., 2010). Fluorescence was determined immediately after peptide addition, with an excitation wavelength set to 485 nm and an emission wavelength set to 520 nm, and readings were taken every 1.36 seconds for 120 seconds. Peak magnitude was calculated using five-point smoothing, followed by correction against basal fluorescence. The peak value was used to create concentration-response curves. Data were normalized to the maximal response elicited by 100 μM ATP, and to the wild-type receptor responses.
Cell-Surface Receptor Expression.
FlpIn-CHO wild-type and mutant human GLP-1 receptor cells, with receptor DNA previously incorporated with an N-terminal double c-myc epitope label, were seeded at a density of 25 × 104 cells per well into 24-well culture plates and incubated overnight at 37°C in 5% CO2, washed three times in 1× phosphate buffered saline, and fixed with 3.7% (v/v) paraformaldehyde at 4°C for 15 minutes. Cell-surface receptor detection was then performed as previously described (Koole et al., 2011). Data were normalized to the basal fluorescence detected in FlpIn-CHO parental cells. Specific [125I]exendin(9–39) binding at each receptor mutant, as identification of functional receptors at the cell surface, was also determined [corrected for nonspecific binding using 1 μM exendin(9–39)].
Data Analysis.
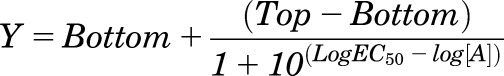
All data were analyzed using Prism 6.0 (GraphPad Software Inc., San Diego, CA). For all analyses the data were unweighted and each y value (mean of replicates for each individual experiment) was considered an individual point. Concentration response signaling data were analyzed using a three-parameter logistic equation as previously described (May et al., 2007):
 |
(1) |
where Bottom represents the y value in the absence of ligand(s), Top represents the maximal stimulation in the presence of ligand(s), [A] is the molar concentration of ligand, and EC50 represents the molar concentration of ligand required to generate a response halfway between Top and Bottom. Similarly, this equation was used in the analysis of inhibition binding data, with IC50 replacing EC50. In that case, Bottom defines the specific binding of the radioligand that is equivalent to nonspecific ligand binding, whereas Top defines radioligand binding in the absence of a competing ligand, and the IC50 value represents the molar concentration of ligand required to generate an effect halfway between Top and Bottom.
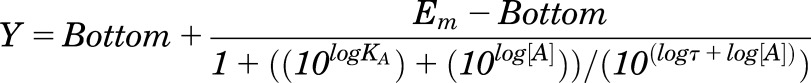
To quantify efficacy in the system, all data were fitted with an operational model of agonism (Black and Leff, 1983):
 |
(2) |
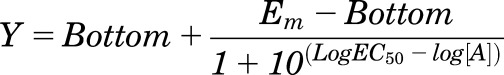
where Em represents the maximal stimulation in the system; KA is the agonist-receptor functional dissociation constant, in molar concentration, that is dependent on the receptor-effector complex driving signaling for an individual pathway (Kenakin et al., 2012; Kenakin and Christopoulos, 2013); τ is the estimated measure of efficacy in the system, which incorporates both signaling efficacy and receptor density; and all other parameters are as defined for eq. (1). Constraints for this model were determined by fitting the most efficacious peptide with the following equation:
 |
(3) |
The value obtained for the system maximum (Em) was then globally constrained in the operational model (eq. 2) when applied at each mutant receptor. All estimated τ values were then corrected to cell-surface expression (τc); Bmax from homologous competition (eq. 4) of 125I-exendin(9-39) binding by unlabeled exendin(9-39) where Bmax is the maximum binding of ligand to receptors, [Hot] is the concentration of 125I-exendin(9-39) in nM, [Cold] is the concentration of unlabeled exendin(9-39) in nM, and Kd is the equilibrium dissociation constant of the ligand in nM, with Bottom as defined in eq. (1). Errors were propagated from both τ and cell-surface expression relative to wild-type receptor.
 |
(4) |
Statistics.
Changes in peptide affinity, potency, efficacy, and cell-surface expression of human GLP-1 receptor mutants in comparison with wild-type human GLP-1 receptor control were statistically analyzed with one-way analysis of variance and Dunnett’s post-test, and significance accepted at p < 0.05.
Molecular Modeling.
The apo GLP-1R model of the transmembrane (TM) domain [Supplemental Data File 1 (.pdb)] was generated from the glucagon X-ray crystal structure (Siu et al., 2013) using the homology modeling and minimization facilities of Protein Local Optimization Program (PLOP) (Jacobson et al., 2004). The full GLP-1-bound GLP-1R used additional templates, namely the X-ray structure of the extracellular domain (ECD) with GLP-1(10-35) bound (Underwood et al., 2010), the CRF1-R X-ray structure (used to model extracellular loop (ECL)1, which is missing in the glucagon structure) (Hollenstein et al., 2013) and the nuclear magnetic resonance (NMR) structure of a conformationally constrained GLP-1(7-17) analog (Hoang et al., 2015) docked to a GLP-1R model (preprimed to bind GLP-1 using Modeler; Eswar et al., 2007) using GLIDE (v6.9) SP peptide and the OPLS 3.0 force field (Friesner et al., 2004; Tubert-Brohman et al., 2013). A 20 × 20 × 20-Å3 inner docking box and a 44 × 44 × 44-Å3 outer docking box centered at the opening of the TM bundle was used; the peptide backbone was held rigid during the docking. GLP-1(7-17)NH2 generated from model 7 from the NMR ensemble (.pdb code 2N0I) using PLOP gave the highest scoring docked pose. Because this analog had similar activity to GLP-1(7-36)NH2 and was conformationally constrained (Hoang et al., 2015), it provided the best currently available model for the conformation of GLP-1. In addition, the X-ray structure of the C-terminal peptide of the G protein alpha subunit (R373-L394) in complex with the intracellular part and TM5 and TM6 of the β2-adrenergic receptor from the X-ray structure of the receptor/G protein complex (Rasmussen et al., 2011) (mutated to its GLP-1R equivalent using Modeler) was used as an additional template to facilitate generation of an active model. The success of the comparative modeling required a reasonable structural overlap between the TM region and the ECD region, and for this reason GLP-1(7-36)NH2 was structurally aligned to GLP-1(10-35) of the ECD complex using VMD (Humphrey et al., 1996) to generate an ECD complex containing GLP-1(7-35). These templates were linked by a global alignment, which was used by Modeler to generate a full GLP-1R model with GLP-1(7-36)NH2 bound. Modeler used 4 p-benzoylphenylalanine (Bpa) photoaffinity crosslinking-derived distance constraints between GLP-1 and GLP-1R (Chen et al., 2009, 2010; Miller et al., 2011) and two sets of constraints derived from reciprocal mutagenesis experiments that resulted in gain of function (Solano et al., 2001; Vertongen et al., 2001; Moon et al., 2015), as shown in Table 1; the effect of these constraints was to provide additional information on the peptide-receptor interaction in the region between the TM and ECD templates. These reciprocal mutagenesis results were essentially the only mutagenesis results used in the generation of the model. Two thousand models were generated by Modeler and the model with the best (lowest) discrete optimized protein energy score was selected. This model was subjected to further refinement of ECL1 using a template derived from the CRF1-R structure and the additional constraints given in (Supplemental Table 1; the final model selected had the best discrete optimized energy score from 5000 models. The structures are available from ftp://ftp.essex.ac.uk/pub/oyster/Wootten_GLP-1R_2015/[username: ftp, password: anonymous; (Supplemental Data File 2 (.pdb)]. Molecular dynamics (MD) simulations were carried out using fully hydrated models in a 1-palmitoyl, 2-oleoyl-sn-glycero-3-phosphocholine (POPC) bilayer using the Acellera ACEMD (Harvey et al., 2009), with parameters taken from the AMBER 14SB force field (Hornak et al., 2006) and the lipid 14 force field (Walker et al., 2014); the apo model for MD was generated by removing the ligand and running for 240 nanoseconds.
TABLE 1.
Major constraints used in Modeler
| GLP-1R Position (A) | GLP-1 Position (B) | Origin for GLP-1R – GLP-1 Constraint | Constrainta (Å) | Reference |
|---|---|---|---|---|
| ECD; E133; Cγ | A24; Cβ | Bpa24 GLP-1 photoaffinity crosslink. | rAB ≤ 9.0 | Chen et al. 2009c |
| TM1; L141;Cδ1 | V16; Cγ1 | Bpa16 GLP-1 photoaffinity crosslink. | rAB ≤ 9.0 | Miller et al. (2011) |
| TM1; Y145;Cξ | F12; Cγ | Bpa12 GLP-1 photoaffinity crosslink. | rAB ≤ 6.0 | Chen et al. (2010) |
| ECL2; W297;Cη2 | L20; Cγ | Bpa20 GLP-1 photoaffinity crosslink. | rAB ≤ 9.0 | Miller et al. (2011) |
| TM2; K197;Nξ | E9; Oε2 | Reciprocal mutagenesis of residues between VIP and VIP-R-1/VIP-R-2 resulting in gain of functionb | rAB ≤ 4.0 | Solano et al. (2001); Vertongen et al. (2001) |
| ECL3; R380;Nη2 | D15; Oε2 | Reciprocal mutagenesis of residues between GLP-1 and GLP-1R resulting in gain of function. | rAB ≤ 4.0 | Moon et al. (2015) |
These distance constraints were estimated from preliminary models that used tyrosine to represent Bpa, since the Oη of the tyrosine is topologically equivalent to the reactive carbon atom of Bpa; a 6-Å constraint was used between the Oη and a suitable point on the target residue.
These residues are conserved between GLP-1R and VPAC-2R. The restraint gives similar results for E9 with K197 and/or R190; if the constraint is used with both residues it can be relaxed to rAB ≤ 5.0 Å or rAB ≤ 6.0 Å.
The potential constraint between Oε1 of E125 and Cα of G35 reported by Chen et al. (2009) (21.5 Å) was not used as the distance in the ECD X-ray structure; this is possibly a constraint to another molecule within an oligomeric array.
Hydration of the glucagon receptor transmembrane domain crystal structure was predicted using the Sample Flood algorithm within the ICM package (Molsoft, San Diego, CA).
Results
In this research, we generated a homology model of the apo form of the GLP-1 receptor transmembrane domain on the basis of the inactive glucagon receptor TM crystal structure. Although marked distinction in the upper regions of the receptor occurred relative to our previously reported model (Wootten et al., 2013b), the key interaction network co-ordinated by R2.60190, predicted in initial modeling, was maintained (Fig. 1, B and E). Nonetheless, there were substantial differences in the position of TM6 with a rotation and an outward translocation of the extracellular end of the helix that contributes to the opening of the extracellular face of the receptor, and also in the positioning of TM5 that is translocated two helical turns toward the intracellular face of the receptor (Fig. 1, A and B). This latter difference positions N5.50320 much deeper into the membrane. The rotation of TM6 moves H6.52363 away from the core of the transmembrane domain bundle and E6.53364 into the core (Fig. 1, A, B, E). Collectively, the new modeling predicts that key residues involved in receptor-mediated signaling bias, both those involved in peptide-mediated bias and those involved globally in altering signaling bias for all peptides (Wootten et al., 2013b), are co-located in the mid-region of the helical bundle (Fig. 1C). This places them at the convergence of the open extracellular vestibule in a key fulcrum position for propagation of conformational rearrangements (Fig. 1, C–E). Residues involved in peptide-mediated bias faced principally toward the core of the bundle, whereas the small polar serines implicated in global changes to signal bias exhibited a more peripheral localization (Fig. 1, C and D).
Fig. 1.

Comparison of original (A) (Wootten et al., 2013b) and new apo homology model of the human GLP-1 receptor (B–E). R2.60190, N3.43240, H6.52363, E6.53364, and Q7.49394 comprise key residues involved in peptide-mediated signaling bias. (A, B) Top down views of the transmembrane bundle and positioning of key amino acids (as x-stick, colored by amino acid side chain). The major differences include opening of the extracellular vestibule, clockwise rotation of TM6, and intracellular offset of TM5 by two helical turns. (C, D) Homology model illustrating the relative positions of R2.60190, N3.43240, H6.52363, E6.53364, and Q7.49394 residues involved in peptide-mediated signaling bias (depicted with red space fill) and S.150155, S2.56186, S7.47392 (blue space fill) small polar residues involved in intramembraneous packing and globally involved in receptor-dependent signal bias. These residues sit in a fulcrum position at the convergence of the helices, with the residues involved in ligand-dependent signal bias located within the core of the receptor. (C) View from the transmembrane face of the receptor. (D) View from the extracellular space. (E) The central polar network depicted as x-stick (colored by amino acid side chain), illustrating predicted H-bonding within the network (colored dotted lines; sphere size is proportional to predicted strength of interaction).
Predicted Interaction Networks
In the revised model, R2.60190 is predicted to form H-bond interactions with E6.53364 and to a lesser extent N3.43240. E6.53364 is also predicted to form H-bond interactions with both H6.52363 and Q7.49394, suggesting that the central core network likely forms interdependent interactions (Fig. 1E); these interactions can also be seen in MD simulations (Supplemental Movie 1), and the stability of the interactions mapped from the MD trajectories (Supplemental Fig. 1).
To gain further insight into the nature of these interactions and their role in controlling peptide-dependent signaling, we generated an additional series of mutations that comprised E6.53364A, N3.43240Q, Q7.49394N, and the double mutant N3.43240Q/Q7.49394N. These mutants were designed to test the importance of the interaction between E6.53364 and R2.60190, and the hydrogen bonding patterns arising from N3.43240 and Q7.49394. The mutants were analyzed for effect on peptide binding and receptor activation of canonical signaling pathways (cAMP accumulation, pERK1/2, and iCa2+ mobilization). Functional data were analyzed using the operational model (Black and Leff, 1983) to calculate effects on efficacy independent of those on affinity. Quantitative data were also generated for the N3.43240A/Q7.49394A double mutant that was qualitatively reported previously (Wootten et al., 2013b).
Effect of Mutation on Receptor Expression and Agonist Peptide Binding.
Consistent with the previous observation of decreased cell-surface expression and affinity for GLP-1, exendin-4, and exendin(9-39) for R2.60190A (Wootten et al., 2013b), the E6.53364A mutant also decreased cell-surface expression and the affinity of these peptides, but not that of oxyntomodulin (Fig. 2, Table 2). Cell-surface receptor expression was not significantly affected by Q7.49394N, and only a small decrease (∼20%) in Bmax was seen with the N3.43240Q or N3.43240Q/Q7.49394N mutants (Fig. 2, E and F). Oxyntomodulin affinity was not altered by any of these mutants (Fig. 2C, Table 2). Neither the Q7.49394N nor the N3.43240Q mutants significantly altered affinity for any of the peptides, whereas the N3.43240Q/Q7.49394N double mutant significantly decreased exendin-4 and exendin(9-39) affinity but not that of GLP-1 (Fig. 2, A–D; Table 2).
Fig. 2.

Effect of mutation of the central polar network on peptide binding and cell-surface receptor expression. (A–D) Inhibition of [125I]exendin(9-39) binding by agonist and antagonist peptides at the wild-type and new mutant receptors. For clarity, only data from new mutants, or those not quantified previously, are displayed. (E) Cell-surface expression of mutant receptors (normalized to that of the wild-type receptor) as measured by anti-c-myc antibody binding to the N-terminal c-myc epitope in an enzyme-linked immunosorbent assay. (F) Cell-surface expression of mutant receptors (normalized to that of the wild-type receptor) determined as Bmax from homologous competition of [125I]exendin(9-39) binding by unlabeled exendin(9-39). Data are displayed as mean + S.E.M. of four to seven independent experiments, conducted in duplicate. *Significantly different from wild-type receptor at P < 0.05, ANOVA with Dunnett’s post-test. V, vehicle. Data for expression of the previously published R2.60190A, N3.43240A, Q7.49394A, and H6.52363 receptor mutants (Wootten et al., 2013b) are included for comparison.
TABLE 2.
Effects of human GLP-1 receptor mutation on peptide ligand binding and cell-surface expression
Binding data were analyzed using a three-parameter logistic equation as defined in eq. (1) to obtain pIC50 values. Data were normalized to maximum 125I-exendin(9-39) binding in the absence of ligand, with nonspecific binding measured in the presence of 1-μM exendin(9-39). Cell-surface expression (Bmax) was determined through homologous competition binding with [125I]exendin(9-39), and data are expressed as a maximum of specific [125I]exendin(9-39) binding at the wild-type human GLP-1R. All values are expressed as mean ± S.E.M. of three to seven independent experiments, conducted in duplicate. Data were analyzed with one-way analysis of variance and Dunnett’s post-test.
| Binding (pIC50) |
Cell-Surface Expression ELISA (% Wild-Type) | Cell-Surface Expression (Bmax) (% Wild-Type) | ||||
|---|---|---|---|---|---|---|
| GLP-1 (7-36)NH2 | Exendin-4 | Oxyntomodulin | Exendin(9-39) | |||
| Wild-Typea | 8.7 ± 0.1 | 9.0 ± 0.0 | 7.3 ± 0.1 | 8.1 ± 0.1 | 100 ± 1 | 100 ± 3 |
| R2.60190Aa | 7.4 ± 0.1* | 7.3 ± 0.1* | 7.6 ± 0.2 | 7.6 ± 0.1* | 53 ± 3* | 44 ± 2* |
| N3.43240Aa | 8.2 ± 0.1* | 8.7 ± 0.1 | 7.4 ± 0.1 | 8.3 ± 0.1 | 86 ± 3 | 92 ± 2 |
| Q7.49394Aa | 8.6 ± 0.1 | 8.8 ± 0.1 | 7.3 ± 0.2 | 8.2 ± 0.1 | 103 ± 3 | 111 ± 2 |
| N3.43240A/Q7.49394A | 8.0 ± 0.1* | 8.1 ± 0.1* | 7.4 ± 0.1 | 8.0 ± 0.1 | 65 ± 4* | 71 ± 4* |
| N3.43240Q | 8.3 ± 0.1 | 8.8 ± 0.1 | 7.6 ± 0.1 | 8.3 ± 0.1 | 84 ± 6 | 80 ± 7* |
| Q7.49394N | 8.7 ± 0.1 | 8.8 ± 0.1 | 7.4 ± 0.1 | 8.2 ± 0.1 | 98 ± 7 | 93 ± 5 |
| N3.43240Q/Q7.49394N | 8.4 ± 0.1 | 8.6 ± 0.1* | 7.3 ± 0.0 | 7.7 ± 0.1* | 88 ± 10 | 80 ± 7* |
| E6.53364A | 7.3 ± 0.1* | 7.5 ± 0.1* | 7.1 ± 0.2 | 7.5 ± 0.1* | 41 ± 4* | 51 ± 6* |
| H6.52363Aa | 7.3 ± 0.1* | 7.5 ± 0.1* | 6.5 ± 0.1* | 7.4 ± 0.1* | 59 ± 4* | 53 ± 2* |
Statistically significant at p < 0.05, one-way analysis of variance and Dunnett’s post-test in comparison with wild-type control. For easy comparison between effects of different ligands and mutants, these are also highlighted in bold.
Data obtained from Wootten et al. (2013a).
Effect of Mutation on cAMP Production.
Only the E6.53364A mutant significantly attenuated cAMP signaling by exendin-4 and this is consistent with the loss of signaling seen previously with the R2.60190 mutant (Fig. 3, E and H; Table 3).
Fig. 3.

Effect of mutation of the central polar network on peptide-mediated cAMP production. Upper panels (A–C) illustrate concentration-response curves for each of the peptides at the wild-type and mutant receptors with data fitted to the operational model. For clarity, only data from new mutants, or those not quantified previously, are displayed. Middle panels (D–F) illustrate affinity-independent measures of efficacy (Log tau) determined by operational modeling of the data, corrected for receptor Bmax at the cell surface: (A, D) GLP-1-mediated responses, (B, E) exendin-4-mediated responses, (C, F) oxyntomodulin-mediated responses. Data are displayed as mean ± S.E.M. of four to six independent experiments, conducted in duplicate. *Significantly different from wild-type receptor at P < 0.05, analysis of variance with Dunnett’s post-test. V, vehicle. Data for expression of the previously published R2.60190A, N3.43240A, Q7.49394A, and H6.52363 receptor mutants (Wootten et al., 2013b) is included for comparison. (G–I) Molecular models (x-stick format) illustrating the predicted central interaction network and their impact on peptide-mediated cAMP formation: (G) GLP-1, (H) exendin-4, (I) oxyntomodulin. Amino acids negatively impacted by mutation are colored red, those positively impacted in green, while those unaffected are colored by side-chain as in Fig. 1E. Predicted H-bonds are displayed as dotted lines.
TABLE 3.
Effects of human GLP-1 receptor mutation on agonist signaling
All mutants were analyzed with an operational model of agonism (eq. 2) to determine logτ values. All logτ values were then corrected to Bmax values determined from homologous competition binding between [125I]exendin(9-39) and unlabeled exendin(9-39) (logτc). Values are expressed as mean ± S.E.M. of four to six independent experiments, conducted in duplicate. Data were analyzed with one-way analysis of variance and Dunnett’s post-test.
| cAMP Accumulation (Logτc) |
pERK1/2 (Logτc) |
iCa2+ Mobilization (Logτc) |
|||||||
|---|---|---|---|---|---|---|---|---|---|
| GLP-1 (7-36)NH2 | Exendin-4 | Oxynto- modulin | GLP-1 (7-36)NH2 | Exendin-4 | Oxynto- modulin | GLP-1 (7-36)NH2 | Exendin-4 | Oxynto-modulin | |
| Wild-type | 1.22 ± 0.11 | 1.33 ± 0.11 | 0.92 ± 0.16 | −0.08 ± 0.03 | −0.09 ± 0.03 | −0.07 ± 0.03 | −0.30 ± 0.00 | −0.31 ± 0.03 | −0.31 ± 0.02 |
| R2.60190Aa | 0.53 ± 0.07* | 0.80 ± 0.08* | 1.56 ± 0.09* | –0.39 ± 0.08* | 0.51 ± 0.12* | 0.03 ± 0.07 | −0.66 ± 0.16 | −0.72 ± 0.11 | 0.11 ± 0.05* |
| N3.43240Aa | 0.55 ± 0.12* | 1.46 ± 0.15 | 0.89 ± 0.10 | 0.01 ± 0.04 | 0.19 ± 0.05* | 0.04 ± 0.02 | −0.76 ± 0.16 | –0.96 ± 0.10* | −0.29 ± 0.04 |
| Q7.49394Aa | 0.86 ± 0.11 | 1.16 ± 0.15 | 0.41 ± 0.05* | –0.54 ± 0.05* | −0.29 ± 0.05 | −0.20 ± 0.01 | –1.12 ± 0.13* | –1.13 ± 0.34* | N.D. |
| N3.43240A/Q7.49394A | 0.52 ± 0.12* | 1.07 ± 0.11 | 0.71 ± 0.12 | –0.56 ± 0.04* | –0.43 ± 0.07* | −0.09 ± 0.03 | –1.11 ± 0.19* | N.D. | N.D. |
| N3.43240Q | 1.09 ± 0.13 | 1.15 ± 0.17 | 0.74 ± 0.07 | −0.09 ± 0.04 | −0.05 ± 0.03 | −0.27 ± 0.04 | –0.80 ± 0.05* | −0.71 ± 0.10 | N.D. |
| Q7.49394N | 0.91 ± 0.14 | 1.30 ± 0.13 | 0.45 ± 0.09* | −0.09 ± 0.04 | −0.05 ± 0.03 | −0.10 ± 0.03 | −0.70 ± 0.04 | −0.67 ± 0.03 | –0.59 ± 0.07* |
| N3.43240Q/Q7.49394N | 0.75 ± 0.16 | 0.87 ± 0.15 | 0.44 ± 0.10* | −0.06 ± 0.04 | −0.00 ± 0.03 | –0.44 ± 0.06* | –1.15 ± 0.10* | –1.00 ± 0.14* | N.D. |
| E6.53364A | 0.56 ± 0.07* | 0.85 ± 0.06* | 1.10 ± 0.06 | −0.35 ± 0.08 | −0.37 ± 0.09 | −0.11 ± 0.07 | −0.38 ± 0.13 | −0.68 ± 0.04 | 0.04 ± 0.05 |
| H6.52363Aa | –0.51 ± 0.11* | –0.31 ± 0.06* | –0.26 ± 0.06* | –0.81 ± 0.15* | –0.67 ± 0.07* | −0.19 ± 0.08 | –1.09 ± 0.13* | –1.33 ± 0.22* | −0.23 ± 0.27 |
N.D., no data.
Statistically significant at p < 0.05, one-way analysis of variance and Dunnett’s post-test in comparison with wild-type control. For easy comparison between effects of different ligands and mutants, these are also highlighted in bold.
Data obtained from Wootten et al. (2013a).
The E6.53364A mutation also reduced GLP-1 efficacy, but this peptide was more broadly affected by mutation of other amino acids in the network (Fig. 3, A, D, G; Table 3). As previously reported, N3.43240A significantly attenuated signaling (Wootten et al., 2013b), and the N3.43240A/Q7.49394A double mutant yielded a similar level of impairment (Fig. 2, A and D). Interestingly, the N3.43240Q mutant had very little effect. Likewise, there was no significant loss of signaling with the N3.43240Q/Q7.49394N double mutant (Fig. 3 A and D).
Whereas mutational analysis provides increasing evidence for differences in the mechanism of receptor activation by GLP-1 and exendin-4, oxyntomodulin exhibits biased signaling for canonical pathways even at the wild-type receptor (Koole et al., 2010; Willard et al., 2012), and this is reflected in the effect of mutations on oxyntomodulin-mediated signaling. In contrast to GLP-1 and exendin-4, neither the E6.53364A nor the R2.60190A (Wootten et al., 2013b mutant impaired oxyntomodulin-mediated cAMP formation (Fig. 3, C, F, I; Table 3); indeed, the R2.60190A mutant augmented signaling. Interestingly, the most critical residues in this network were Q7.49394 and H6.52363. Both the Q7.49394N and the previously published Q7.49394A attenuated signaling. Also of note, the N3.43240Q/Q7.49394N mutant was more detrimental than the N3.43240A/Q7.49394A mutant.
H6.52363 is critical for cAMP production by all three peptides (Wootten et al., 2013b; Fig. 3; Table 3), and this may be a common component of all signaling to this pathway, albeit that the mechanism driving changes to the residue may be different for individual peptides.
Effect of Mutation on Calcium Mobilization.
The network required for calcium mobilization was distinct from that for cAMP generation for each of the peptides. For both GLP-1 (Fig. 4, A, D, G) and exendin-4 (Fig. 4, B, E, H), Q7.49394 and H6.52363 are critical for this signaling (Wootten et al., 2013b; Table 3). R2.60190 and E6.53364 were not required, as mutation to alanine did not significantly alter efficacy (Fig. 4, D, E; Table 3); thus, unlike cAMP signaling, the predicted interaction between these residues is not required for iCa2+ mobilization. In addition, for both GLP-1 and exendin-4, N3.43240 also appeared to play a limited role in efficacy. For exendin-4, the N3.43240A mutation was detrimental (Wootten et al., 2013b; Fig. 4E; Table 3), whereas the N3.43240Q displayed significantly different efficacy in response to GLP-1 (Fig. 4D; Table 3). Nonetheless, a similar trend to decrease efficacy was observed for the nonsignificant mutations of this amino acid for the two peptides. Interestingly, for oxyntomodulin, although Q7.49394 was also critical for calcium signaling (Fig. 4, C, F, I; Table 3), H6.52363 was not required. Instead, both R2.60190A and E6.53364A enhanced signaling, although this latter effect did not reach significance (Fig. 4, F; Table 3; Wootten et al., 2013b). In the wild-type receptor, R2.60190 and E6.53364 may retard the efficiency of oxyntomodulin-mediated signaling by limiting the conformational sampling available to Q7.49394 (Fig. 4I). Although the N3.43240A mutation did not have a significant effect on oxyntomodulin signaling, N3.43240Q caused marked attenuation of signaling (Fig. 4F; Table 3).
Fig. 4.

Effect of mutation of the central polar network on peptide-mediated iCa2+ mobilization. Upper panels (A–C) illustrate concentration-response curves for each of the peptides at the wild-type and mutant receptors with data fitted to the operational model. For clarity, only data from new mutants, or those previously not quantified, are displayed. Middle panels (D–F) illustrate affinity-independent measures of efficacy (Log tau) determined by operational modeling of the data, corrected for receptor Bmax at the cell surface: (A, D) GLP-1-mediated responses, (B, E) exendin-4-mediated responses, (C, F) oxyntomodulin-mediated responses. Data are displayed as mean ± S.EM. of four to six independent experiments, conducted in duplicate. *Significantly different from wild-type receptor at P < 0.05, ANOVA with Dunnett’s post-test. N.D., no response detected. V, vehicle. Data for expression of the previously published R2.60190A, N3.43240A, Q7.49394A, and H6.52363 receptor mutants (Wootten et al., 2013b) is included for comparison. (G–I) Molecular models (x-stick format) illustrating the predicted central interaction network and their impact on peptide-mediated intracellular calcium mobilization: (G) GLP-1, (H) exendin-4, (I) oxyntomodulin. Amino acids negatively impacted by mutation are colored red, those positively impacted in green, and those unaffected are colored by side-chain as in Fig. 1E. Predicted H-bonds are displayed as dotted lines.
Effect of Mutation on ERK1/2 Phosphorylation.
The pattern of effect of mutation on peptide-mediated pERK1/2 was similar for GLP-1 (Fig. 5, A, D, G) and exendin-4 (Fig. 5, B, E, H), although subtle differences were observed. Both R2.60190 and E6.53364 appeared to be important, albeit that the E6.53364A mutant effect did not reach significance for GLP-1 (Fig. 5, D and E; Table 3; Wootten et al., 2013b). Neither N3.43240Q, Q7.49394N, nor the N3.43240Q/Q7.49394N double mutant had any effect on efficacy; however, as described previously (Wootten et al., 2013b), N3.43240A either increased efficacy (exendin-4) or had no effect (GLP-1), and the Q7.49394A mutant decreased efficacy mediated by GLP-1, but this effect was not significant for exendin-4, although it followed the same trend (Fig. 5, D and E; Table 3; Wootten et al., 2013b). In both cases, the N3.43240A/Q7.49394A mutant was detrimental, whereas H6.52363A was the most unfavorable of the mutations in this network (Fig. 5, D and E; Table 3). In contrast, oxyntomodulin was minimally affected by any of the mutations, a limited decrease in efficacy with the N3.43240Q/Q7.49394N double mutant being the only significant effect (Fig. 5, C, F, I; Table 3).
Fig. 5.

Effect of mutation of the central polar network on peptide-mediated ERK phosphorylation. Upper panels (A–C) illustrate concentration-response curves for each of the peptides at the wild-type and mutant receptors with data fitted to the operational model. For clarity, only data from new mutants, or those previously not quantified, are displayed. Middle panels (D–F) illustrate affinity-independent measures of efficacy (Log tau) determined by operational modeling of the data, corrected for receptor Bmax at the cell surface: (A, D) GLP-1-mediated responses, (B, E) exendin-4-mediated responses, (C, F) oxyntomodulin-mediated responses. Data are displayed as mean ± S.E.M. of four to six independent experiments, conducted in duplicate. *Significantly different from wild-type receptor at P < 0.05, ANOVA with Dunnett’s post-test. V, vehicle. Data for expression of the previously published R2.60190A, N3.43240A, Q7.49394A, and H6.52363 receptor mutants (Wootten et al., 2013b) is included for comparison. (G–I) Molecular models (x-stick format) illustrating the predicted central interaction network and their impact on peptide-mediated ERK phosphorylation: (G) GLP-1, (H) exendin-4, (I) oxyntomodulin. Amino acids negatively impacted by mutation are colored red, those positively impacted in green, while those unaffected are colored by side-chain as in Fig. 1E. Predicted H-bonds are displayed as dotted lines.
Discussion
Class B peptide hormone receptors are critical for normal physiology and are significant targets for potential treatment of major disease, including diabetes and obesity. As such, understanding how peptides interact with and activate these receptors is fundamentally important. The recent solution of structures of the transmembrane domain of the glucagon and CRF1 receptors has provided novel insight into the nature of the core region of the receptor that is responsible for the allosteric transition that occurs upon peptide binding to enable effector coupling. In the inactive state, these receptors present a very open extracellular face that is likely to be hydrated (Hollenstein et al., 2013, 2014; Siu et al., 2013), suggesting that a key component of the binding and activation process may involve bulk displacement of water and/or the reordering of hydrogen bond networks; the latter is consistent with the current understanding of receptor activation for class A receptors (Zhou et al., 2000; Curran and Engelman, 2003; Angel et al., 2009; Illergard et al., 2011).
We previously reported the identification of a key network of amino acids in the GLP-1 receptor comprising R2.60190, N3.43240, and Q7.49394 that, when mutated, differentially altered the signaling of the peptide agonists GLP-1, exendin-4, and oxyntomodulin (Wootten et al., 2013b). In the current study we have used the recent structural information on class B GPCRs to re-evaluate our understanding of this network. Key differences in the original and revised GLP-1 receptor models included the relative positions of E6.53364 and H6.52363, within this network, and N5.50320, which, although important for signaling, was not predicted to directly interact with the network in the revised model. Interestingly, this led to clustering of key residues in a fulcrum position at the convergence of the extracellular ends of the TM helices (Fig. 1, C and D). The nature of the revised interaction network thus formed was further explored via mutation of E6.53364, which has been predicted to interact with R2.60190, along with conservative changes to N3.43240 and Q7.4939, extending or reducing the side chain length, respectively, in a manner that probed the probable importance of hydrogen bonding.
Comparison of the equivalent amino acid side chains in the glucagon and CRF1 structures revealed conservation in relative orientation of side chains (Fig. 6, A–C), even though quite distinct residues occurred in TM6 of the CRF1 receptor, namely Tyr at 6.53 and Thr at 6.52. In the glucagon receptor, maintenance of this network may be partially coordinated by water-mediated H-bonding (Fig. 6D). Thus, this network is likely to be highly constrained in the inactive state of the receptor. Indeed, in the glucagon receptor, the position of K2.60 (equivalent to R2.60 in the GLP-1 and CRF1 receptors) is restricted by H-bonding to S7.46, which in turn interacts with Y1.47, suggesting that one component of activation may include release of these constraints on amino acid 2.60, allowing a reordering of the network. In the GLP-1 receptor homology model, a similar interaction is predicted between T7.46391 and R2.60190/E6.53364 (Fig. 7A). Nonetheless, T7.46391A had limited effect on GLP-1 affinity and cAMP formation (Coopman et al., 2011), suggesting that other interactions predominate, at least for activation of this pathway. In the current study, we have modeled a GLP-1 bound form of the full-length receptor that incorporates known distance constraints from published cross-linking studies (Fig. 7B), and this model is generally consistent with that for the modeled peptide-bound glucagon receptor, where the peptide forms an extended helix and the N-terminus of the peptide binds within the open cavity of the TM bundle (Siu et al., 2013; Yang et al., 2015). In our model, the GLP-1 peptide is predicted to bind deep within the TM bundle and is associated with disruption of the central H-bond network (Fig. 7A versus Fig. 7B).
Fig. 6.

Comparison of the central polar network in the inactive (inverse-agonist bound) structures of the glucagon receptor (x-stick with polar hydrogens displayed) (A, C, D) and the inverse-agonist bound CRF1 receptor (B, C), illustrating that, despite divergence in amino acid sequence, the positionally equivalent residues have a similar orientation. (D) Hydration of the glucagon receptor structure predicts potential water-mediated H-bond interactions within the network. Waters are illustrated in CPK file format: red, oxygen; off-white, hydrogen.
Fig. 7.

Human GLP-1 receptor homology models. (A) Apo, transmembrane domain, model (blue backbone), with middle and bottom (180-degree rotation from the middle panel) panels, illustrating the central polar interaction network (x-stick, colored by amino acid side chain) and predicted H-bond interactions (colored dotted lines). (B) Full-length receptor model (orange backbone), bound to GLP-1(7-36)NH2 (pink), and C-terminal G protein peptide (red); middle and bottom (180-degree rotation from the middle panel) panels illustrate the central polar interaction network (x-stick, colored by amino acid side chain) and predicted disruption of the inactive network interactions. In this model, a direct interaction is predicted between peptide E9 and receptor R2.60190.
As previously noted, the GLP-1 receptor exhibits peptide-dependent biased agonism across the canonical signaling pathways of cAMP formation, calcium mobilization, and ERK phosphorylation and this is most notable for oxyntomodulin, which is biased toward pERK1/2 at the wild-type receptor (Koole et al., 2010; Wootten et al., 2013a; Willard et al., 2012). Whereas GLP-1 and exendin-4 have similar biases for these pathways at the wild-type receptor, there is increasing evidence from mutational studies that these peptides have distinct modes of receptor activation (Koole et al., 2012a and b, Wootten et al., 2013b), and this is also supported by differences in peptide-mediated activation of G protein chimeras in yeast (Weston et al., 2014). The current study provides additional evidence for how these peptides use the central polar network to drive activation of the receptor. The use of operational, analytical modeling of functional responses enables the separation of mutational effects on affinity from those on efficacy and allows the impact of mutation on different signaling endpoints to be measured.
Potential Mechanisms Driving Pathway Specific Signaling.
For GLP-1 and exendin-4, the principal driver for cAMP generation is the interaction between R2.60190 and E6.53364 that likely leads to conformational rearrangement of TM6. It is possible that this is initiated by release of H-bond interactions with upstream polar residues that are observed in the inactive glucagon receptor. In the case of GLP-1, optimal efficiency for this interaction is predicted to involve coordination of the position of R2.60190 through hydrogen bonding with N3.43240 that may favor interaction with peptide side-chain residues, in particular between R2.60190 and Glu at residue 3 [amino acid 9, where His7 is the first residue of GLP-1(7-36)NH2] of the GLP-1 (Fig. 7B) and exendin-4 peptides. This constraint can also be maintained by Gln substitution of 3.43, potentially by allowing more efficient hydrogen bonding to occur. In contrast, oxyntomodulin-mediated cAMP formation is driven via Q7.49394 and H6.52363 and could potentially involve formation of a hydrogen bond between these two amino acids, when the interaction between R2.60190 and E6.53364 is not fully disrupted (Fig. 3I). H6.52363 is a critical residue for all peptide-mediated cAMP formation through rearrangement of the side chain on activation, speculatively through either loss of interaction with E6.53364, via either disruption of the E6.53364/R2.60190 interaction (GLP-1, exendin-4), or via formation of a novel interaction with Q7.49394 (oxyntomodulin).
In contrast to the requirements for cAMP formation, peptide-mediated calcium mobilization does not require alteration of the interaction between R2.60190 and E6.53364 (Fig. 4, G–I). The common, critical residue for calcium mobilization by all peptides is Q7.49394. For GLP-1 and exendin-4, H6.52363 is also critical. This amino acid potentially forms interactions with Q7.49394 that constrain conformational sampling required for efficacy. The selective effects of other mutations may support the importance of conformational flexibility of Q7.49394 for calcium signaling, albeit in a peptide-selective manner. E6.53364 is predicted to H-bond directly with Q7.49394, constraining its mobility. For oxyntomodulin, which does not appear to activate the receptor in a manner that modifies interactions of R2.60190, the H-bond interaction between R2.60190 and E6.53364 potentially constrains the interaction between E6.53364 and Q7.49394, leading to reduced efficiency of signaling such that the R2.60190A mutation increases efficacy. As noted for cAMP, subtle differences in mechanism of receptor activation also occur for GLP-1 and exendin-4 and this is also seen for calcium signaling where the magnitude of effect for mutation of N3.43240 to Ala or Gln differs for the two peptides. We speculate that N3.43240 can also interact with R2.60190 and that this may in turn alter interactions with Q7.49394 indirectly via events coordinated through E6.53364 (Fig. 4, G and H).
While cAMP production and calcium mobilization are predominately G protein-mediated, the transient phosphorylation of ERK1/2 is the result of convergent signaling of both G protein-dependent and independent effectors (Montrose-Rafizadeh et al., 1999; Baggio and Drucker, 2006). As seen with cAMP accumulation, the interaction between R2.60190 and E6.53364 (Fig. 5, G and H) appeared to be required for efficient GLP-1- and exendin-4-mediated pERK1/2, although the magnitude of effect tended to be greater for the cAMP response. Likewise, H6.52363 was also critical for the response of these peptides, and this may be indicative of a significant contribution of G proteins to ERK1/2 signaling. N3.43240 and Q7.49394 played distinct roles for GLP-1 and exendin-4 but only in the context of nonconservative mutation and may imply a differential role of these residues in coordination with R2.60190 and/or E6.53364 for the two peptides.
In contrast to the effect of mutation on GLP-1- and exendin-4-mediated pERK1/2, there was very little effect of any of the mutants on oxyntomodulin-mediated signaling (Fig. 5F), with only the N3.43240Q/Q7.49394N double mutant significantly attenuating the response. This is consistent with the strong bias seen with oxyntomodulin for pERK1/2 versus cAMP or iCa2+ signaling (Koole et al., 2010; Willard et al., 2012; Wootten et al., 2013a). It may also imply distinction in the extent of engagement with different effectors. Thus the central network exemplified in the current study may be critical for G protein-mediated signaling but play a lesser role in non-G protein-dependent signaling. Furthermore, in addition to emphasizing major differences in receptor activation by oxyntomodulin compared with GLP-1 and exendin-4, the current work provides additional evidence of differences in the mechanism of activation transition elicited by GLP-1 and exendin-4. Recent work using chimeric G proteins in yeast indicates that exendin-4, as well as oxyntomodulin, may be biased toward Gi over Gs compared with GLP-1 (Weston et al., 2014), and arrestin recruitment studies also support distinct bias between GLP-1 and exendin-4 (Wootten et al., 2013a).
The conservation of key residues in the network and its fulcrum position in the structure of class B GPCRs suggests that it is likely to play a critical role in signaling for this subfamily. However, the distinctions in the data for different ligands of the GLP-1 receptor indicate that the specific mechanism of receptor activation is likely to be different for individual receptor ligand combinations. There are supporting data from studies of other class B receptors of the critical role of this network in receptor activation, with interaction of R2.60188, N3.43229, and Q7.49380 predicted from mutagenesis and modeling studies of the VPAC1 receptor (Solano et al., 2001; Chugunov et al., 2010; Langer, 2012). Intriguingly, R2.60188 is predicted to interact via a salt-bridge with D3 of vasoactive intestinal peptide, with this interaction contributing to receptor activation (Langer, 2012); the equivalent amino acid in GLP-1 and exendin-4 is Glu, whereas it is a Gln in oxyntomodulin. Modeling of GLP-1 peptide docking to the full-length receptor is consistent with formation of a direct, salt-bridge interaction between peptide Glu9 and R2.60190 (Fig. 7B). It is interesting to speculate that lack of an acidic residue at the third amino acid of oxyntomodulin may underlie the lack of engagement of the R2.60190/E6.53364 interaction in receptor activation.
Collectively, this work expands our understanding of peptide-mediated signaling from the GLP-1 receptor and the key role that the central polar network plays in these events. The ever-increasing availability of high-resolution structural data provides better understanding of the atomic events that are likely to drive receptor activation, though the dynamic nature of activation transition and the distinct ability of individual ligands to affect this process means that we will still require multiple approaches to derive an accurate understanding of these dynamics.
Supplementary Material
Abbreviations
- CHO
Chinese hamster ovary
- CRF
corticotropin releasing factor
- ECL
extracellular loop
- ECD
extracellular domain
- ERK
extracellular signal-regulated kinase
- FBS
fetal bovine serum
- GLP-1
glucagon-like peptide-1
- GPCR
G protein-coupled receptor
- iCa2+
intracellular Ca2+
- MD
molecular dynamics
- pERK1/2
phosphorylated extracellular signal-regulated kinase 1 and 2
- POPC
1-palmitoyl-2-oleoyl-sn-glycero-3-phosphocholine
- TM
transmembrane helix
Authorship Contributions
Participated in research design: Wootten, Sexton.
Conducted experiments: Wootten, Reynolds, Smith, Mobarec, Quon, Simms, Coudrat.
Performed data analysis: Wootten, Koole, Mobarec, Sexton, Christopoulos.
Wrote or contributed to the writing of the manuscript: Wootten, Koole, Reynolds, Furness, Miller, Christopoulos, Sexton.
Footnotes
This work was supported by National Health and Medical Research Council of Australia (NHMRC) project grants [1061044] and [1065410], and NHMRC program grant [1055134]; Biotechnology and Biological Sciences Research Council of the United Kingdom project grant [BB/M006883/1]; and Medical Research Council (UK) grant [G1001812]. P.M.S. and A.C. are NHMRC Principal Research Fellows. D.W. is a NHMRC Career Development Fellow. C.K. is a NHMRC C.J. Martin Postdoctoral Fellow. T.C. is the recipient of a Victorian Life Sciences Computation Initiative (VLSCI) scholarship. The computational studies were supported by resource allocation scheme grant no. VR0024 of the VLSCI on its Peak Computing Facility at the University of Melbourne.
 This article has supplemental material available at molpharm.aspetjournals.org.
References
- Angel TE, Chance MR, Palczewski K. (2009) Conserved waters mediate structural and functional activation of family A (rhodopsin-like) G protein-coupled receptors. Proc Natl Acad Sci USA 106:8555–8560. [DOI] [PMC free article] [PubMed] [Google Scholar]
- Baggio LL, Drucker DJ. (2006) Therapeutic approaches to preserve islet mass in type 2 diabetes. Annu Rev Med 57:265–281. [DOI] [PubMed] [Google Scholar]
- Baggio LL, Drucker DJ. (2007) Biology of incretins: GLP-1 and GIP. Gastroenterology 132:2131–2157. [DOI] [PubMed] [Google Scholar]
- Black JW, Leff P. (1983) Operational models of pharmacological agonism. Proc R Soc Lond B Biol Sci 220:141–162. [DOI] [PubMed] [Google Scholar]
- Caltabiano G, Gonzalez A, Cordomí A, Campillo M, Pardo L. (2013) The role of hydrophobic amino acids in the structure and function of the rhodopsin family of G protein-coupled receptors. Methods Enzymol 520:99–115. [DOI] [PubMed] [Google Scholar]
- Chen Q, Pinon DI, Miller LJ, Dong M. (2009) Molecular basis of glucagon-like peptide 1 docking to its intact receptor studied with carboxyl-terminal photolabile probes. J Biol Chem 284:34135–34144. [DOI] [PMC free article] [PubMed] [Google Scholar]
- Chen Q, Pinon DI, Miller LJ, Dong M. (2010) Spatial approximations between residues 6 and 12 in the amino-terminal region of glucagon-like peptide 1 and its receptor: a region critical for biological activity. J Biol Chem 285:24508–24518. [DOI] [PMC free article] [PubMed] [Google Scholar]
- Cheong YH, Kim MK, Son MH, Kaang BK. (2012) Two small molecule agonists of glucagon-like peptide-1 receptor modulate the receptor activation response differently. Biochem Biophys Res Commun 417:558–563. [DOI] [PubMed] [Google Scholar]
- Chugunov AO, Simms J, Poyner DR, Dehouck Y, Rooman M, Gilis D, Langer I. (2010) Evidence that interaction between conserved residues in transmembrane helices 2, 3, and 7 are crucial for human VPAC1 receptor activation. Mol Pharmacol 78:394–401. [DOI] [PubMed] [Google Scholar]
- Coopman K, Huang Y, Johnston N, Bradley SJ, Wilkinson GF, Willars GB. (2010) Comparative effects of the endogenous agonist glucagon-like peptide-1 (GLP-1)-(7-36) amide and the small-molecule ago-allosteric agent “compound 2” at the GLP-1 receptor. J Pharmacol Exp Ther 334:795–808. [DOI] [PMC free article] [PubMed] [Google Scholar]
- Coopman K, Wallis R, Robb G, Brown AJH, Wilkinson GF, Timms D, Willars GB. (2011) Residues within the transmembrane domain of the glucagon-like peptide-1 receptor involved in ligand binding and receptor activation: modelling the ligand-bound receptor. Mol Endocrinol 25:1804–1818. [DOI] [PMC free article] [PubMed] [Google Scholar]
- Curran AR, Engelman DM. (2003) Sequence motifs, polar interactions and conformational changes in helical membrane proteins. Curr Opin Struct Biol 13:412–417. [DOI] [PubMed] [Google Scholar]
- Dickson CJ, Madej BD, Skjevik AA, Betz RM, Teigen K, Gould IR, Walker RC. (2014) Lipid 14: The Amber Lipid Force Field. J Chem Theory Comput 10:865–879. [DOI] [PMC free article] [PubMed] [Google Scholar]
- Eswar N, Webb B, Marti-Renom MS, Madhusudham MS, Eramian D, Shen MY, Pieper U, and Sali A (2007). Comparative protein structure modeling with MODELLER. Curr Protoc Protein Sci 2:Unit 2.9. [DOI] [PubMed]
- Friesner RA, Banks JL, Murphy RB, Halgren TA, Klicic JJ, Mainz DT, Repasky MP, Knoll EH, Shelley M, Perry JK, et al. (2004) Glide: a new approach for rapid, accurate docking and scoring. 1. Method and assessment of docking accuracy. J Med Chem 47:1739–1749. [DOI] [PubMed] [Google Scholar]
- Harvey MJ, Giupponi G, Fabritiis GD. (2009) ACEMD: Accelerating biomolecular dynamics in the microsecond time scale. J Chem Theory Comput 5:1632–1639. [DOI] [PubMed] [Google Scholar]
- Hoang HN, Song K, Hill TA, Derksen DR, Edmonds DJ, Kok WM, Limberakis C, Liras S, Loria PM, Mascitti V, et al. (2015) Short hydrophobic peptides with cyclic constraints are potent glucagon-like peptide-1 receptor (GLP-1R) agonists. J Med Chem 58:4080–4085. [DOI] [PubMed] [Google Scholar]
- Hollenstein K, de Graaf C, Bortolato A, Wang MW, Marshall FH, Stevens RC. (2014) Insights into the structure of class B GPCRs. Trends Pharmacol Sci 35:12–22. [DOI] [PMC free article] [PubMed] [Google Scholar]
- Hollenstein K, Kean J, Bortolato A, Cheng RK, Doré AS, Jazayeri A, Cooke RM, Weir M, Marshall FH. (2013) Structure of class B GPCR corticotropin-releasing factor receptor 1. Nature 499:438–443. [DOI] [PubMed] [Google Scholar]
- Hornak V, Abel R, Okur A, Strockbine B, Roitberg A, Simmerling C. (2006) Comparison of multiple Amber force fields and development of improved protein backbone parameters. Proteins 65:712–725. [DOI] [PMC free article] [PubMed] [Google Scholar]
- Humphrey W, Dalke A, Schulten K. (1996) VMD: Visual molecular dynamics. J Mol Graph 14:33–38. [DOI] [PubMed] [Google Scholar]
- Illergård K, Kauko A, Elofsson A. (2011) Why are polar residues within the membrane core evolutionary conserved? Proteins 79:79–91. [DOI] [PubMed] [Google Scholar]
- Jacobson MP, Pincus DL, Rapp CS, Day TJ, Honig B, Shaw DE, Friesner RA. (2004) A hierarchical approach to all-atom protein loop prediction. Proteins 55:351–367. [DOI] [PubMed] [Google Scholar]
- Jorgensen R, Kubale V, Vrecl M, Schwartz TW, Elling CE. (2007) Oxyntomodulin differentially affects glucagon-like peptide-1 receptor β-arrestin recruitment and signaling through Galpha(s). J Pharmacol Exp Ther 322:148–154. [DOI] [PubMed] [Google Scholar]
- Katritch V, Fenalti G, Abola EE, Roth BL, Cherezov V, Stevens RC. (2014) Allosteric sodium in class A GPCR signaling. Trends Biochem Sci 39:233–244. [DOI] [PMC free article] [PubMed] [Google Scholar]
- Kenakin T, Christopoulos A. (2013) Signalling bias in new drug discovery: detection, quantification and therapeutic impact. Nat Rev Drug Discov 12:205–216. [DOI] [PubMed] [Google Scholar]
- Kenakin T, Watson C, Muniz-Medina V, Christopoulos A, Novick S. (2012) A simple method for quantifying functional selectivity and agonist bias. ACS Chem Neurosci 3:193–203. [DOI] [PMC free article] [PubMed] [Google Scholar]
- Koole C, Pabreja K, Savage EE, Wootten D, Furness SG, Miller LJ, Christopoulos A, Sexton PM. (2013) Recent advances in understanding GLP-1R (glucagon-like peptide-1 receptor) function. Biochem Soc Trans 41:172–179. [DOI] [PubMed] [Google Scholar]
- Koole C, Wootten D, Simms J, Valant C, Sridhar R, Woodman OL, Miller LJ, Summers RJ, Christopoulos A, Sexton PM. (2010) Allosteric ligands of the glucagon-like peptide 1 receptor (GLP-1R) differentially modulate endogenous and exogenous peptide responses in a pathway-selective manner: implications for drug screening. Mol Pharmacol 78:456–465. [DOI] [PMC free article] [PubMed] [Google Scholar]
- Koole C, Wootten D, Simms J, Valant C, Miller LJ, Christopoulos A, Sexton PM. (2011) Polymorphism and ligand dependent changes in human glucagon-like peptide-1 receptor (GLP-1R) function: allosteric rescue of loss of function mutation. Mol Pharmacol 80:486–497. [DOI] [PMC free article] [PubMed] [Google Scholar]
- Koole C, Wootten D, Simms J, Miller LJ, Christopoulos A, Sexton PM. (2012a) Second extracellular loop of human glucagon-like peptide-1 receptor (GLP-1R) has a critical role in GLP-1 peptide binding and receptor activation. J Biol Chem 287:3642–3658. [DOI] [PMC free article] [PubMed] [Google Scholar]
- Koole C, Wootten D, Simms J, Savage EE, Miller LJ, Christopoulos A, Sexton PM. (2012b) Second extracellular loop of human glucagon-like peptide-1 receptor (GLP-1R) differentially regulates orthosteric but not allosteric agonist binding and function. J Biol Chem 287:3659–3673. [DOI] [PMC free article] [PubMed] [Google Scholar]
- Langer I. (2012) Conformational switches in the VPAC(1) receptor. Br J Pharmacol 166:79–84. [DOI] [PMC free article] [PubMed] [Google Scholar]
- May LT, Avlani VA, Langmead CJ, Herdon HJ, Wood MD, Sexton PM, Christopoulos A. (2007) Structure-function studies of allosteric agonism at M2 muscarinic acetylcholine receptors. Mol Pharmacol 72:463–476. [DOI] [PubMed] [Google Scholar]
- Miller LJ, Chen Q, Lam PC, Pinon DI, Sexton PM, Abagyan R, Dong M. (2011) Refinement of glucagon-like peptide 1 docking to its intact receptor using mid-region photolabile probes and molecular modeling. J Biol Chem 286:15895–15907. [DOI] [PMC free article] [PubMed] [Google Scholar]
- Montrose-Rafizadeh C, Avdonin P, Garant MJ, Rodgers BD, Kole S, Yang H, Levine MA, Schwindinger W, Bernier M. (1999) Pancreatic glucagon-like peptide-1 receptor couples to multiple G proteins and activates mitogen-activated protein kinase pathways in Chinese hamster ovary cells. Endocrinology 140:1132–1140. [DOI] [PubMed] [Google Scholar]
- Moon MJ, Lee YN, Park S, Reyes-Alcaraz A, Hwang JI, Millar RP, Choe H, Seong JY. (2015) Ligand binding pocket formed by evolutionarily conserved residues in the glucagon-like peptide-1 (GLP-1) receptor core domain. J Biol Chem 290:5696–5706. [DOI] [PMC free article] [PubMed] [Google Scholar]
- Pabreja K, Mohd MA, Koole C, Wootten D, and Furness SG (2014) Molecular mechanisms underlying physiological and receptor pleiotropic effects mediated by GLP-1R activation. Brit J Pharmacol 171:1114–1128. [DOI] [PMC free article] [PubMed] [Google Scholar]
- Rasmussen SGF, DeVree BT, Zou Y, Kruse AC, Chung KY, Kobilka TS, Thian FS, Chae PS, Pardon E, Calinski D, et al. (2011) Crystal structure of the β2 adrenergic receptor-Gs protein complex. Nature 477:549–555. [DOI] [PMC free article] [PubMed] [Google Scholar]
- Shonberg J, Lopez L, Scammells PJ, Christopoulos A, Capuano B, Lane JR. (2014) Biased agonism at G protein-coupled receptors: the promise and the challenges--a medicinal chemistry perspective. Med Res Rev 34:1286–1330. [DOI] [PubMed] [Google Scholar]
- Siu FY, He M, de Graaf C, Han GW, Yang D, Zhang Z, Zhou C, Xu Q, Wacker D, Joseph JS, et al. (2013) Structure of the human glucagon class B G-protein-coupled receptor. Nature 499:444–449. [DOI] [PMC free article] [PubMed] [Google Scholar]
- Solano RM, Langer I, Perret J, Vertongen P, Juarranz MG, Robberecht P, Waelbroeck M. (2001) Two basic residues of the h-VPAC1 receptor second transmembrane helix are essential for ligand binding and signal transduction. J Biol Chem 276:1084–1088. [DOI] [PubMed] [Google Scholar]
- Tubert-Brohman I, Sherman W, Repasky M, Beuming T. (2013) Improved docking of polypeptides with Glide. J Chem Inf Model 53:1689–1699. [DOI] [PubMed] [Google Scholar]
- Underwood CR, Garibay P, Knudsen LB, Hastrup S, Peters GH, Rudolph R, Reedtz-Runge S. (2010) Crystal structure of glucagon-like peptide-1 in complex with the extracellular domain of the glucagon-like peptide-1 receptor. J Biol Chem 285:723–730. [DOI] [PMC free article] [PubMed] [Google Scholar]
- Venkatakrishnan AJ, Deupi X, Lebon G, Tate CG, Schertler GF, Babu MM. (2013) Molecular signatures of G-protein-coupled receptors. Nature 494:185–194. [DOI] [PubMed] [Google Scholar]
- Vertongen P, Solano RM, Perret J, Langer I, Robberecht P, Waelbroeck M. (2001) Mutational analysis of the human vasoactive intestinal peptide receptor subtype VPAC(2): role of basic residues in the second transmembrane helix. Br J Pharmacol 133:1249–1254. [DOI] [PMC free article] [PubMed] [Google Scholar]
- Weston C, Poyner D, Patel V, Dowell S, Ladds G. (2014) Investigating G protein signalling bias at the glucagon-like peptide-1 receptor in yeast. Br J Pharmacol 171:3651–3665. [DOI] [PMC free article] [PubMed] [Google Scholar]
- Willard FS, Wootten D, Showalter AD, Savage EE, Ficorilli J, Farb TB, Bokvist K, Alsina-Fernandez J, Furness SG, Christopoulos A, et al. (2012) Small molecule allosteric modulation of the glucagon-like Peptide-1 receptor enhances the insulinotropic effect of oxyntomodulin. Mol Pharmacol 82:1066–1073. [DOI] [PubMed] [Google Scholar]
- Wootten D, Savage EE, Willard FS, Bueno AB, Sloop KW, Christopoulos A, Sexton PM. (2013a) Differential activation and modulation of the glucagon-like peptide-1 receptor by small molecule ligands. Mol Pharmacol 83:822–834. [DOI] [PubMed] [Google Scholar]
- Wootten D, Simms J, Miller LJ, Christopoulos A, Sexton PM. (2013b) Polar transmembrane interactions drive formation of ligand-specific and signal pathway-biased family B G protein-coupled receptor conformations. Proc Natl Acad Sci USA 110:5211–5216. [DOI] [PMC free article] [PubMed] [Google Scholar]
- Yang L, Yang D, de Graaf C, Moeller A, West GM, Dharmarajan V, Wang C, Siu FY, Song G, Reedtz-Runge S, et al. (2015) Conformational states of the full-length glucagon receptor. Nat Commun 6:7859 10.1038/ncomms8859. [DOI] [PMC free article] [PubMed] [Google Scholar]
- Zhou FX, Cocco MJ, Russ WP, Brunger AT, Engelman DM. (2000) Interhelical hydrogen bonding drives strong interactions in membrane proteins. Nat Struct Biol 7:154–160. [DOI] [PubMed] [Google Scholar]
Associated Data
This section collects any data citations, data availability statements, or supplementary materials included in this article.