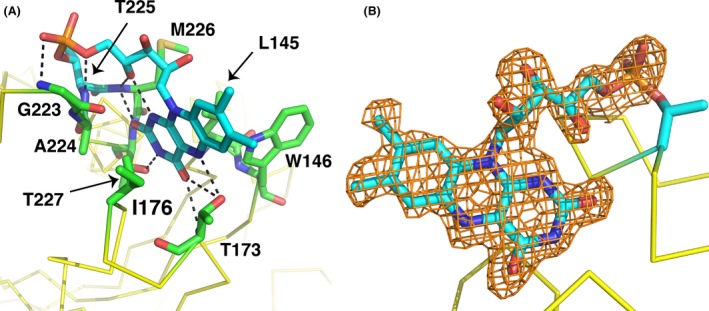
Figure 7.

Flavin site geometry of NqrC_So structure. (A) Shown in stick representation with green carbon atoms are residues involved in interactions with the phosphoester‐threonyl‐FMN residue, which is shown with cyan carbons. (B) Omit electron density around the FMN portion of the pT‐FMN ligand. Shown in orange mesh is the |mFo – DFc| omit electron density, contoured at the 2.5σ level and superimposed on the refined structure coordinates. This map was calculated by omitting the FMN portion of the pT‐FMN ligand from the model and conducting three rounds of maximum‐likelihood positional and B‐factor refinement.
