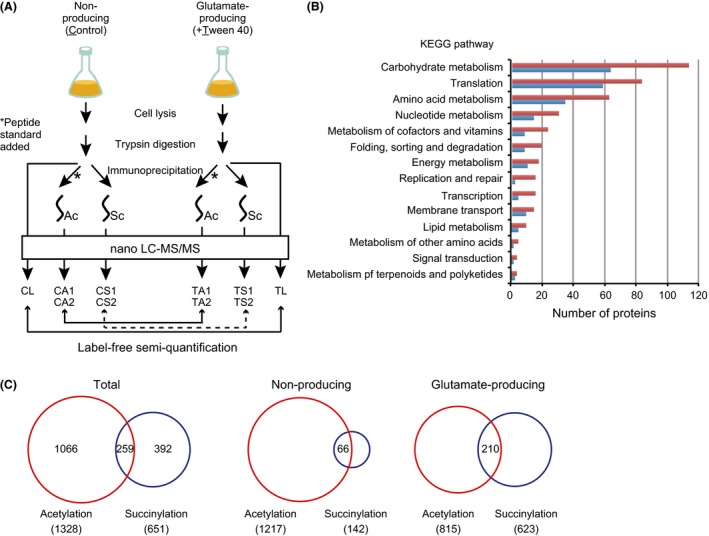
Figure 2.

Acetylome and succinylome analyses of Corynebacterium glutamicum. (A) Experimental workflow for the acetylome, succinylome, and proteome analyses in this study. (B) Functional classification of the identified acetylated (604) and succinylated (288) proteins based on the Kyoto Encyclopedia of Genes and Genome (KEGG) orthology database. The numbers of acetylated and succinylated proteins are indicated with red and blue bars, respectively. (C) Venn diagram showing the overlap and distribution of acetylation and succinylation sites in total, nonglutamate‐producing, and glutamate‐producing conditions. Red and blue circles represent acetylation and succinylation sites, respectively. The number of sites in each category is shown.
